The V0C distributions in minimum-bias events in data, PYTHIA 8.2 Monash MC and EPOS3 MC. The chosen multiplicity classes are indicated by alternating gray and white areas. The percentile ranges corresponding to the multiplicity classes (from low to high multiplicities) are 70-100%, 50-70%, 40-50%, 30-40%, 20-30%, 15-20%, 10-15%, 5-10%, 1-5%, 0.5-1%, 0.25-0.5%, 0-0.25%. The bottom panel shows the ratio between data and MC. | 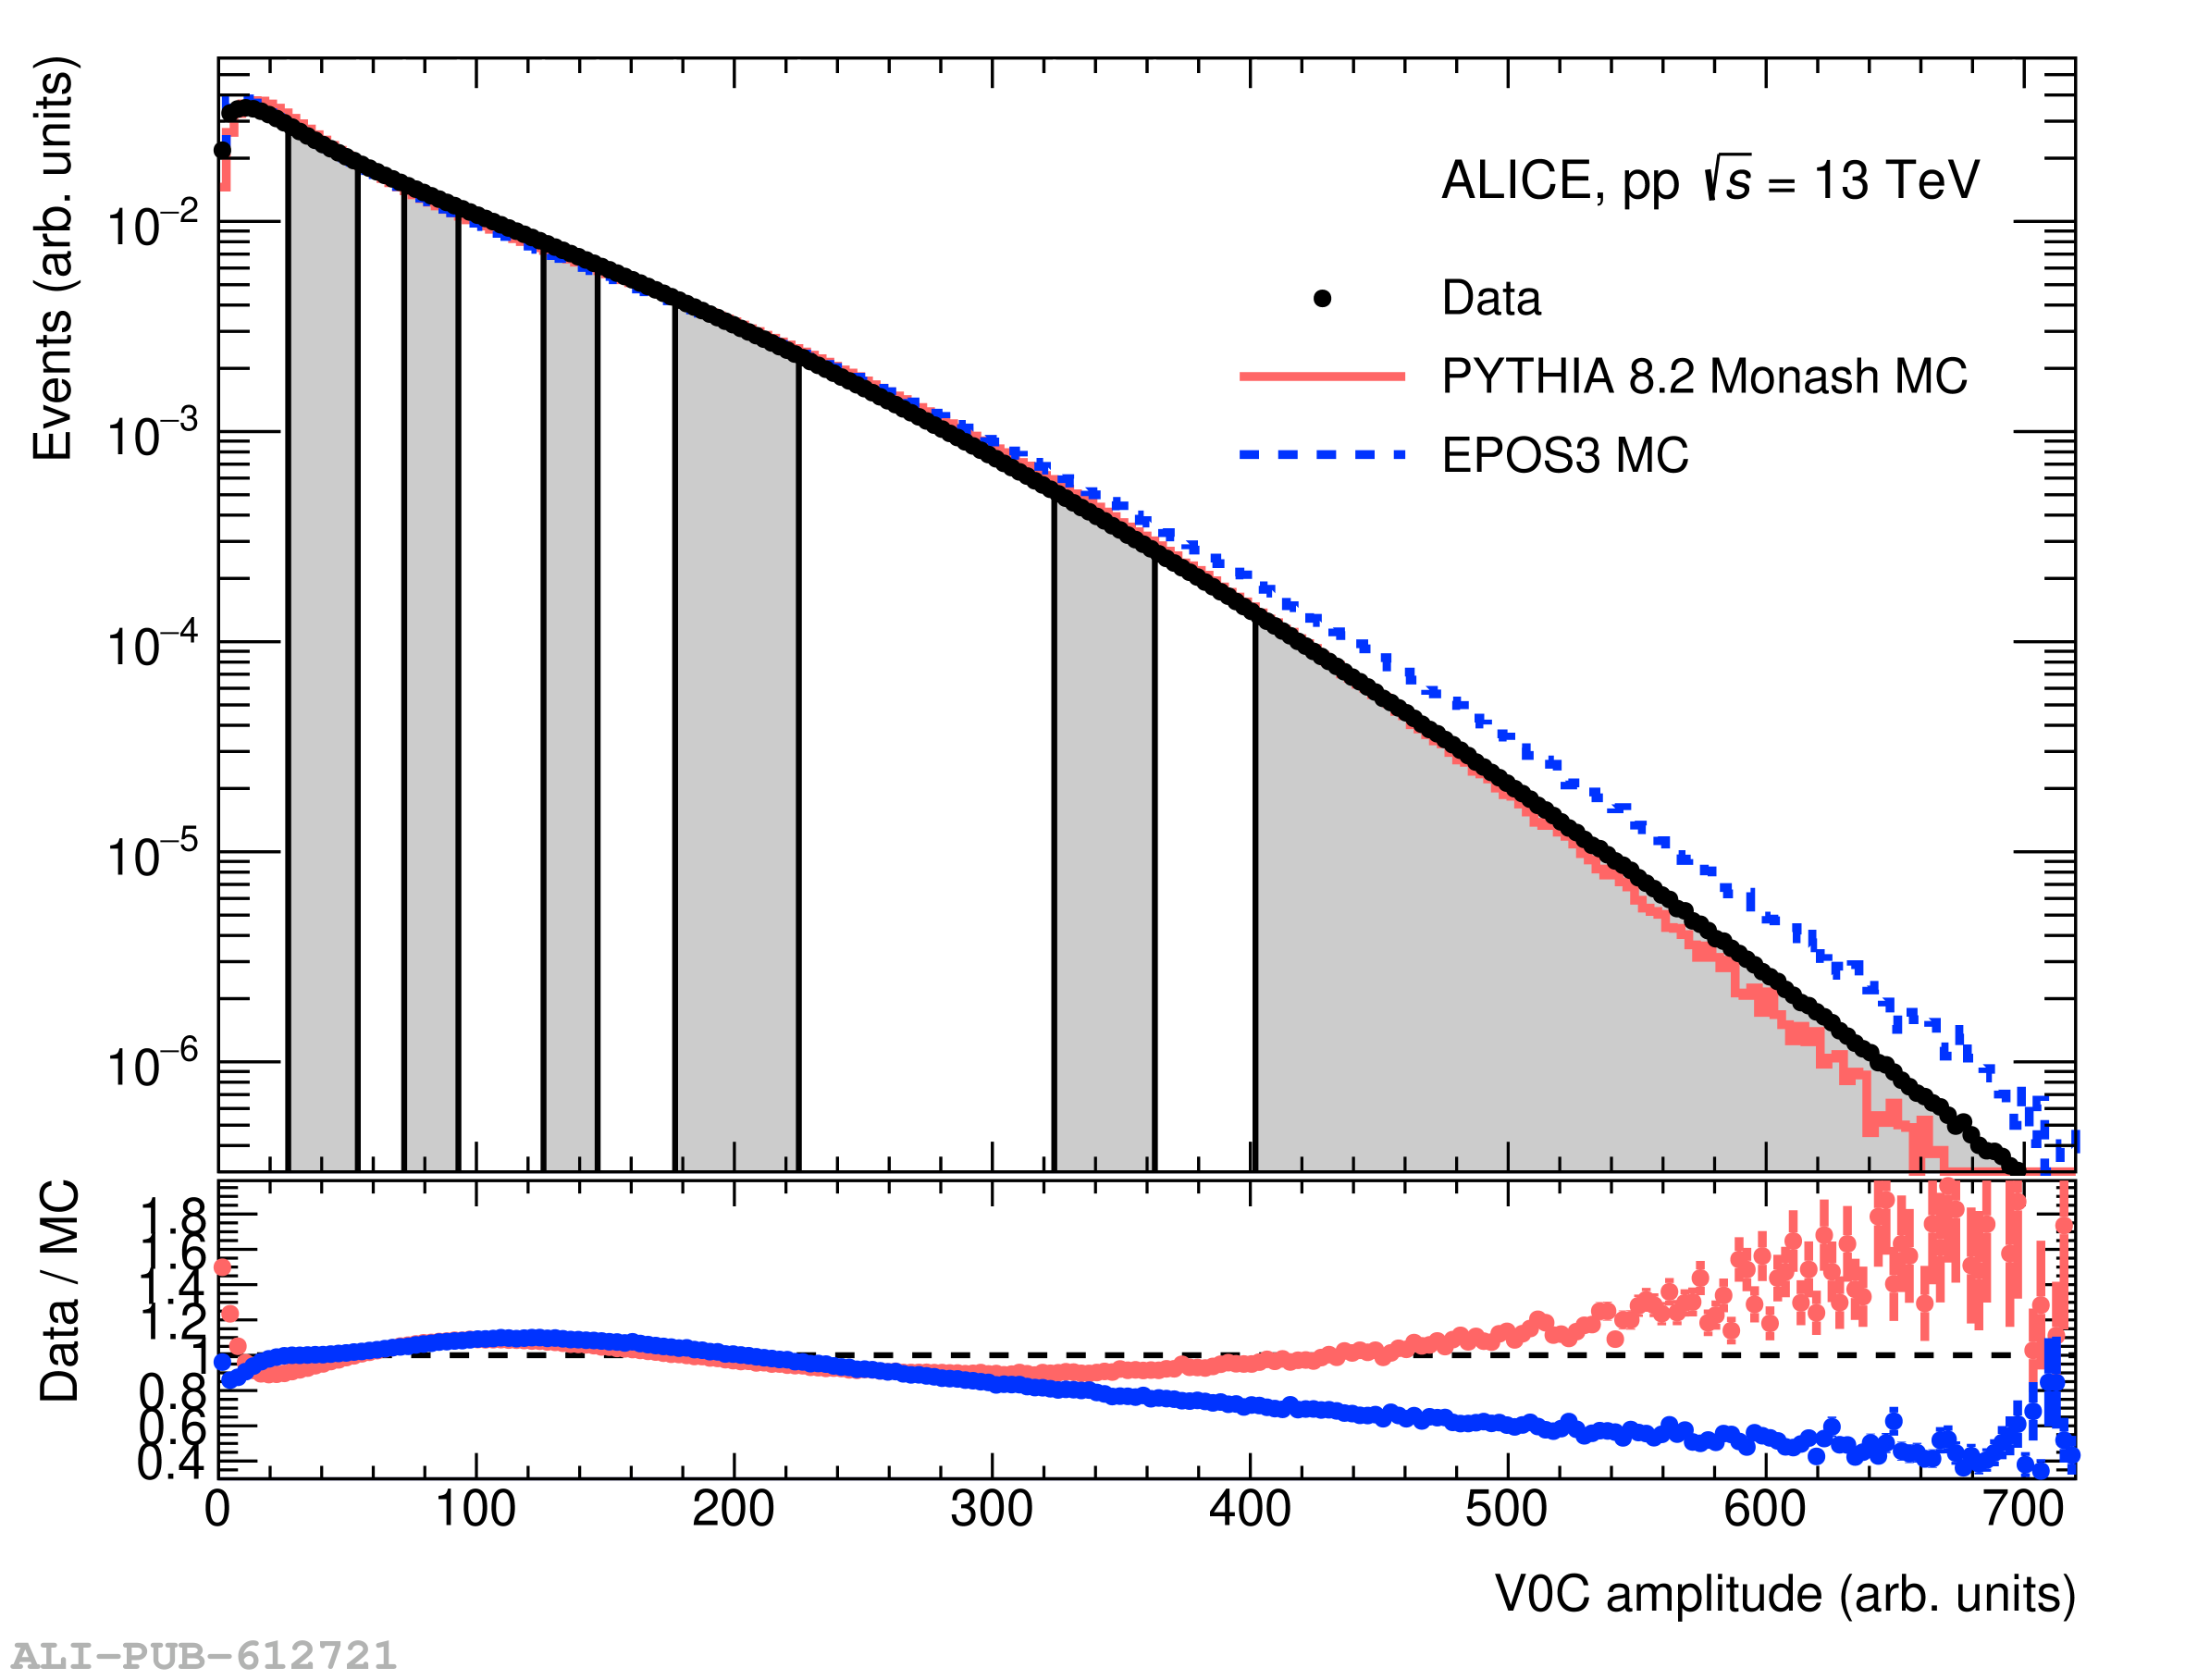 |