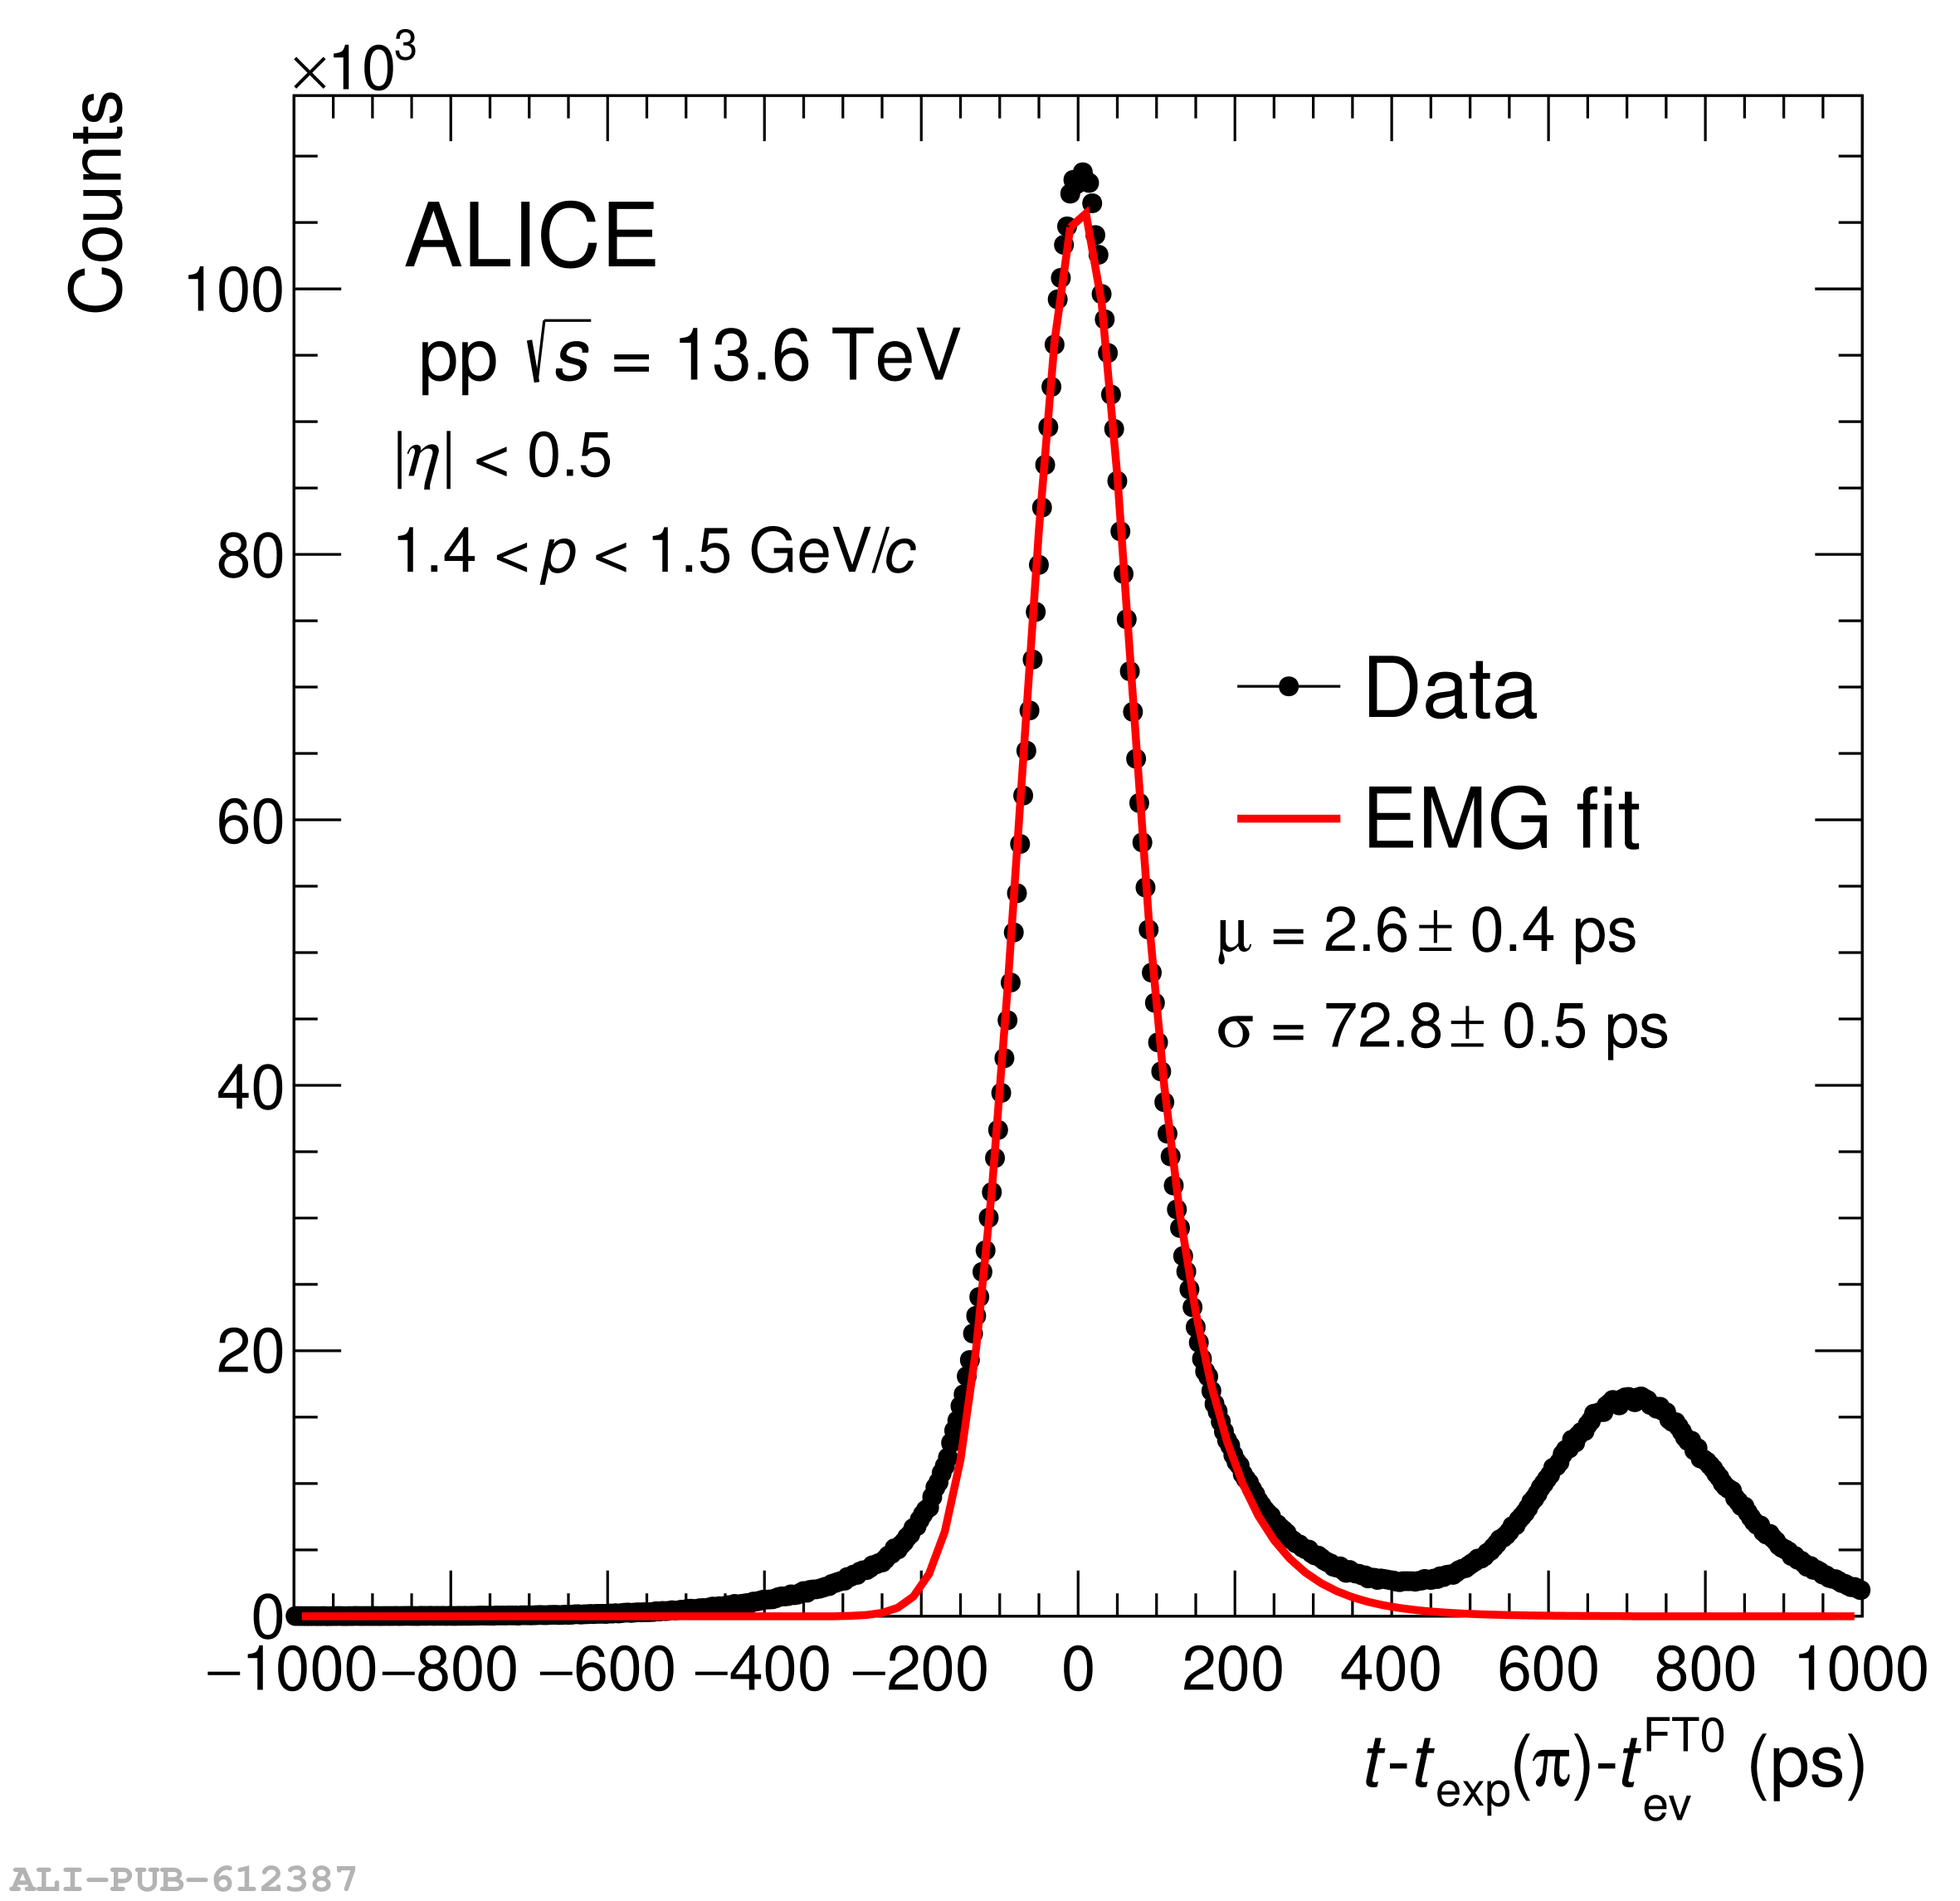
Distribution of the \deltaPiTZAC in the momentum range $ 1.4 p \gevc{1.5}$ The red curve represents the Gaussian fit used to extract the time resolution The fit is done in the range (-200, 200) ps, and the results obtained from different ranges are taken into account in the error.