$\Delta y$-correlation function distribution compared with MC models (PYTHIA8 Monash 2013 in blue, EPOS LHC in red, EPOS4 in green, and PYTHIA 8.315 in magenta) in pp collision at $\sqrt{s} = 13$ TeV by using the $C_{\rm{R}}$ definition for unlike-sign pions, kaons, and protons (top-to-bottom) for the highest (0--1\%), middle (30--40\%), and lowest (90--100\%) multiplicity classes (left-to-right). | 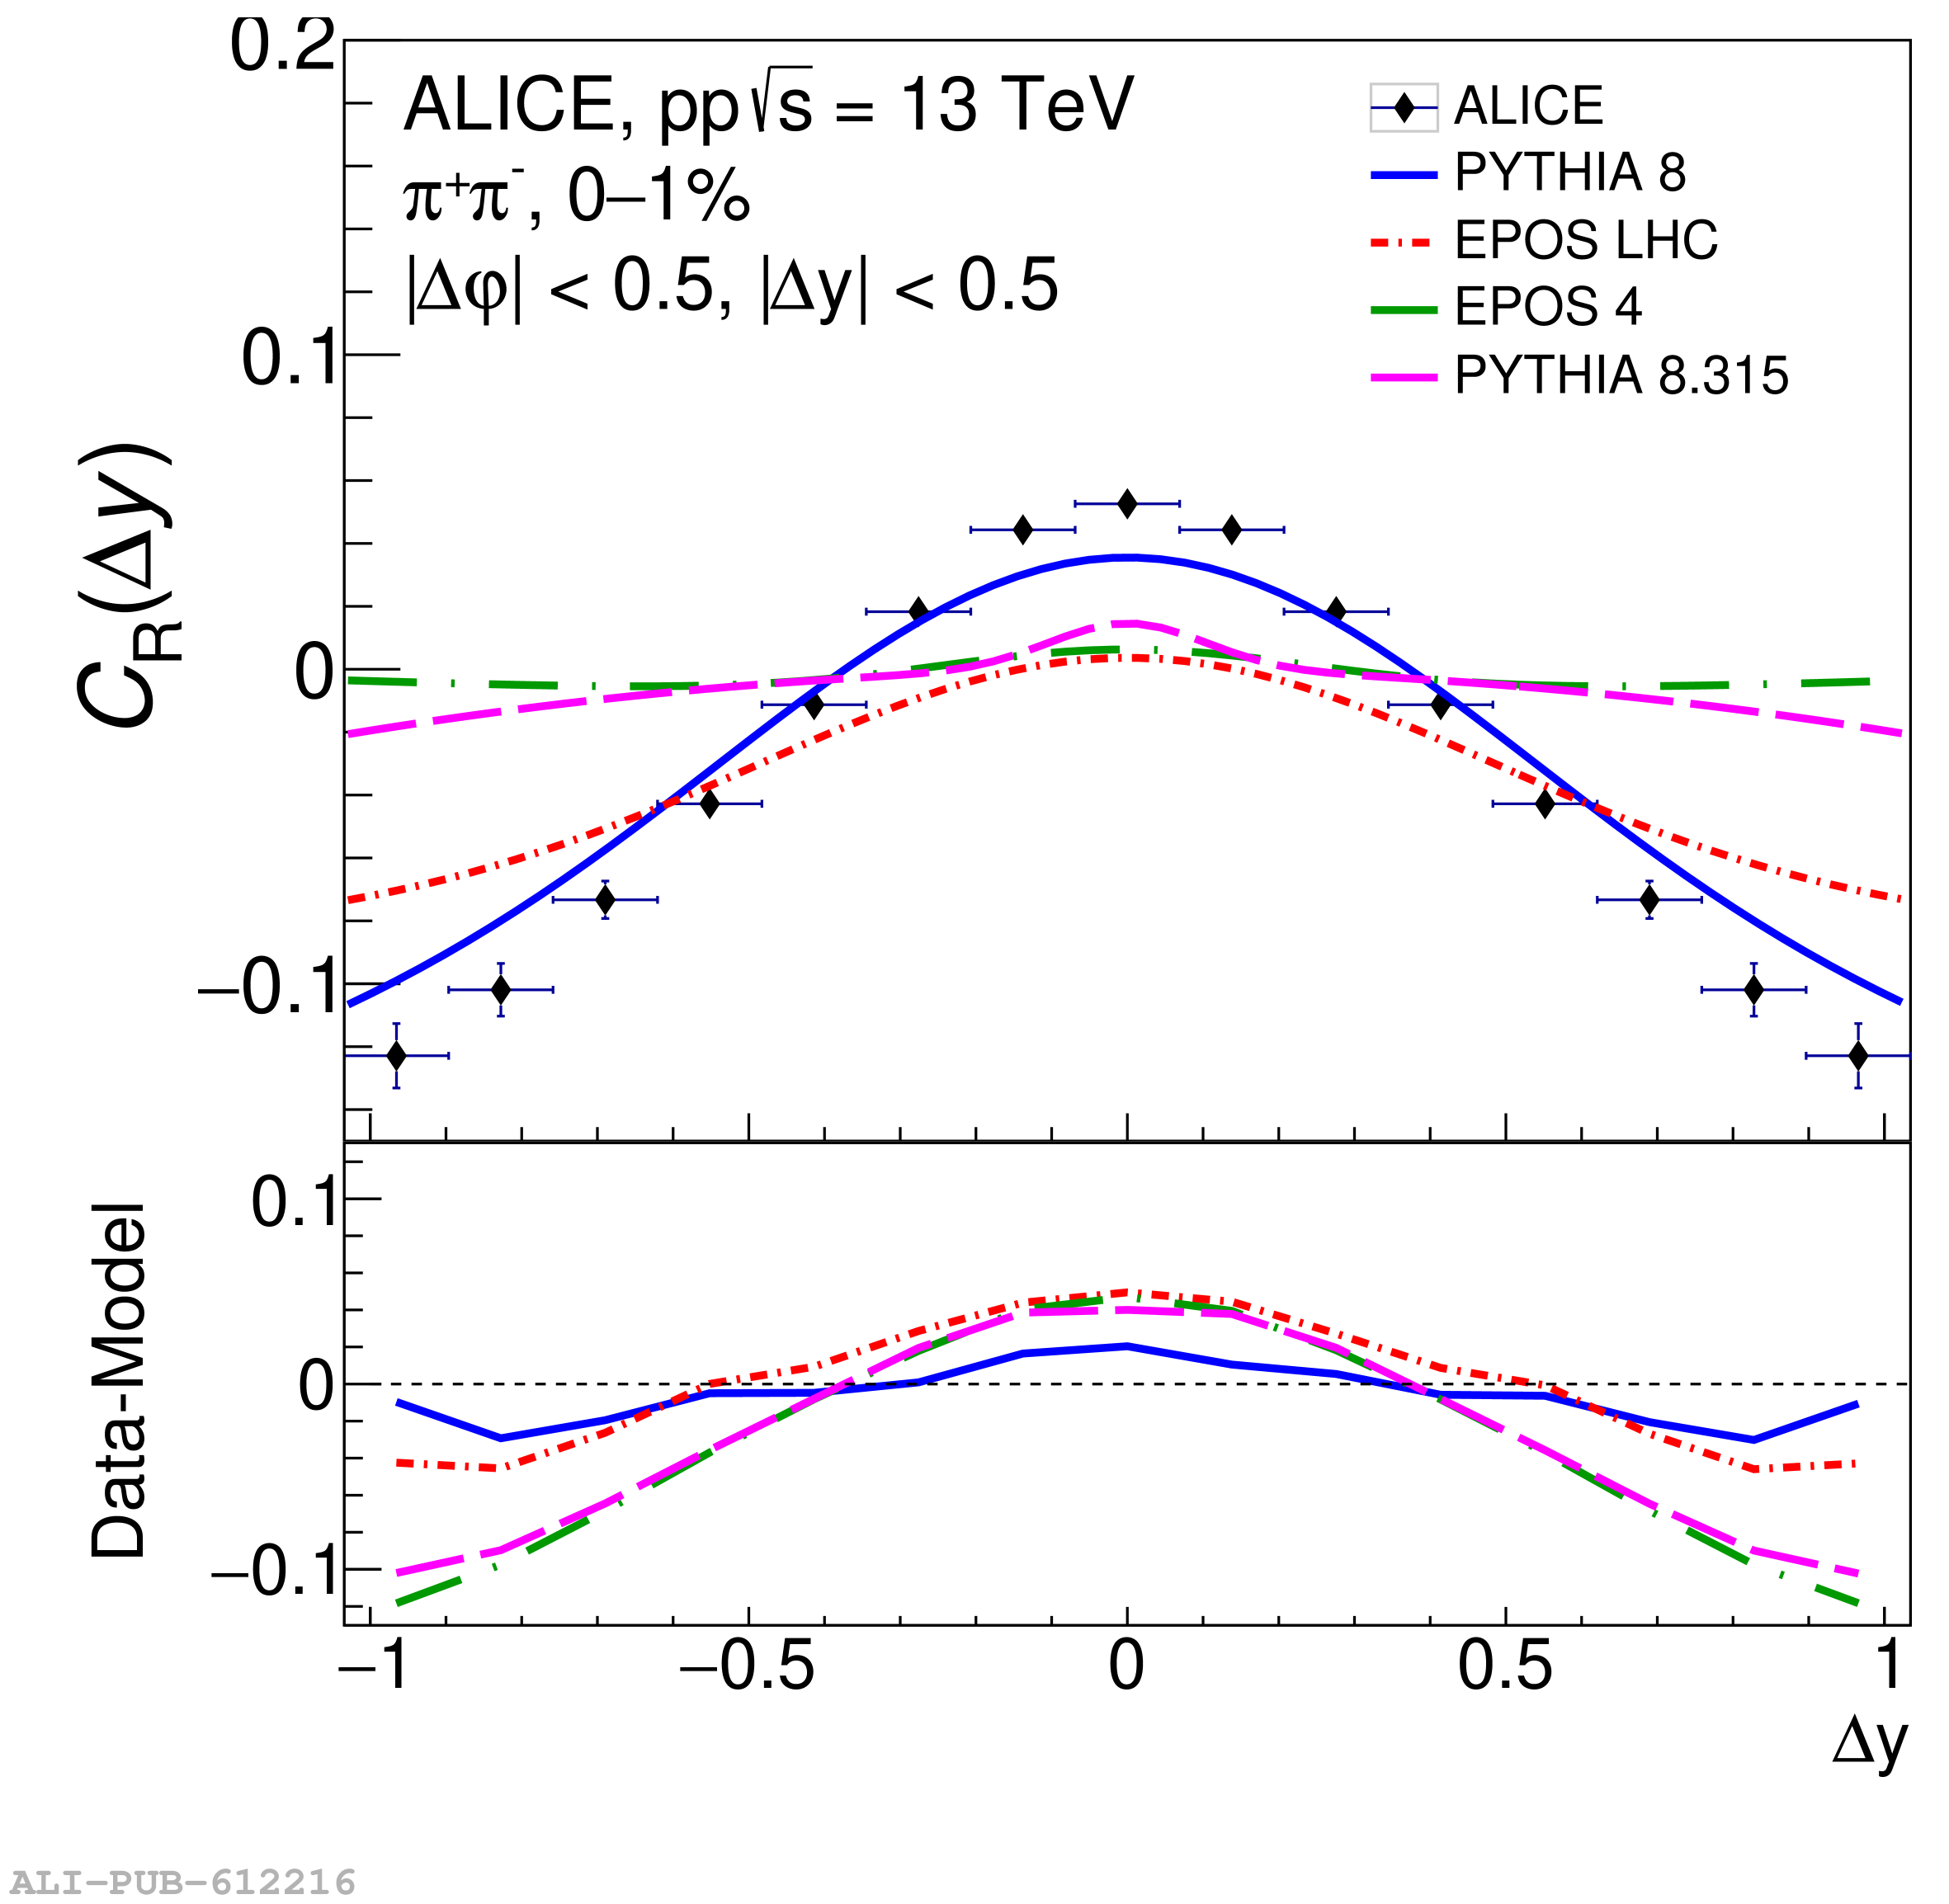 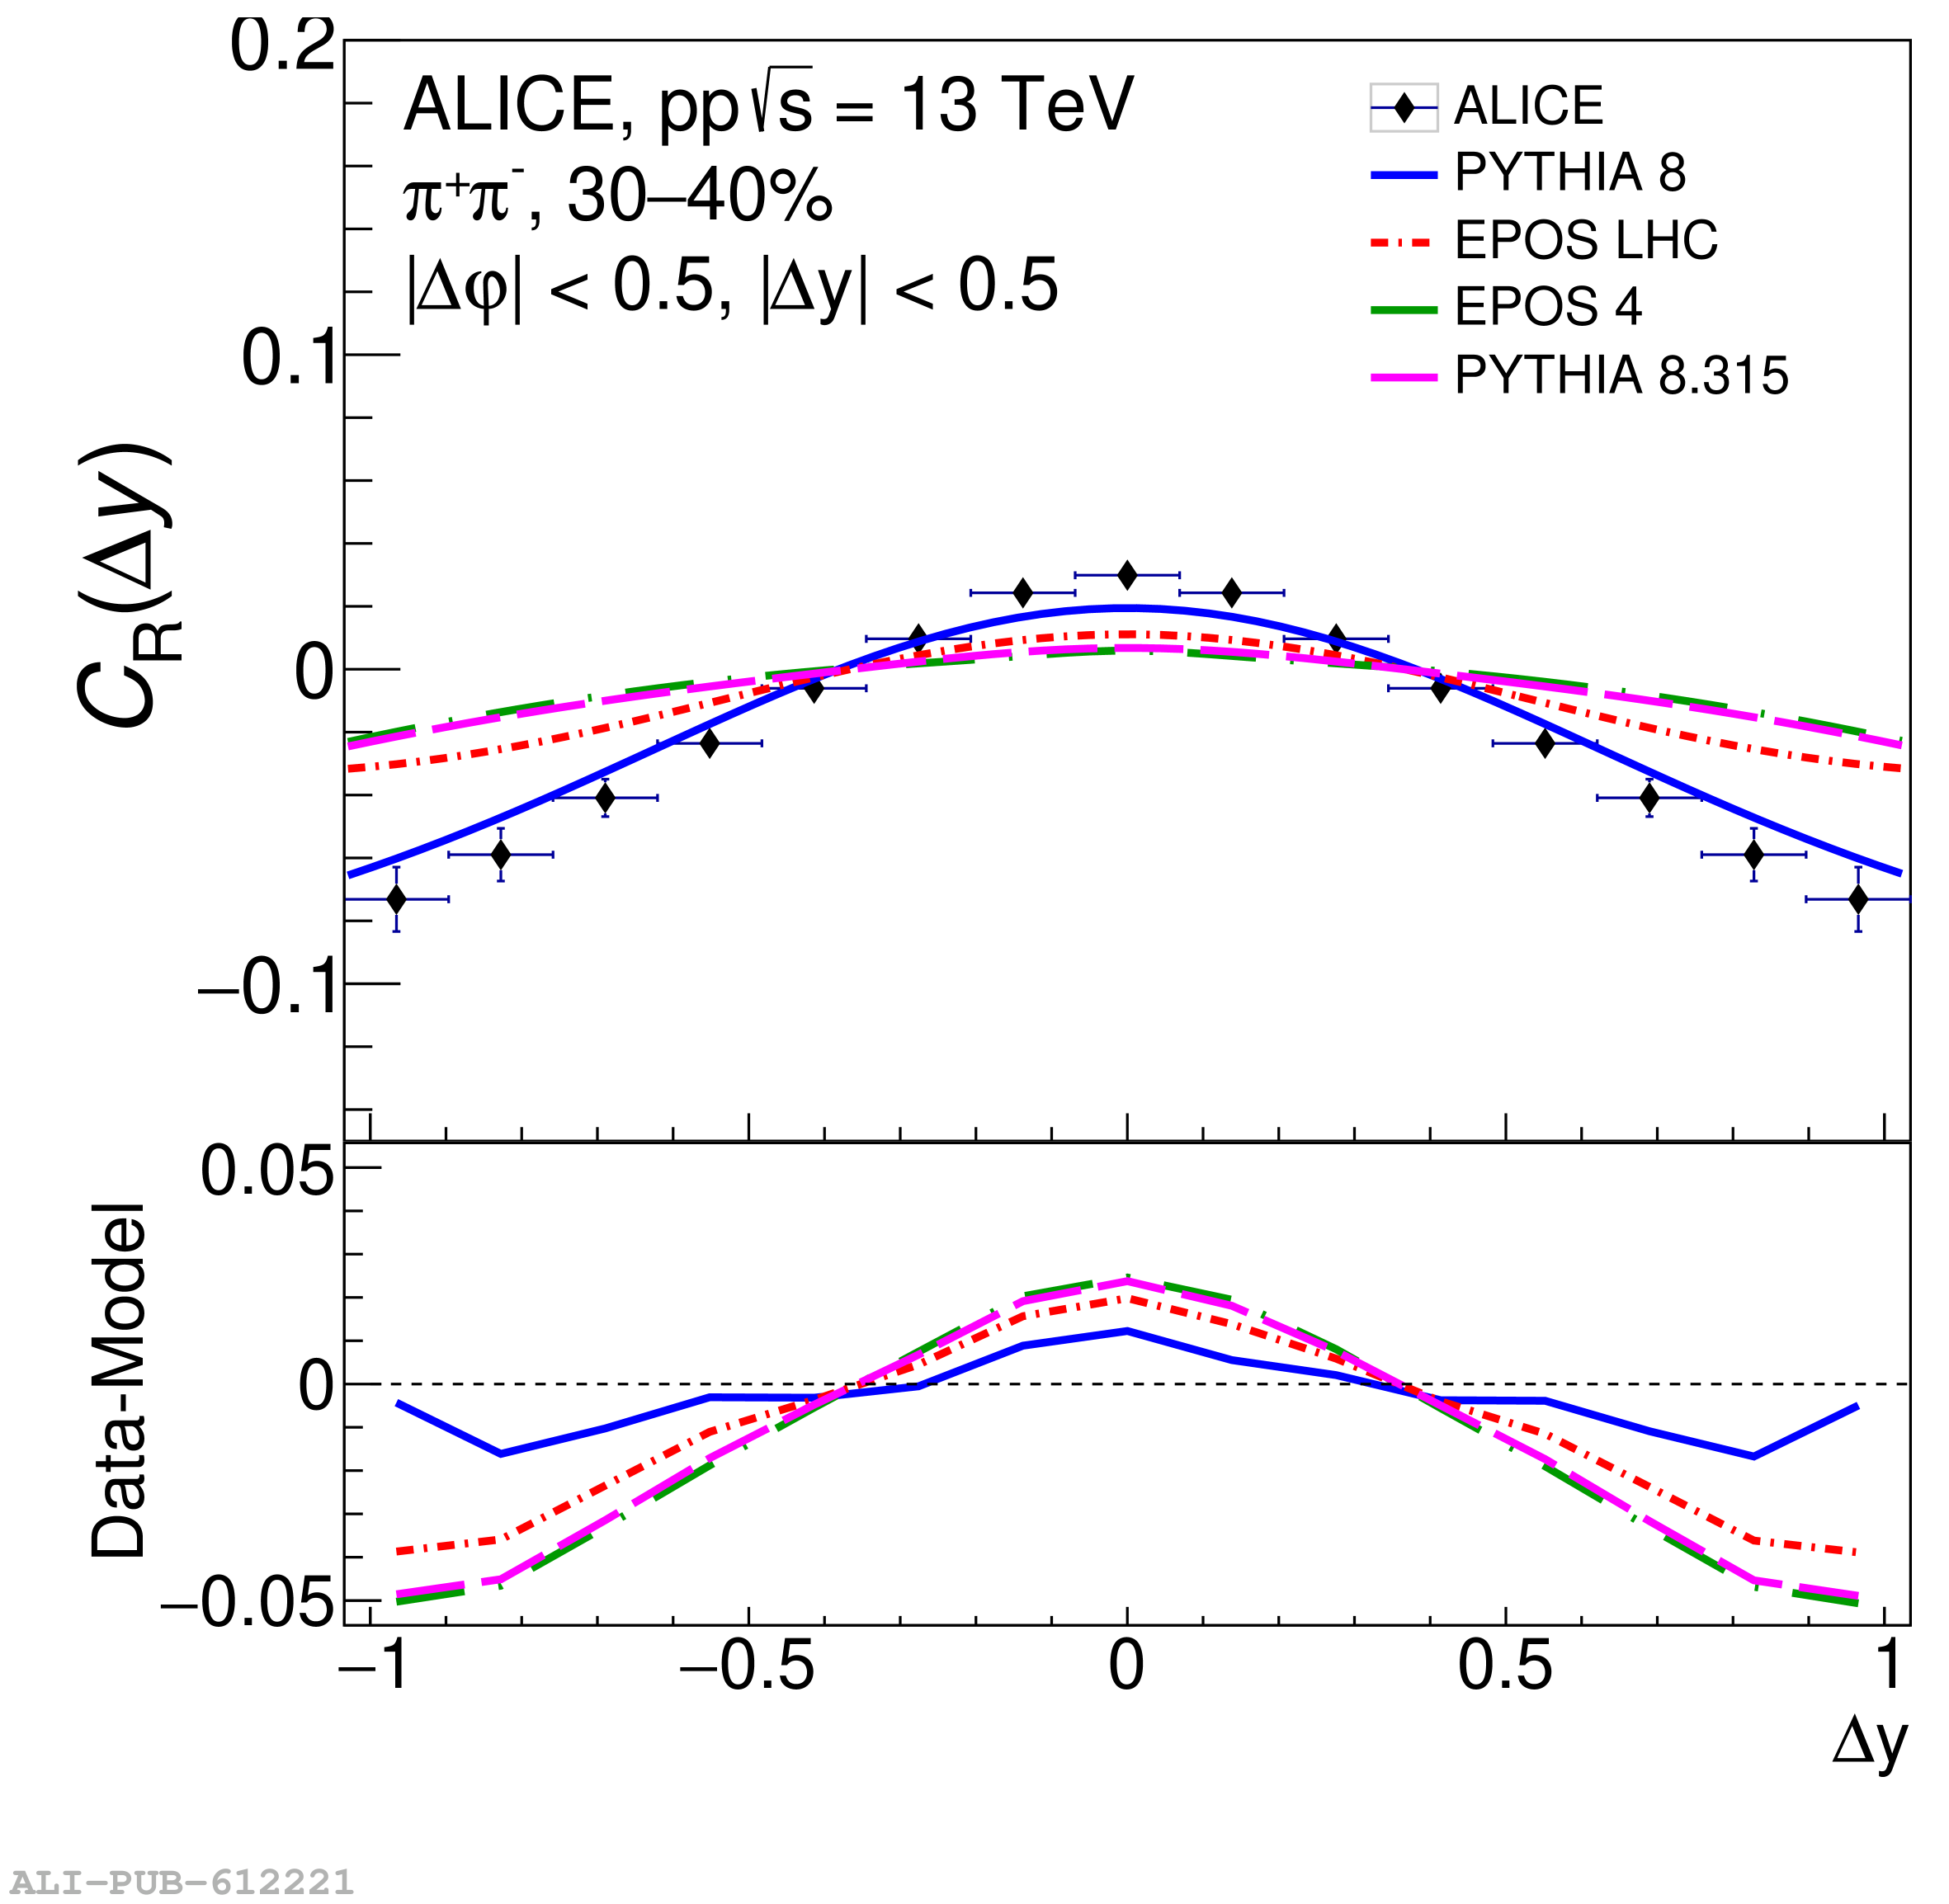 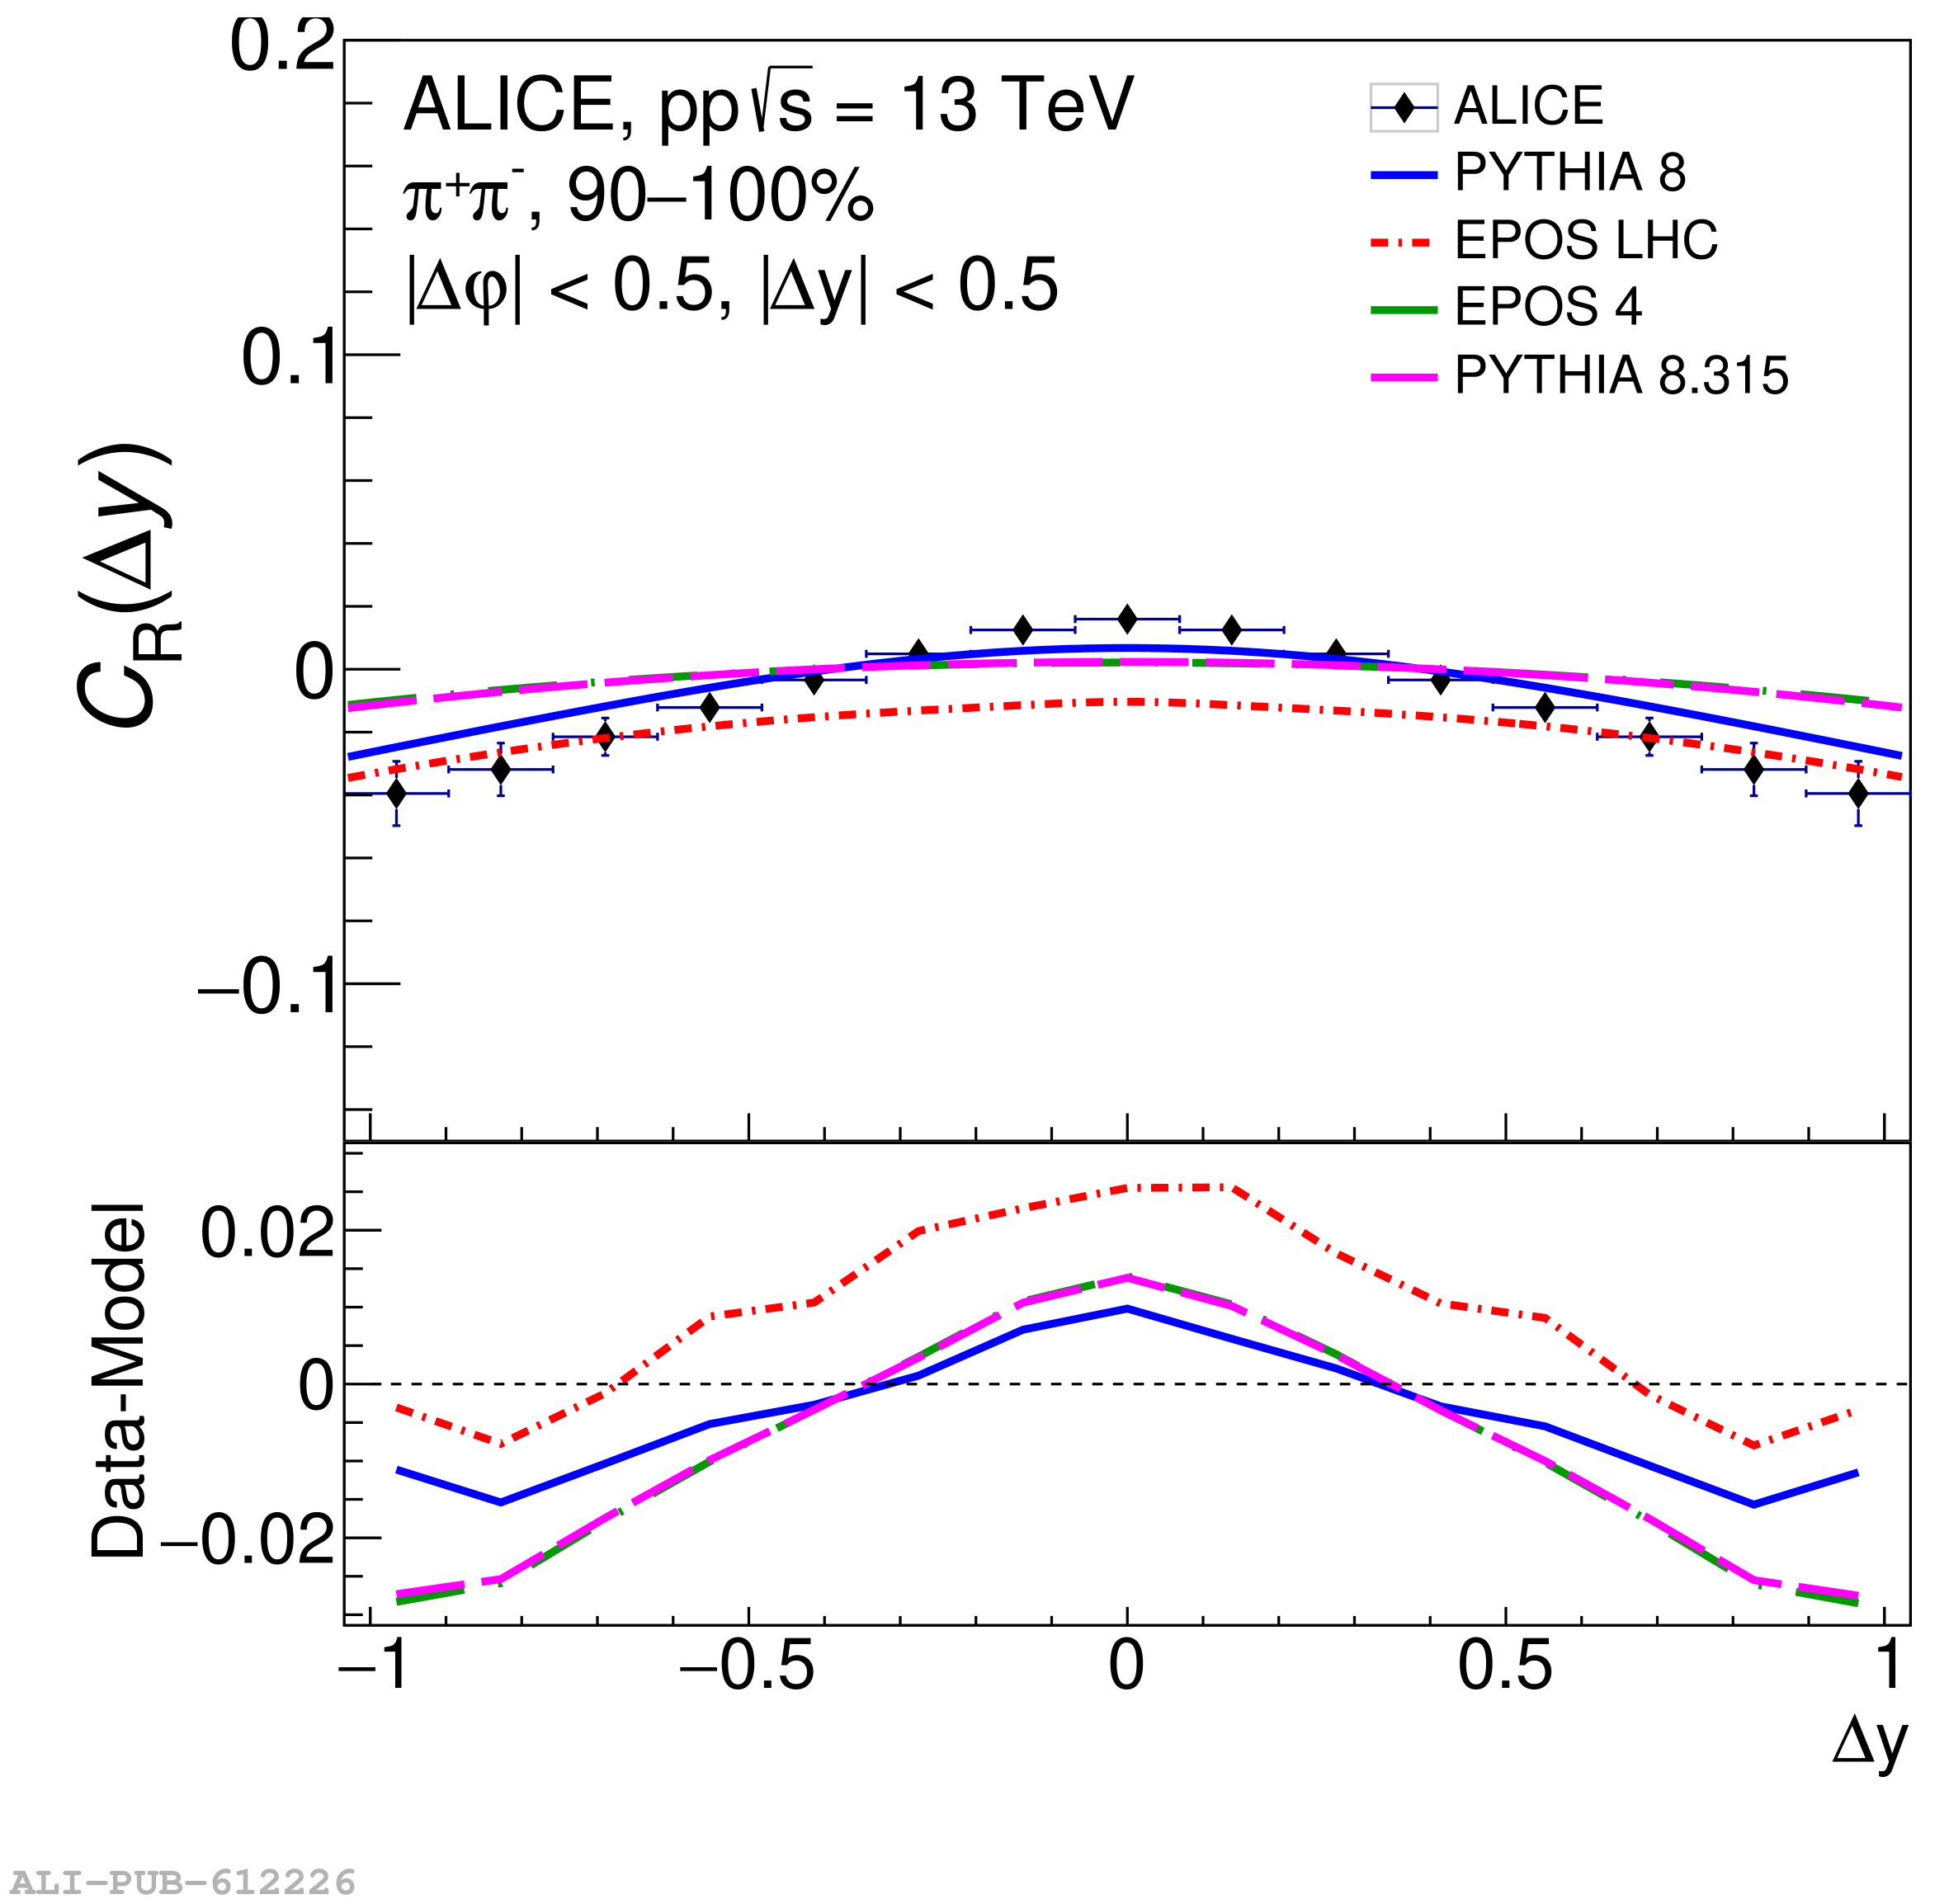 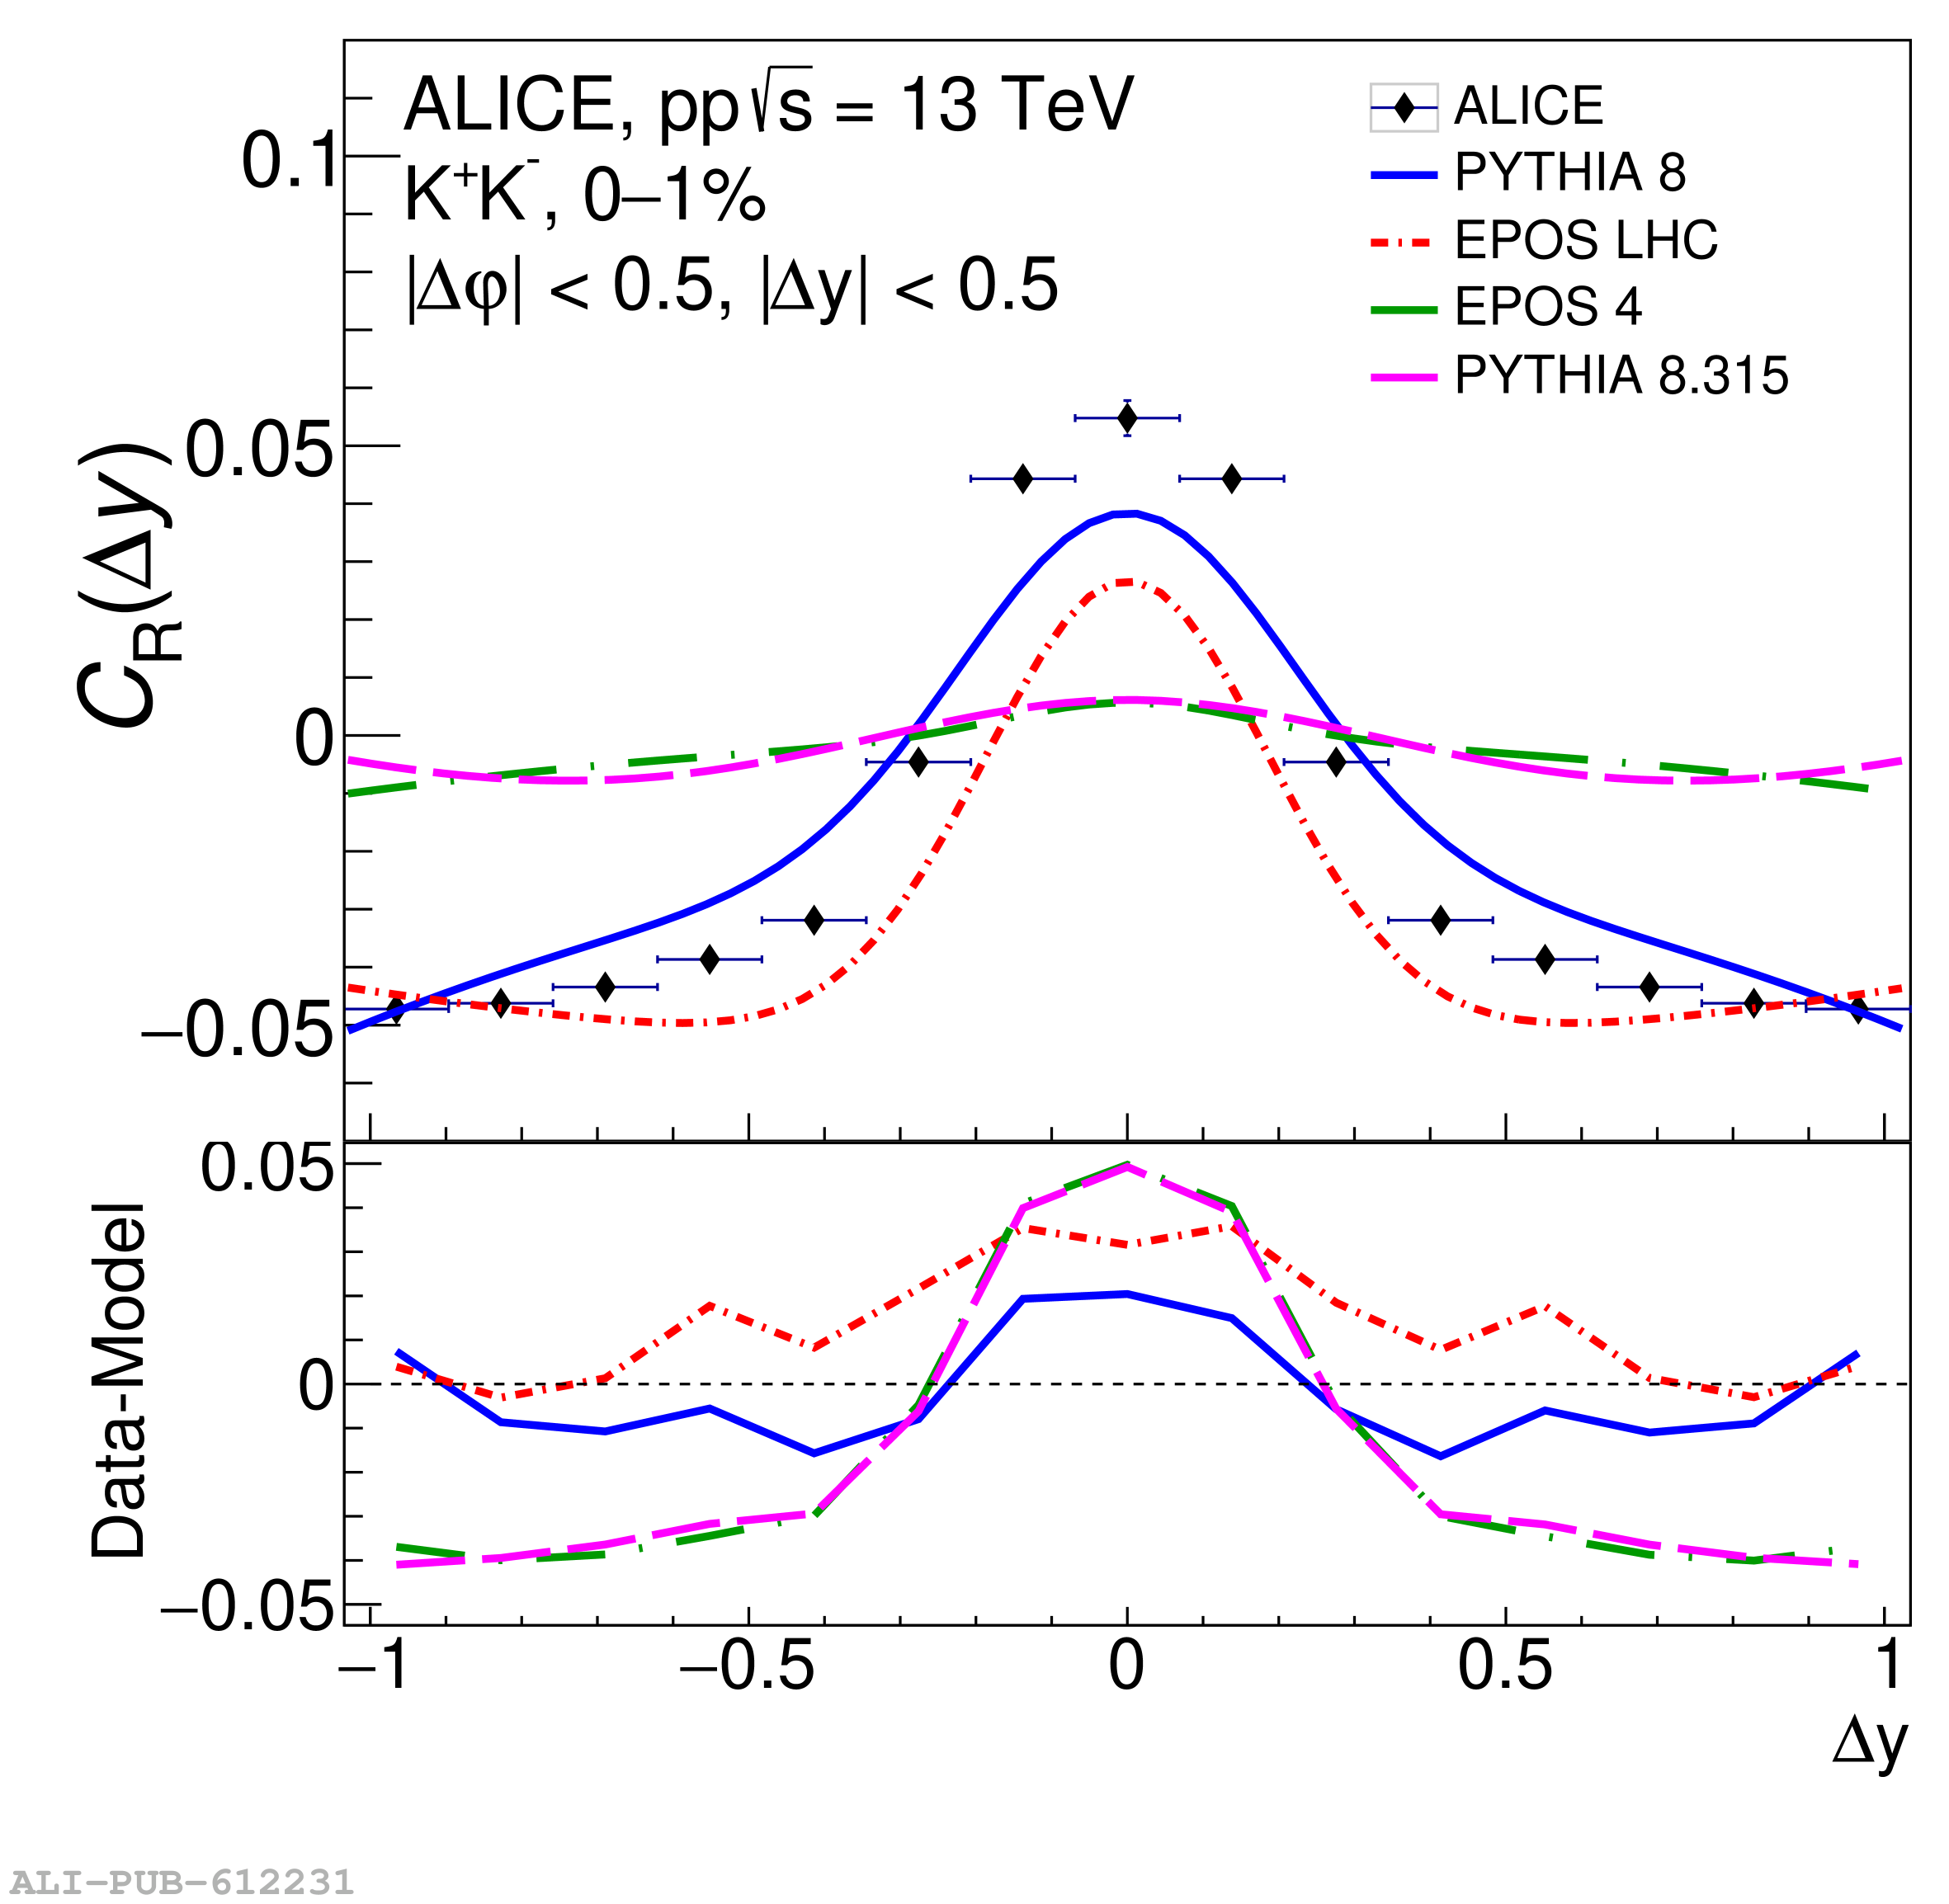 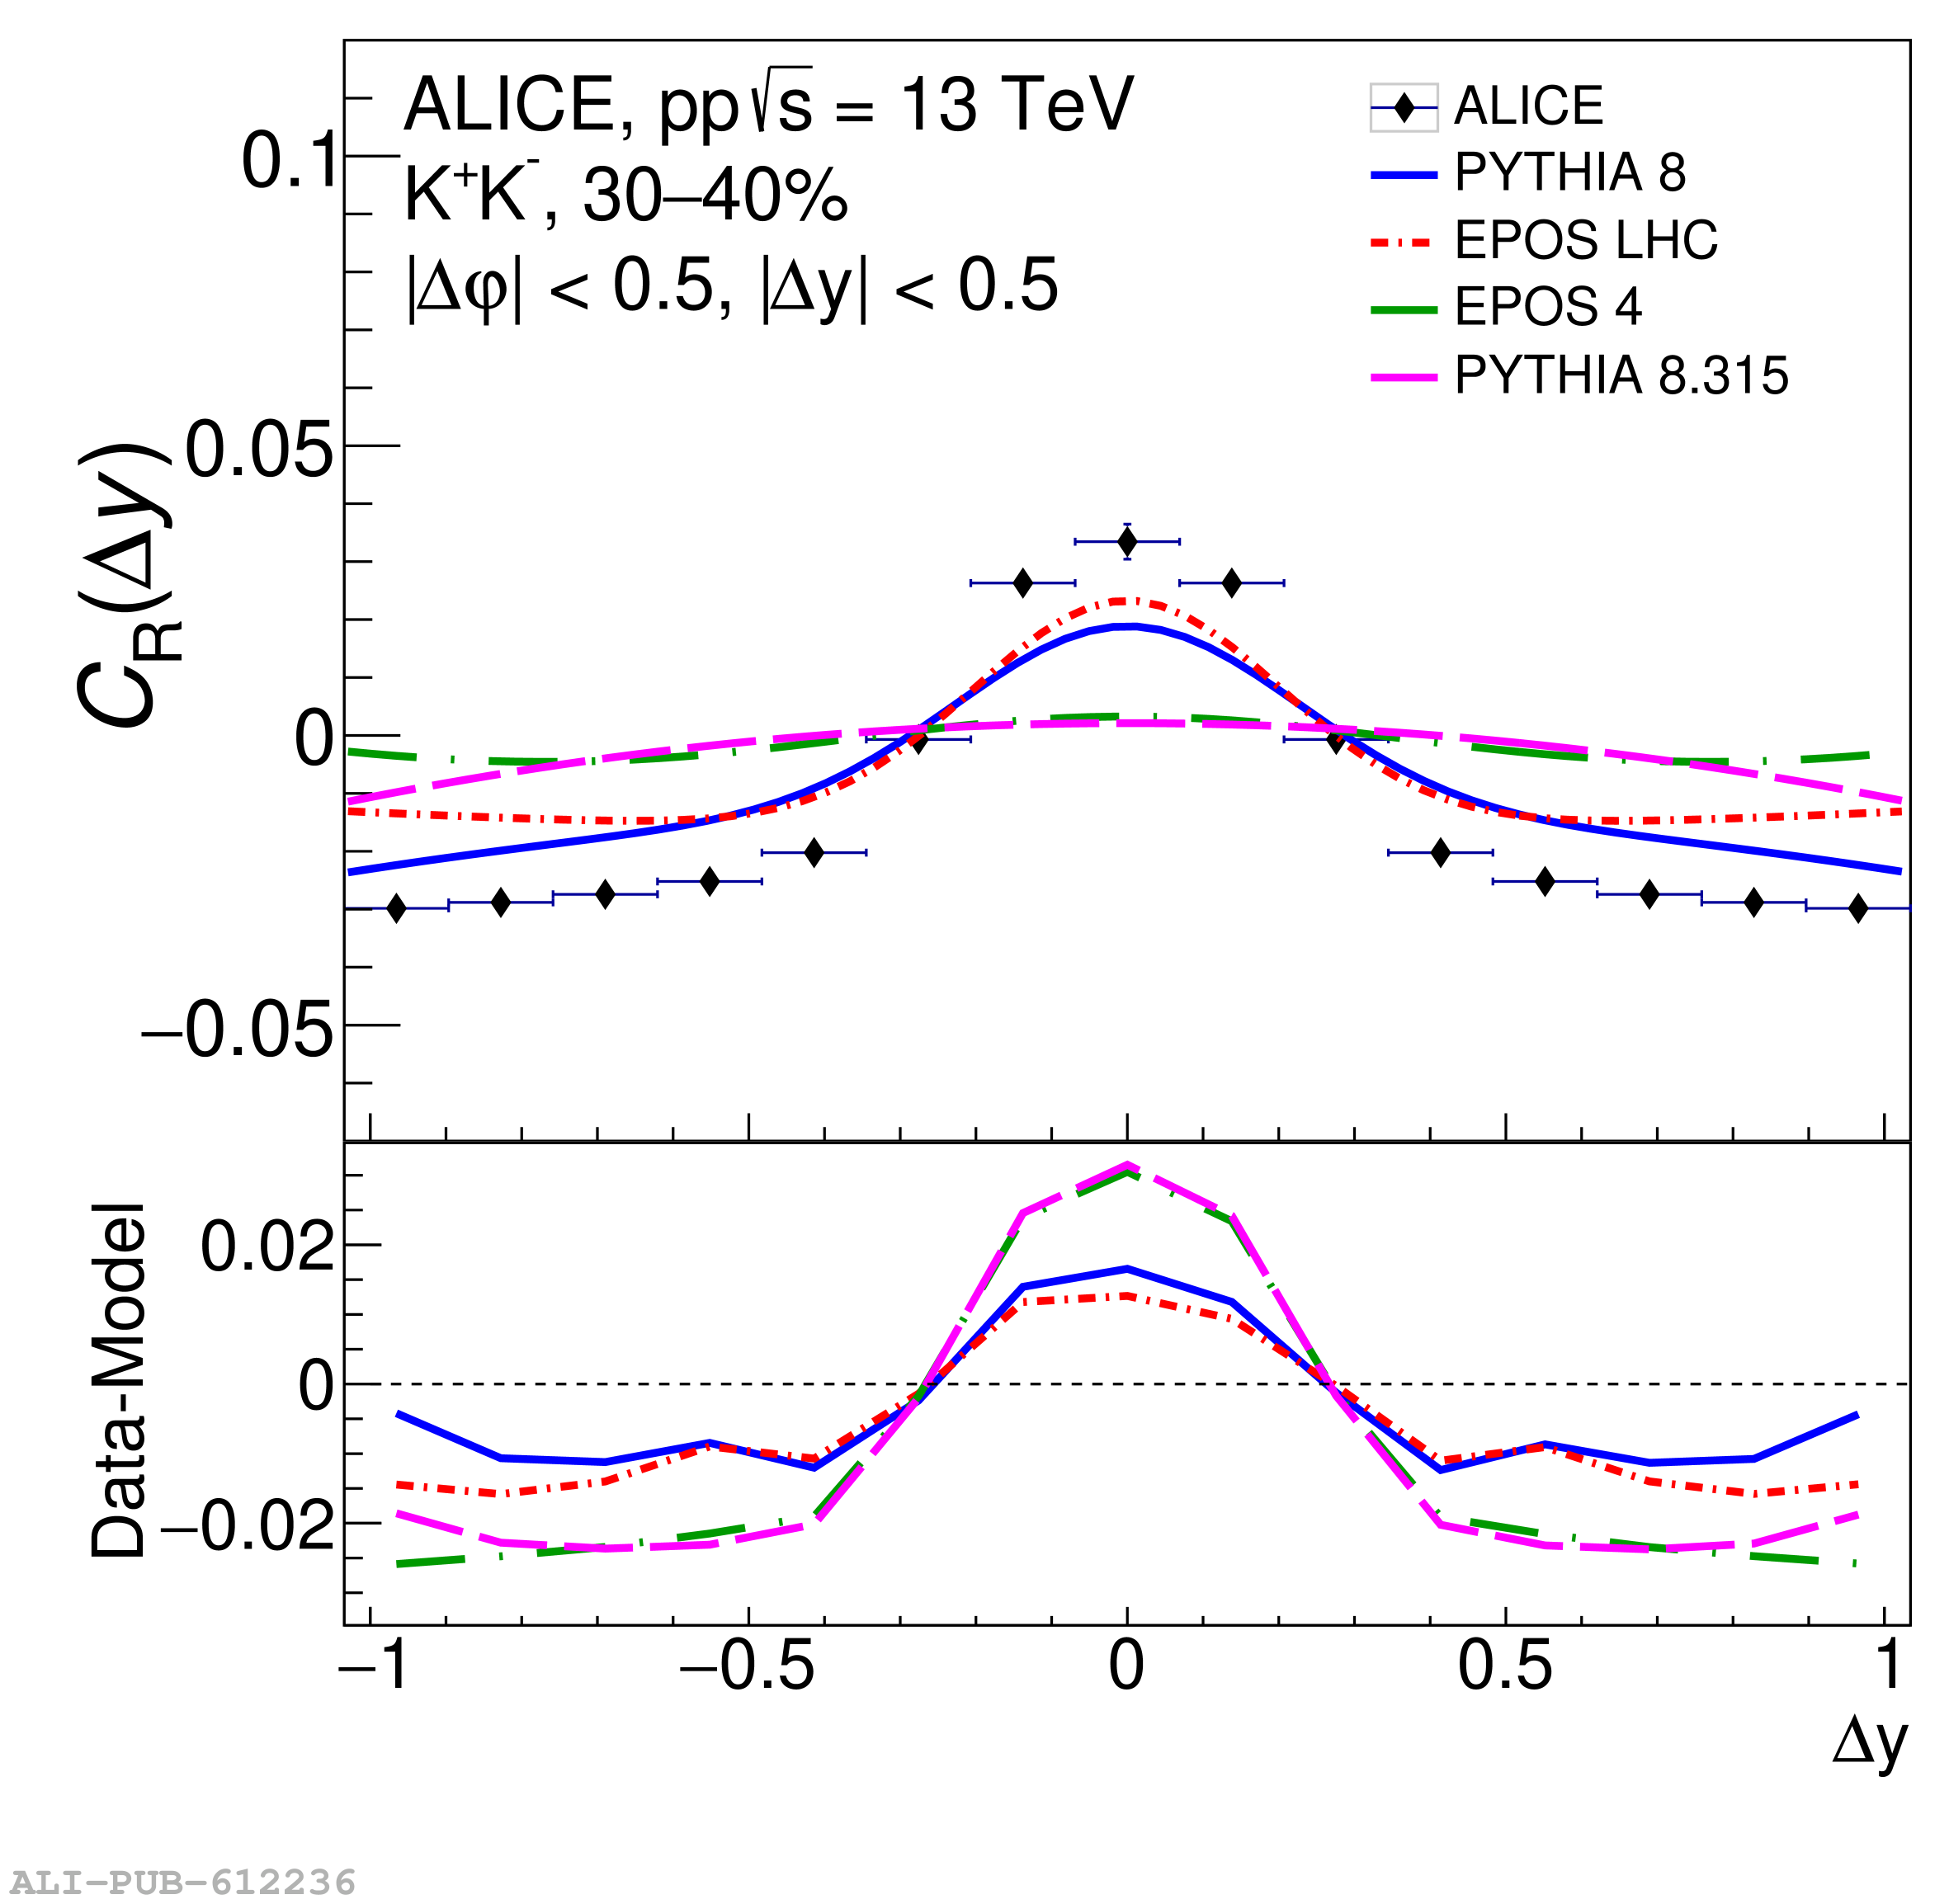 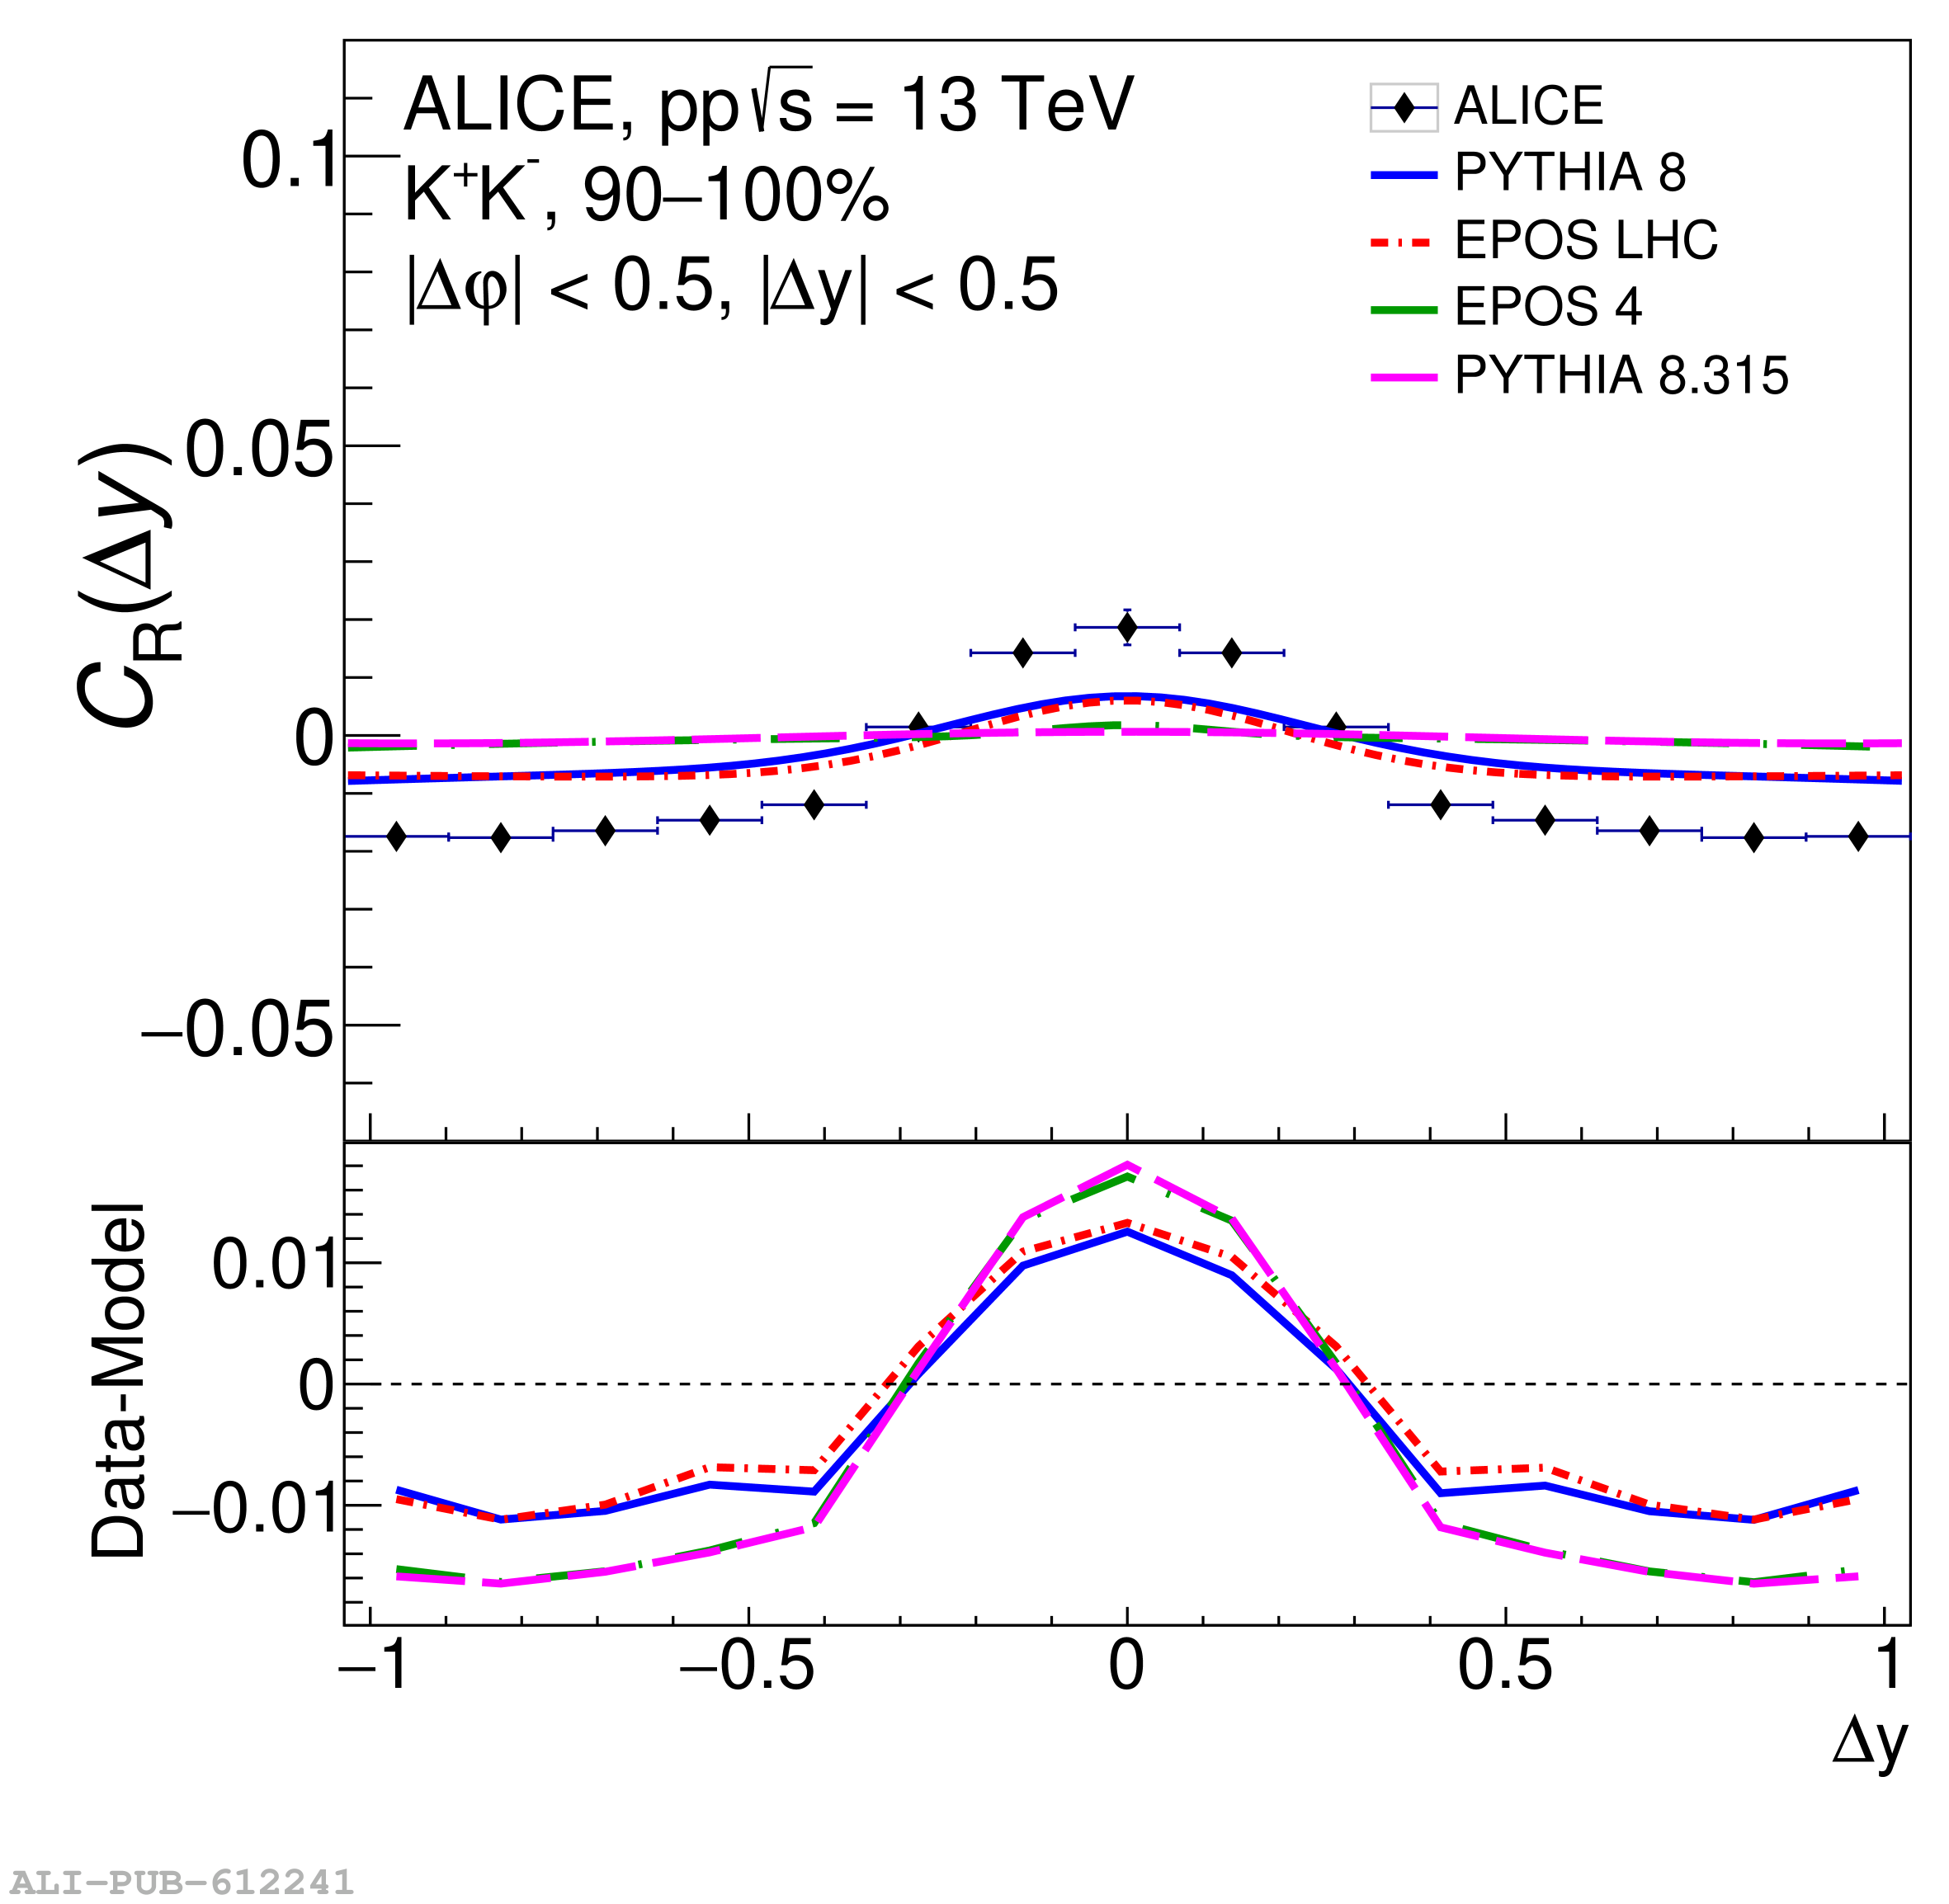 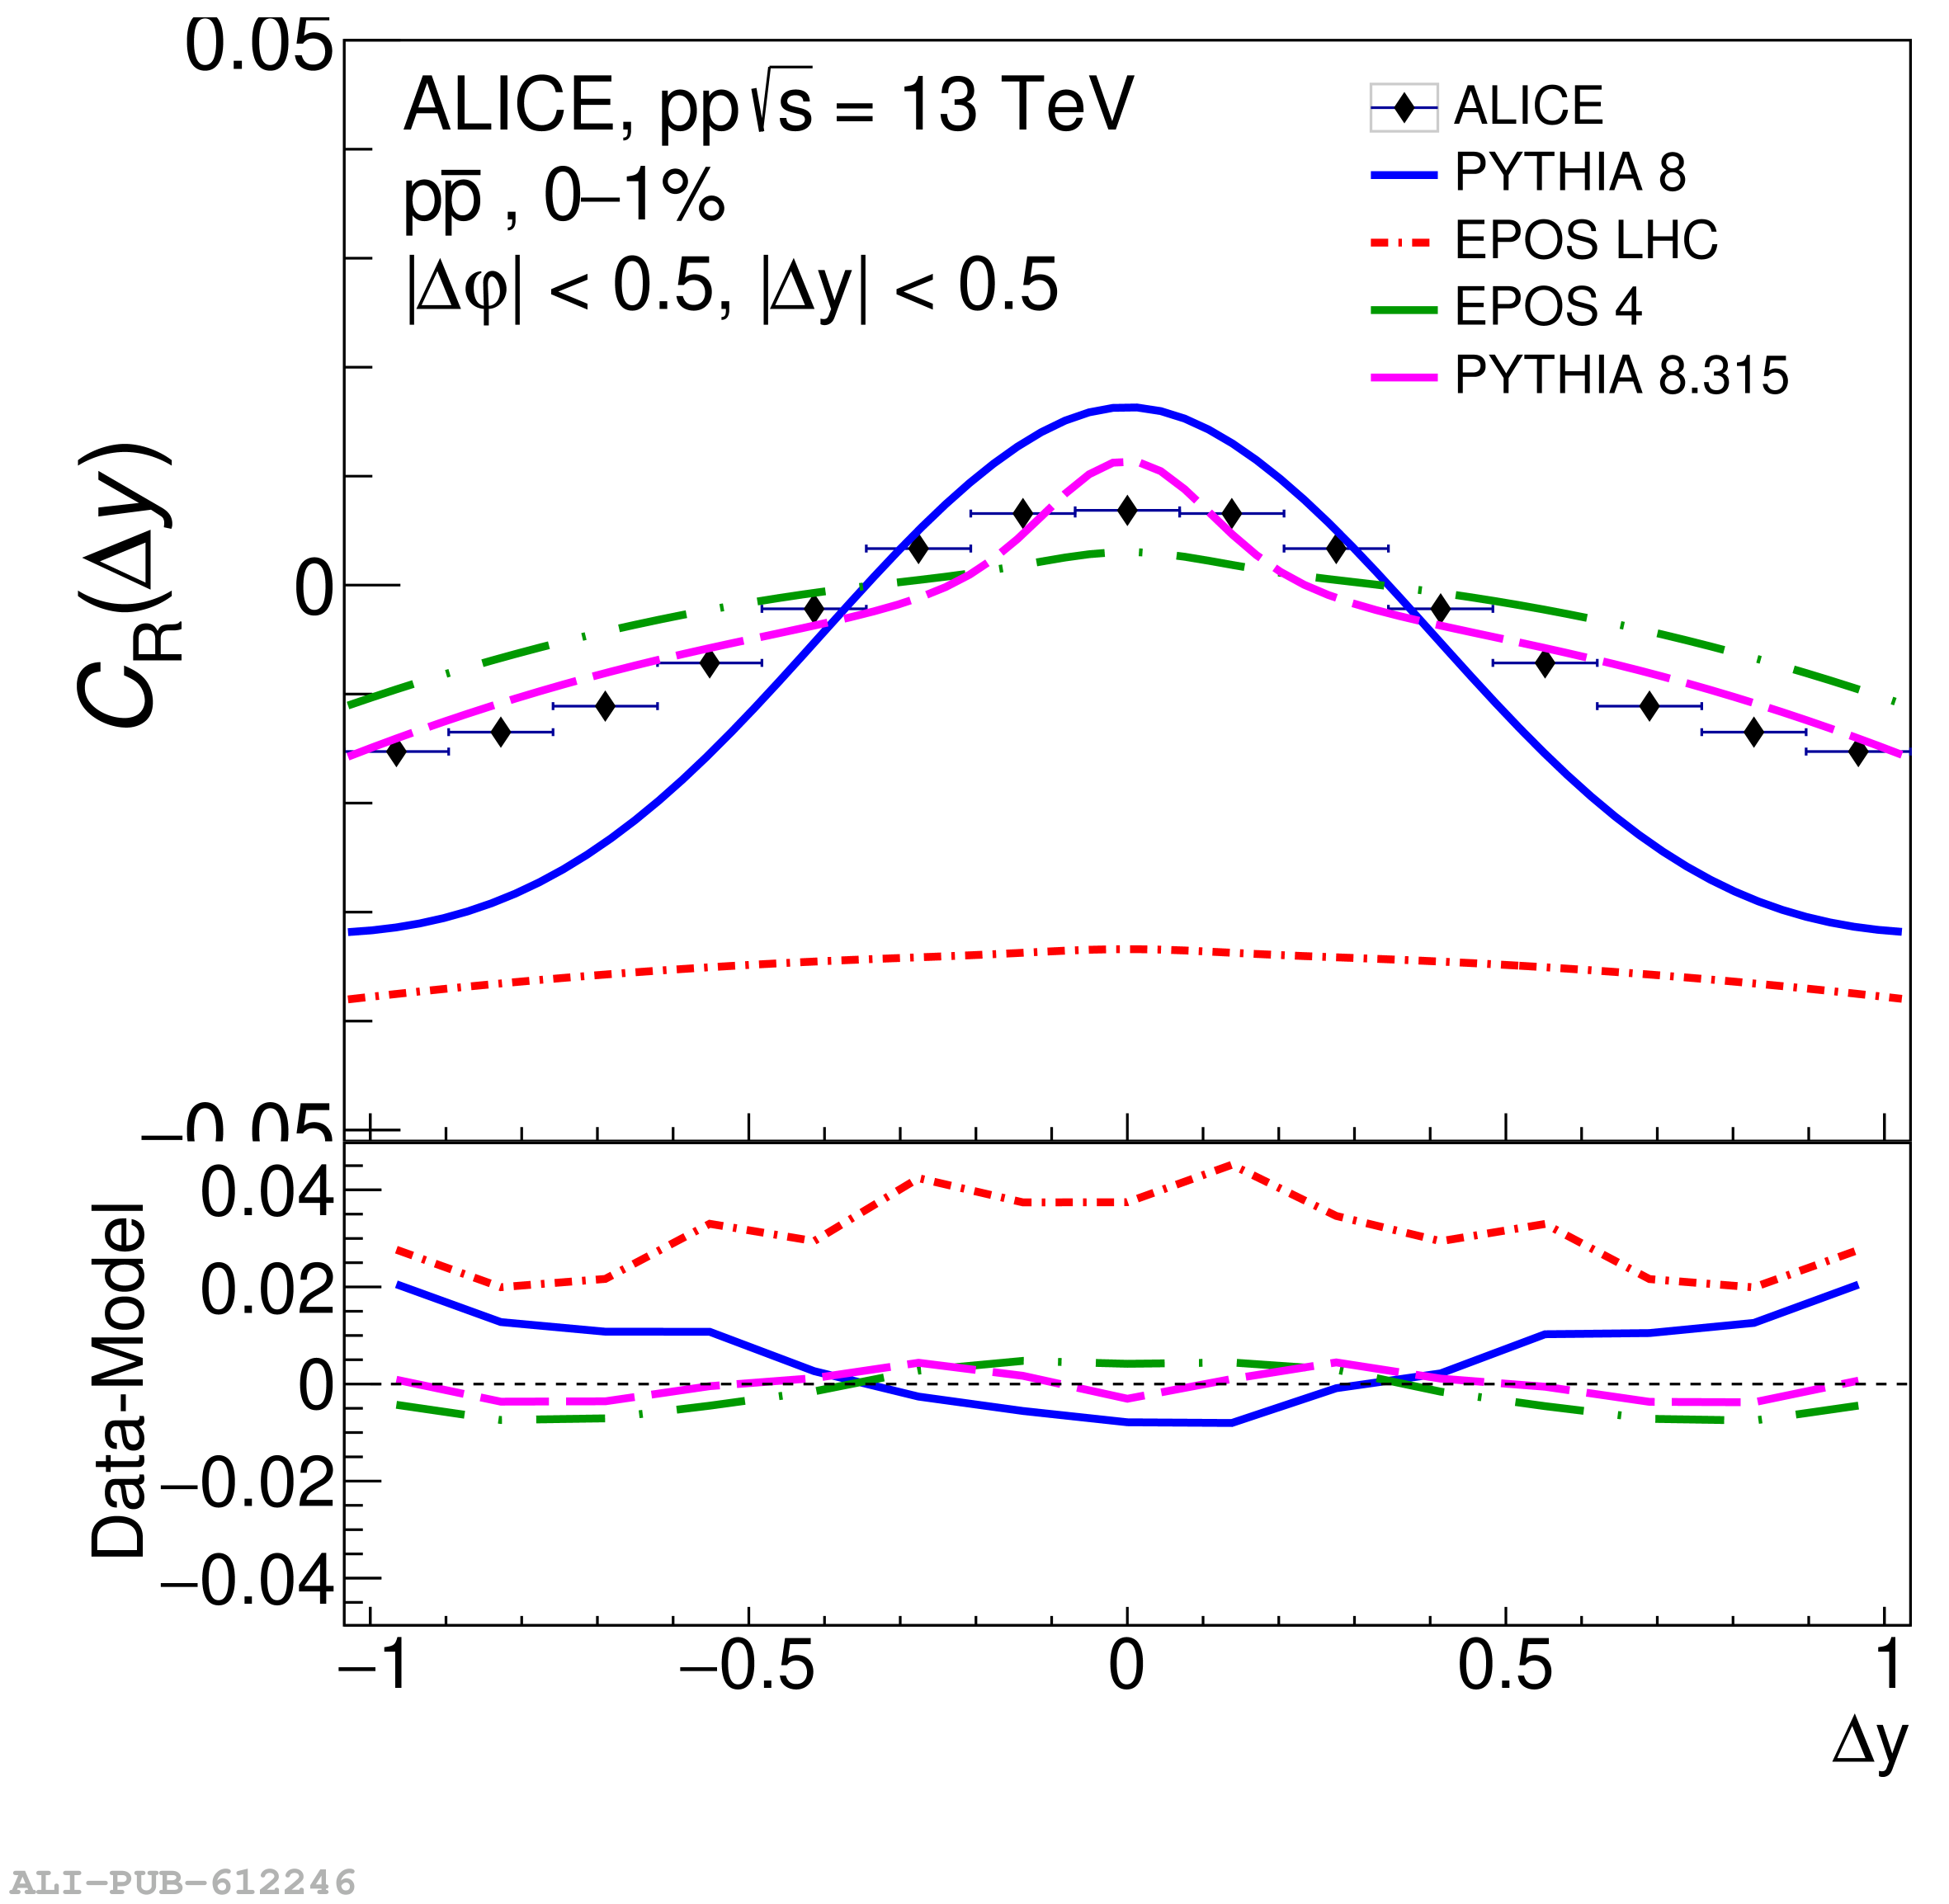 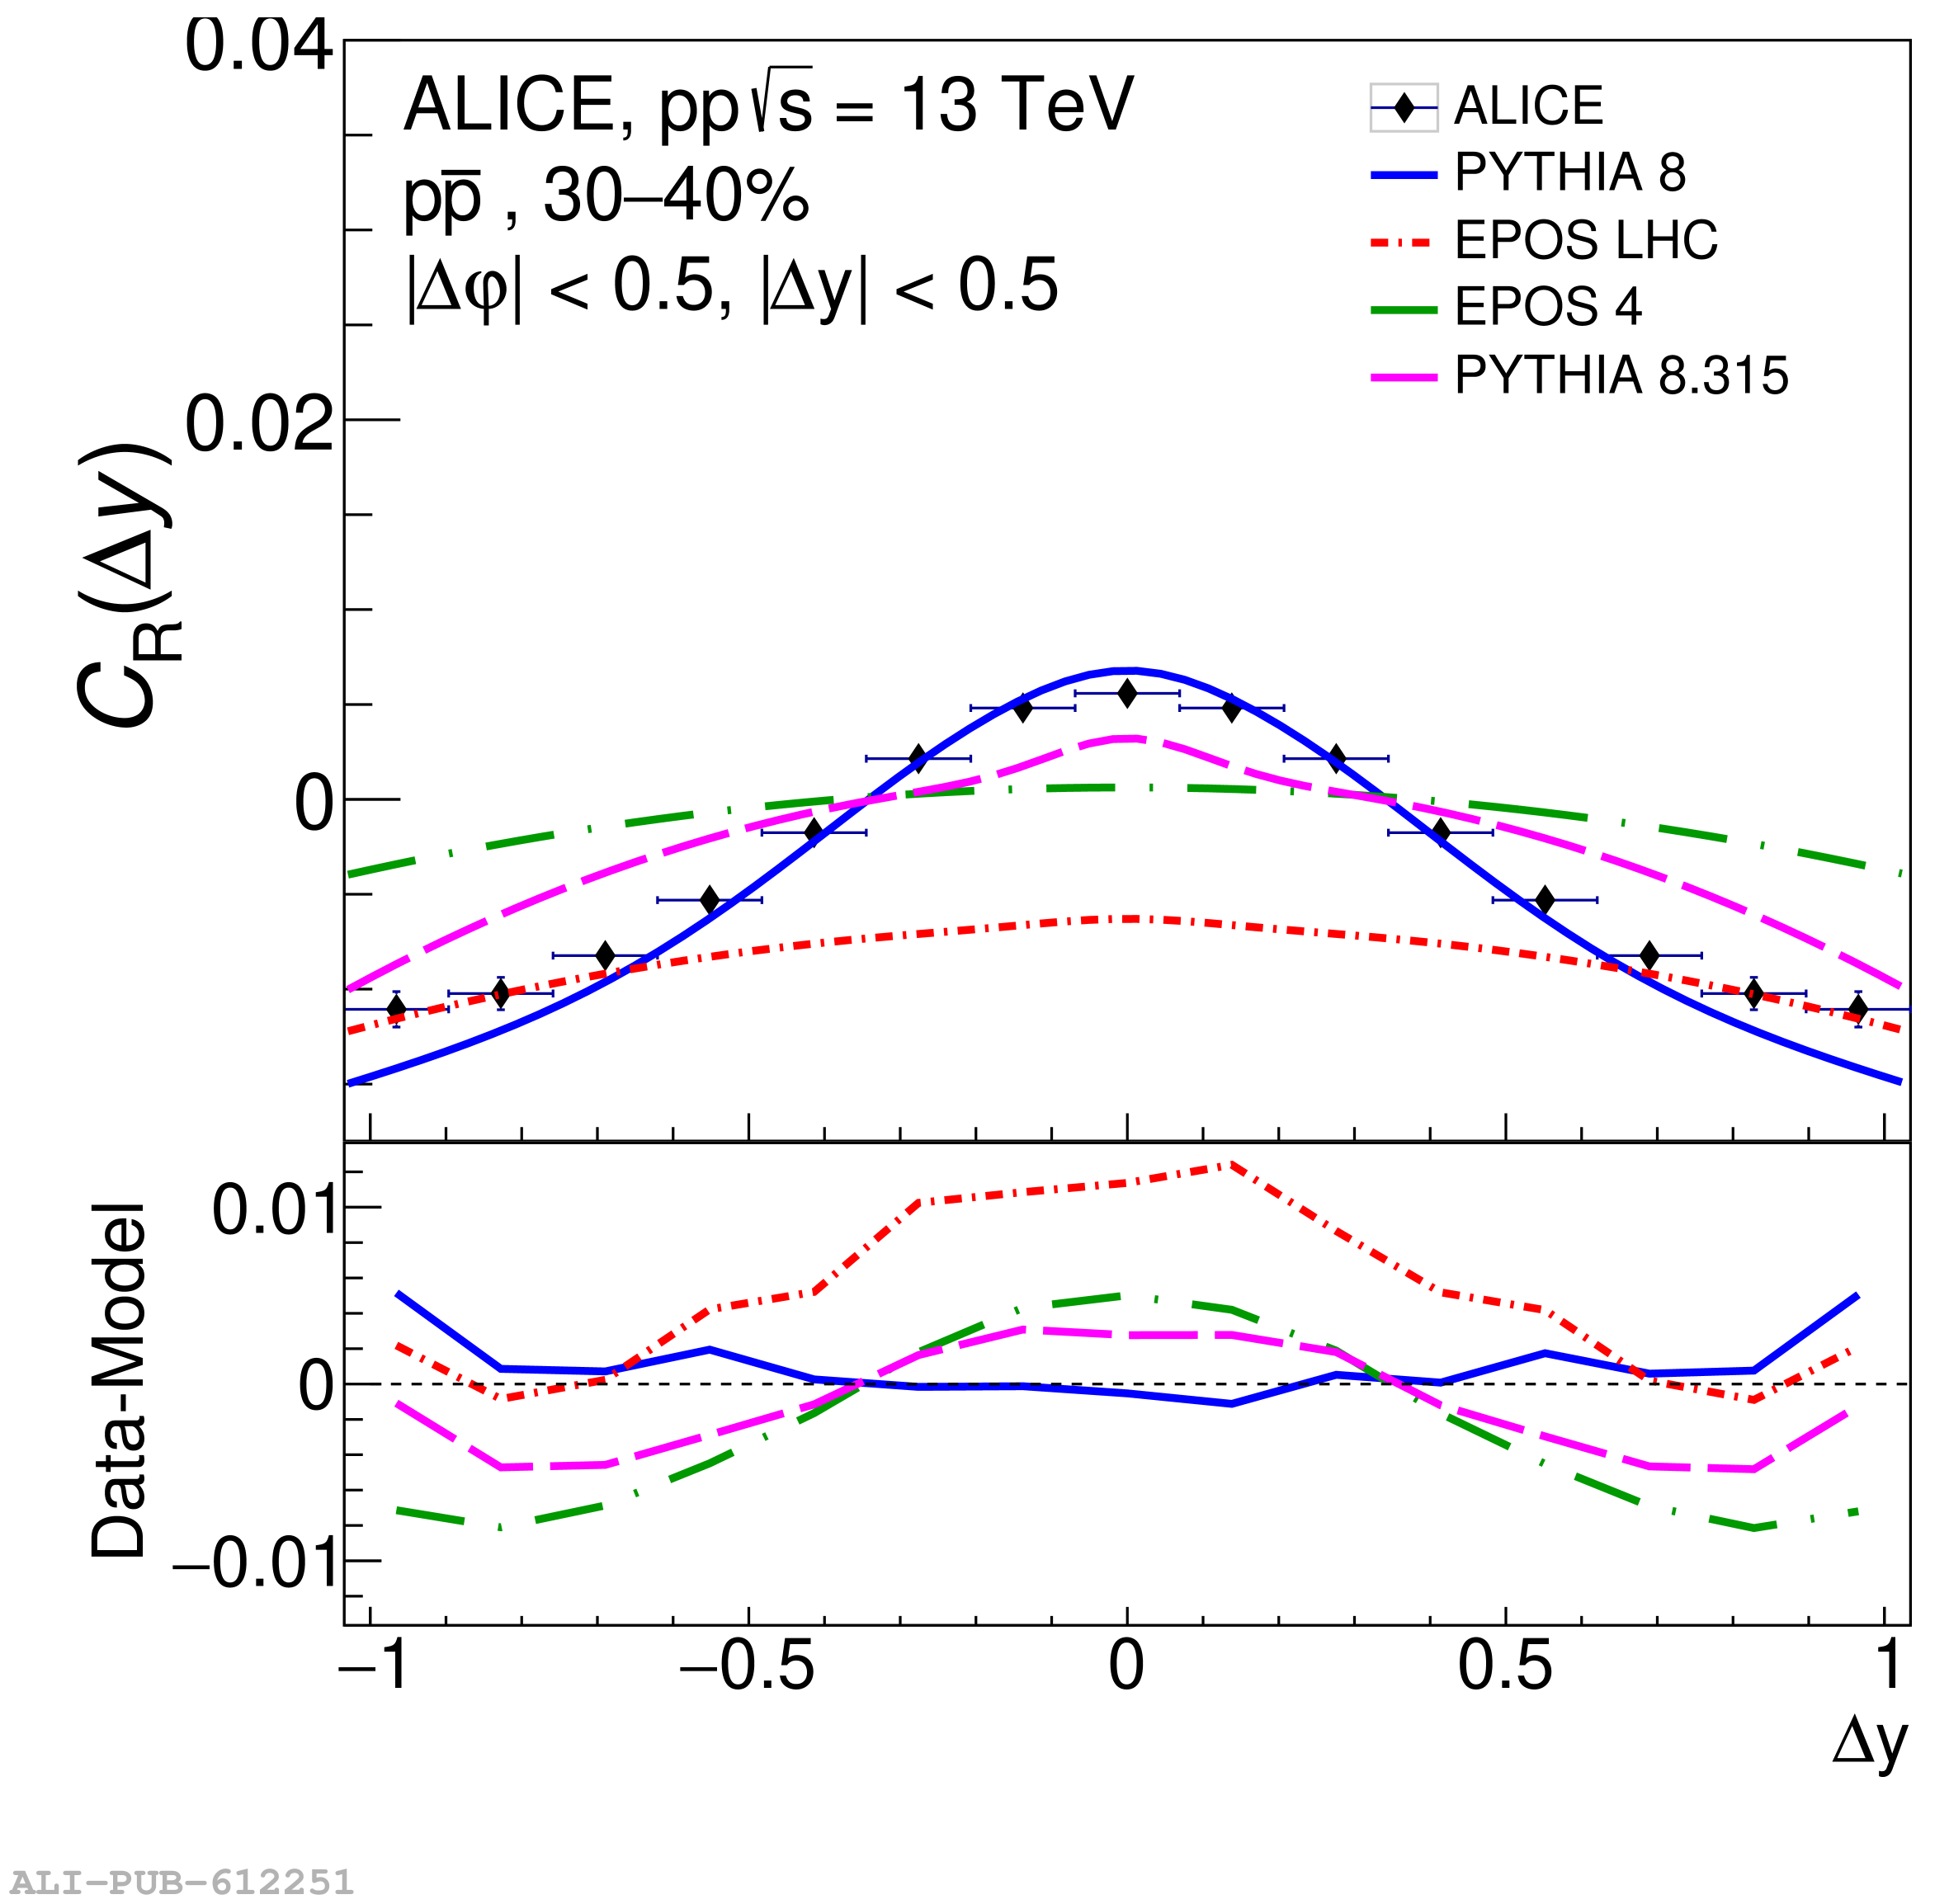 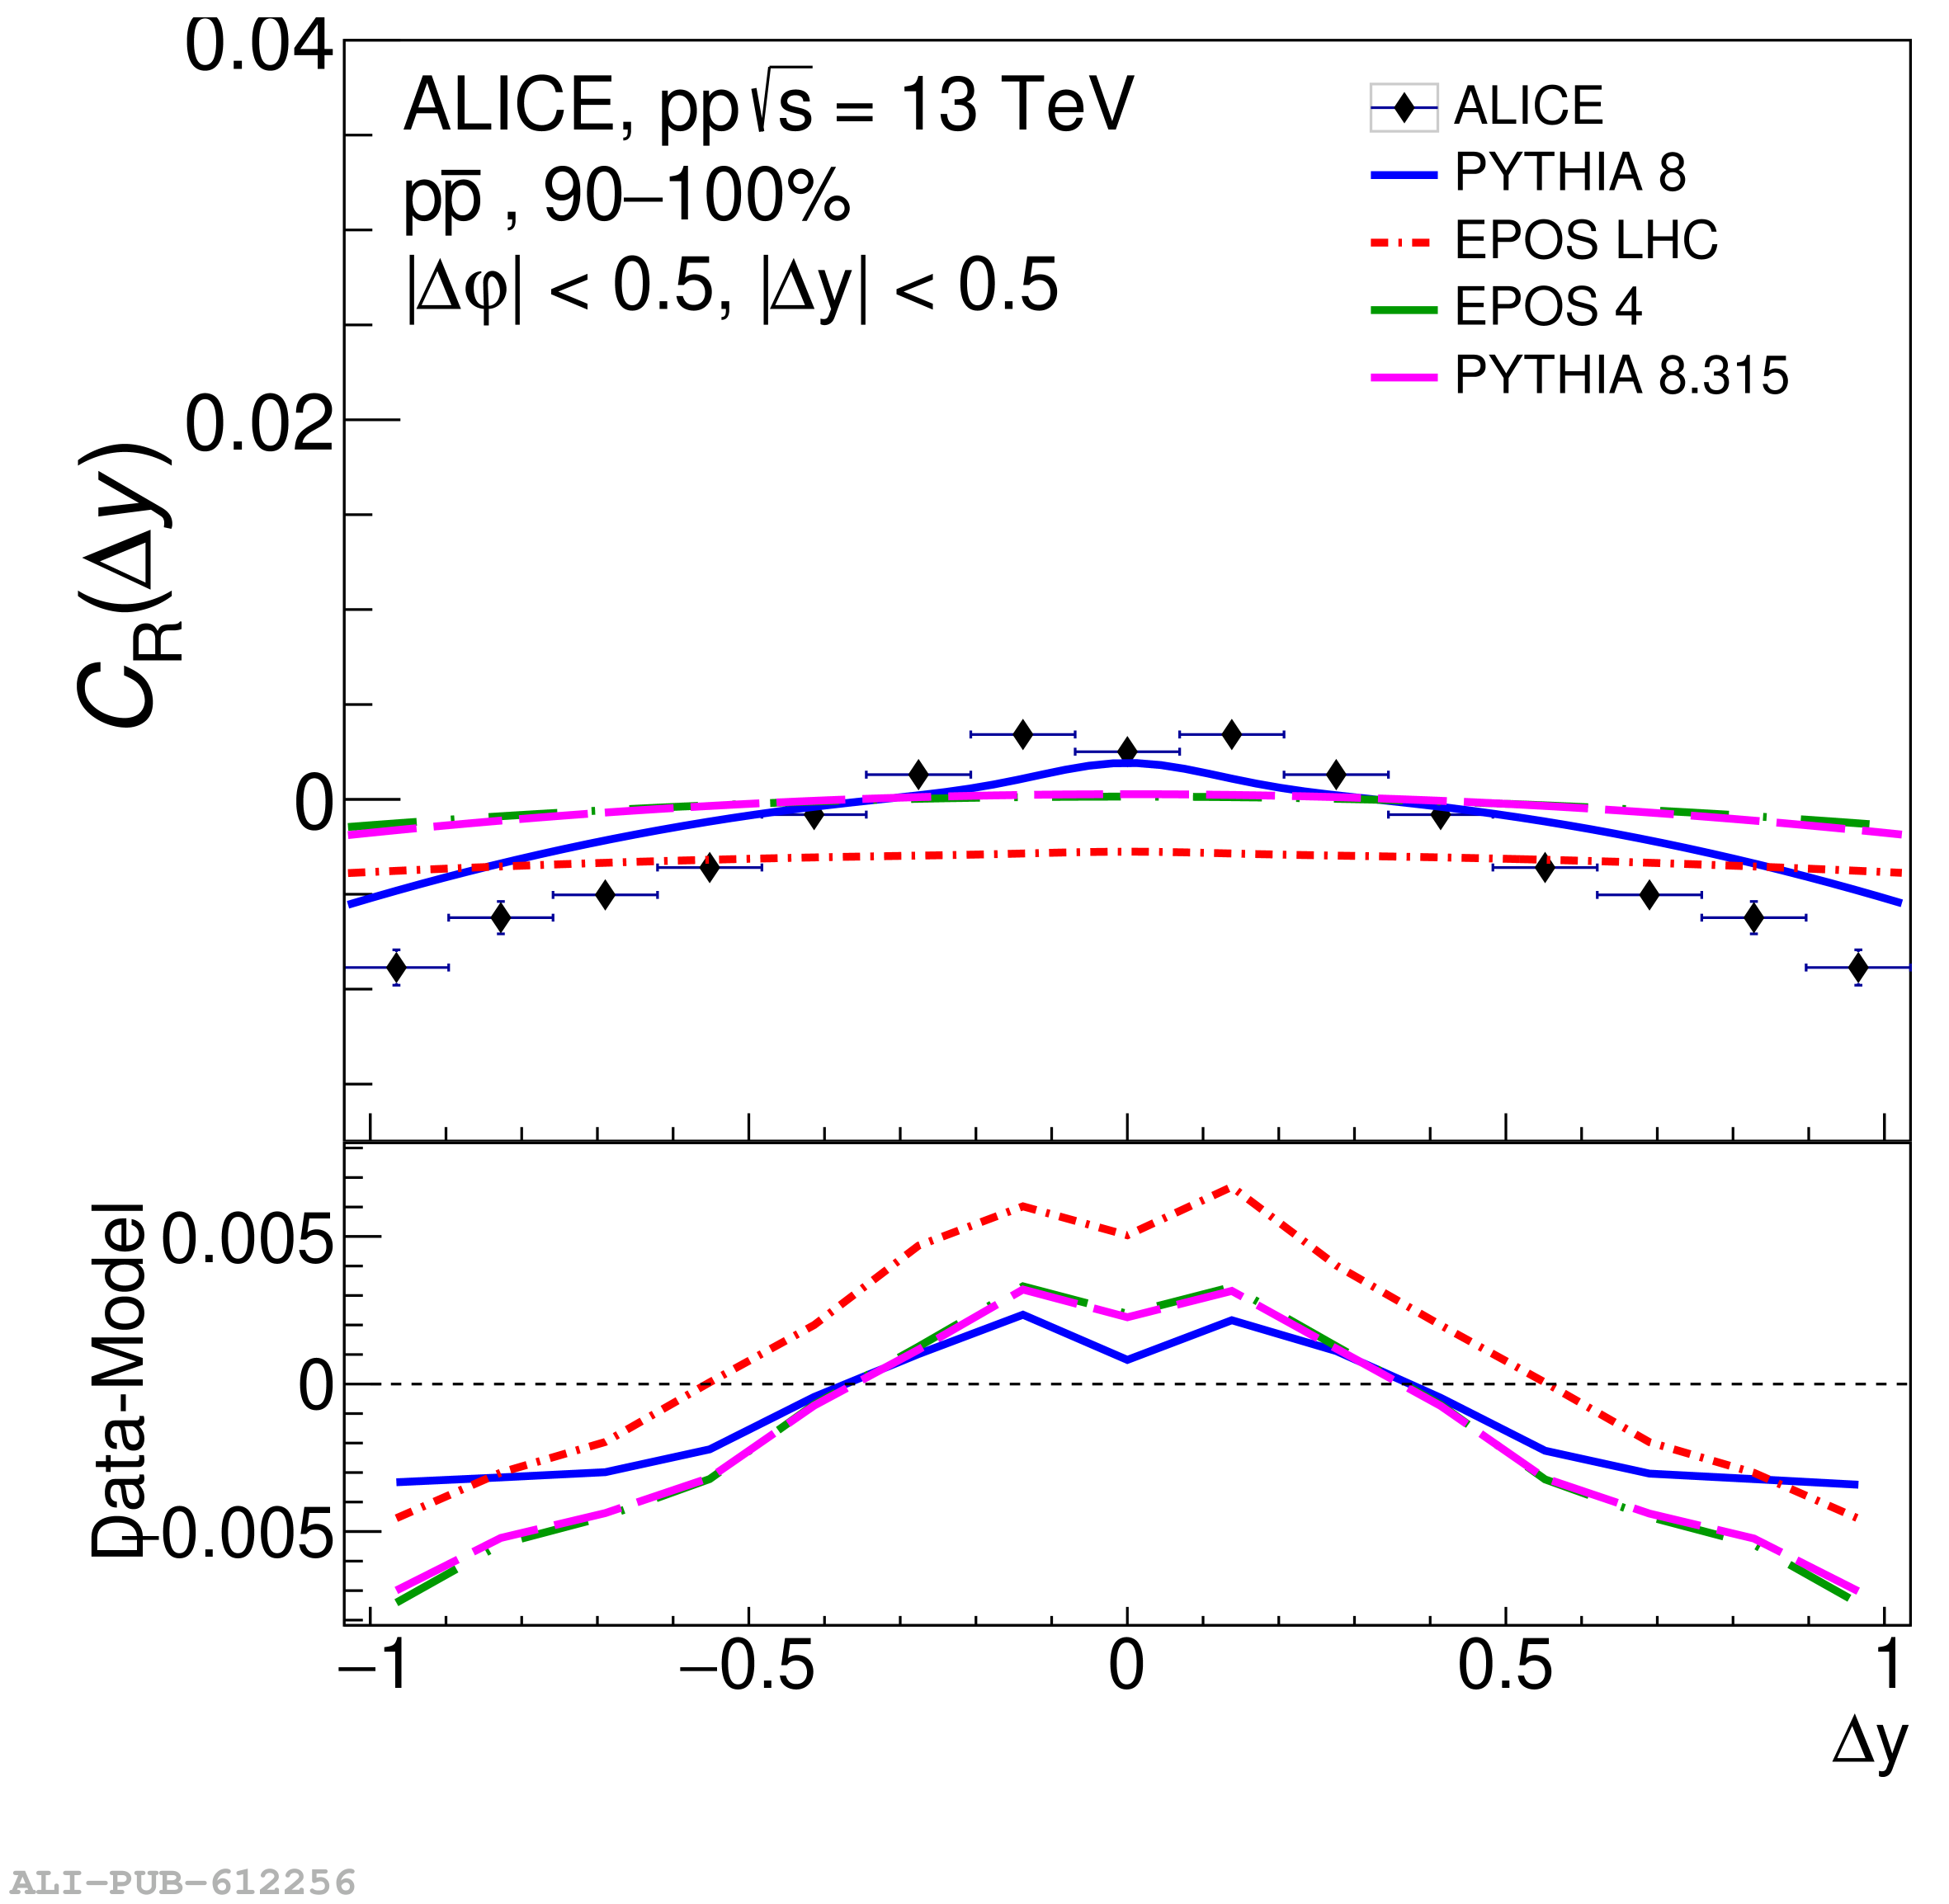 |