Ratios $v_2$(Ne--Ne/OO) and $v_3$(Ne--Ne/OO) as a function of centrality in the 0–30\% centrality range. The vertical lines represent statistical uncertainties and the open boxes represent the systematic uncertainties, while most of them are smaller than the symbol size. The measurements are compared with Trajectum calculations with NLEFT and PGCM inputs as well as IP-Glasma+JIMWLK+MUSIC+UrQMD and 3DGlauber+MUSIC+UrQMD calculations with PGCM input. | 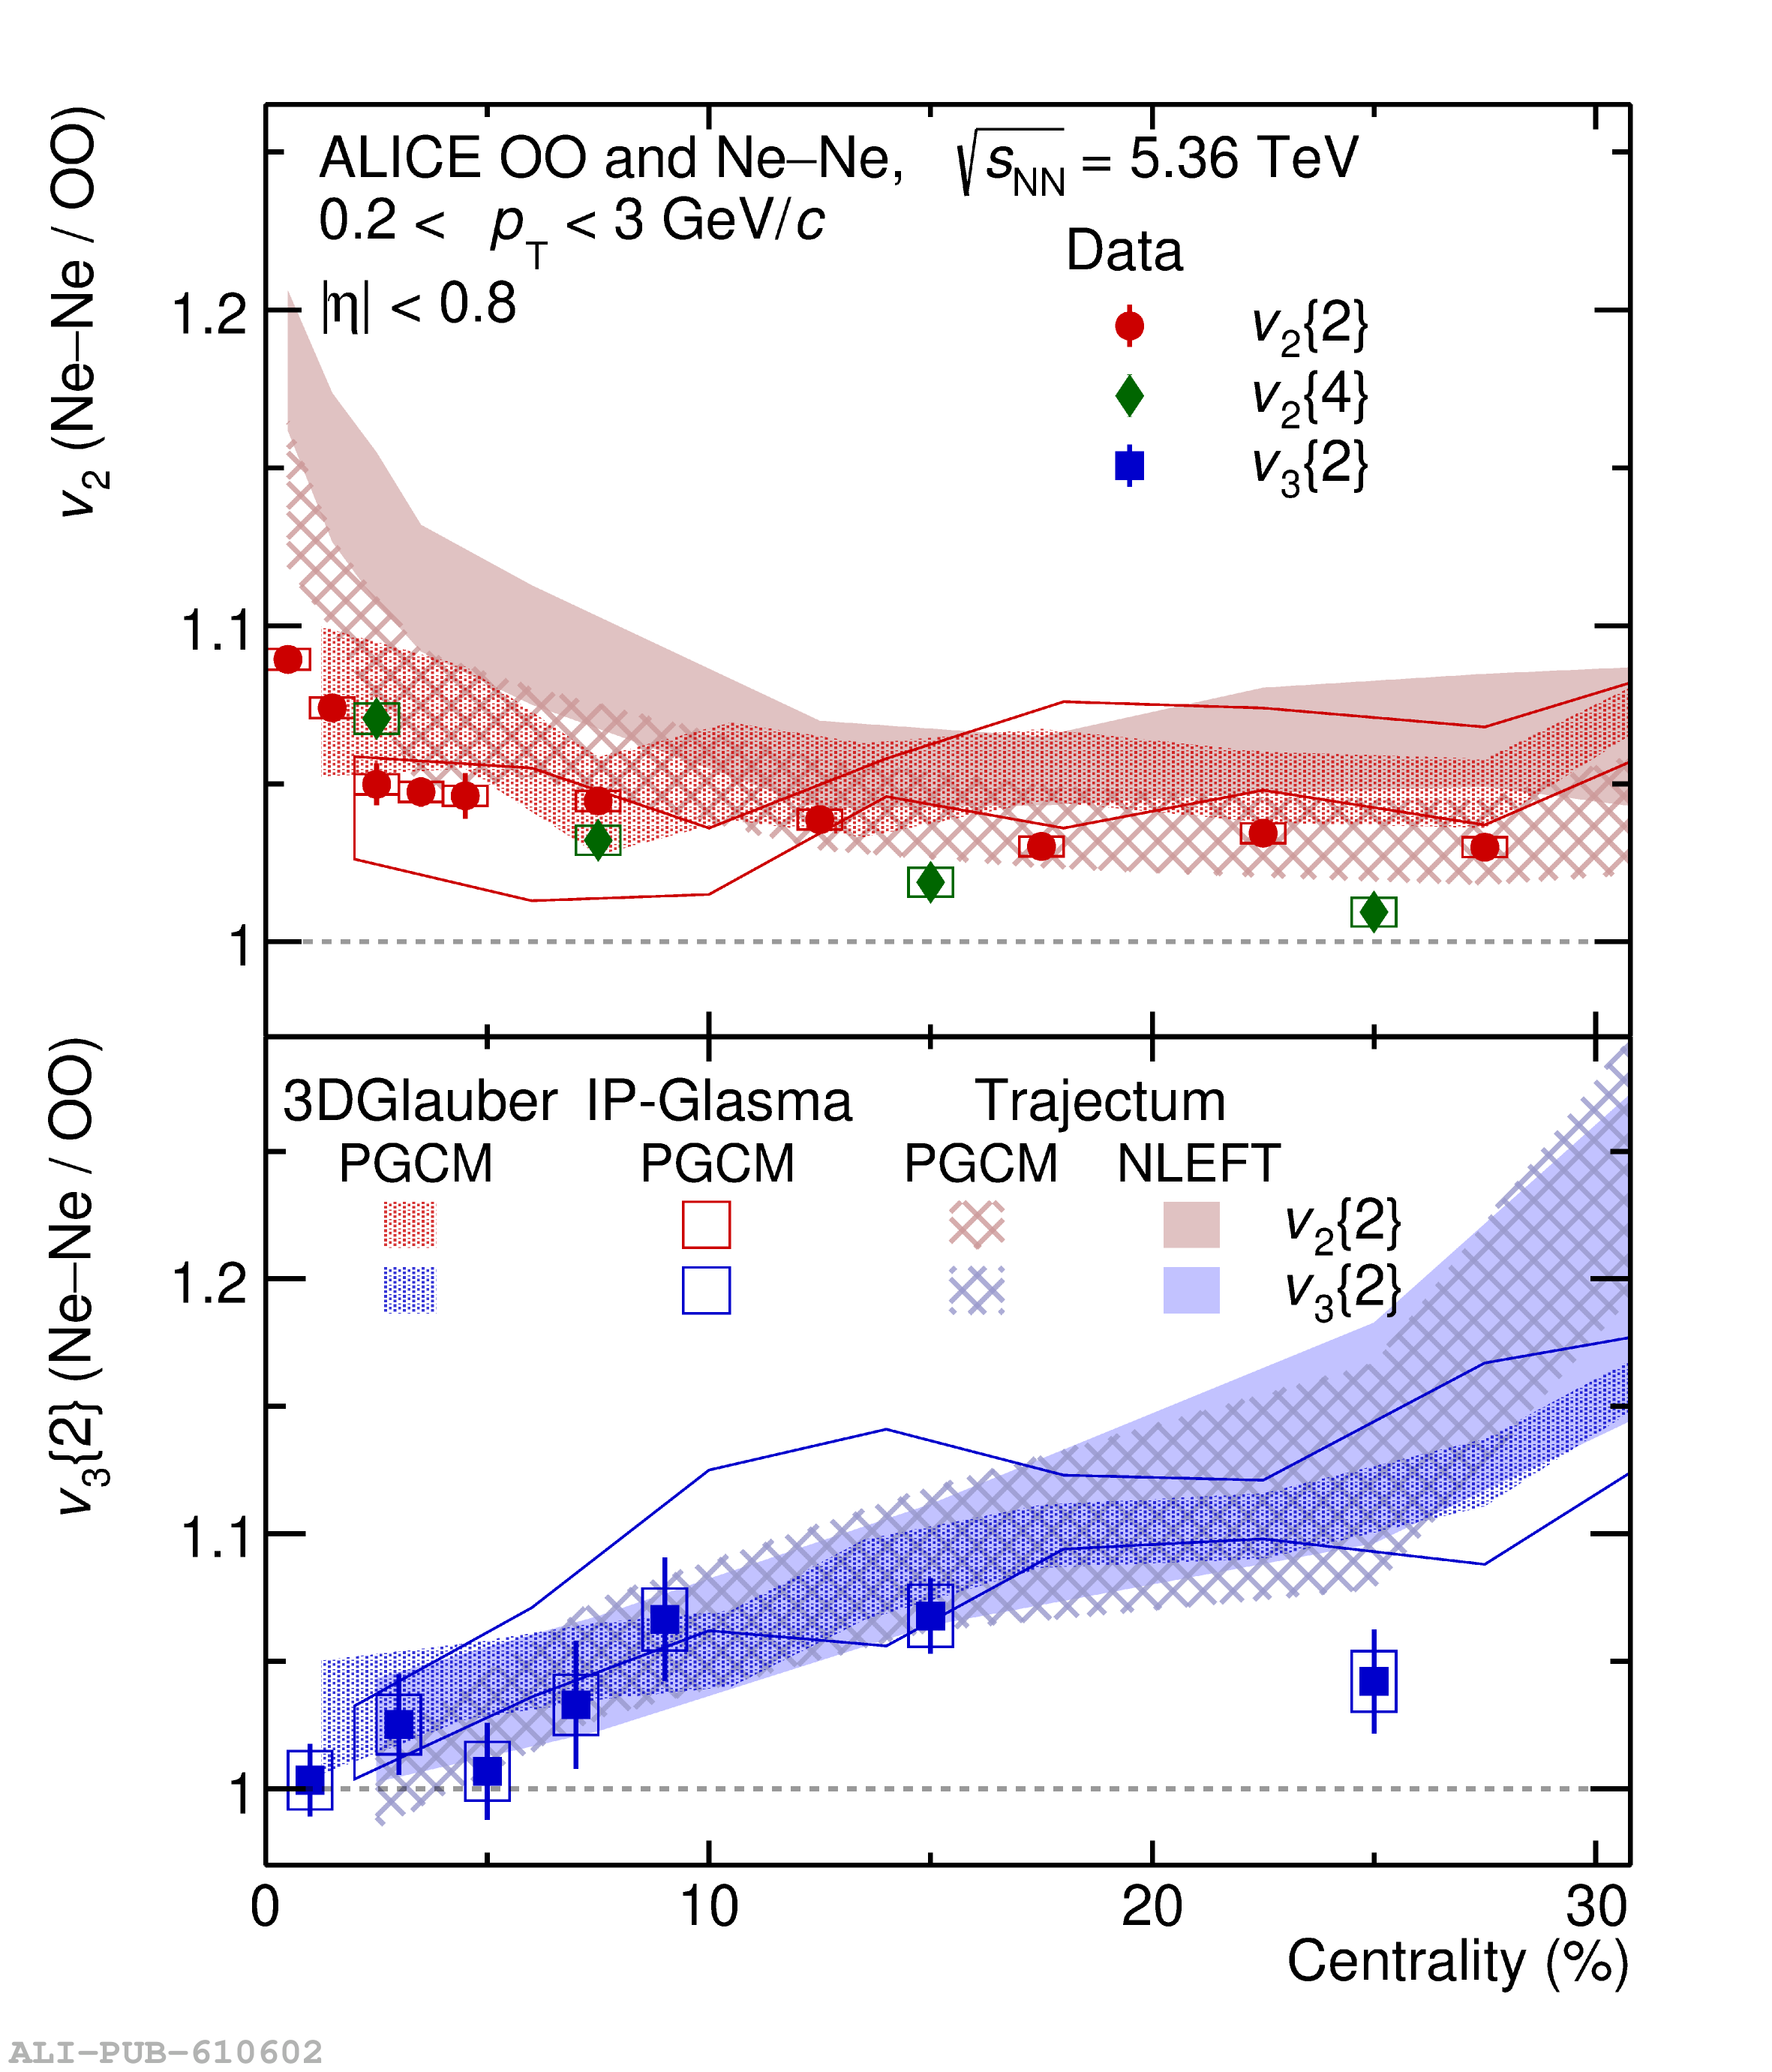 |