Comparison of predictions from models with and without hadronic cascade for a few selected SPC observables. The theoretical predictions from EKRT+hydrodynamics are shown in gray bands, \trento+iEBE-VISHNU+UrQMD in green bands, and \trento+iEBE-VISHNU in brown bands. The experimental data are shown as red circles with the lines (boxes) representing the statistical (systematic) uncertainties. The widths of the bands denote the statistical uncertainty of the model predictions. | 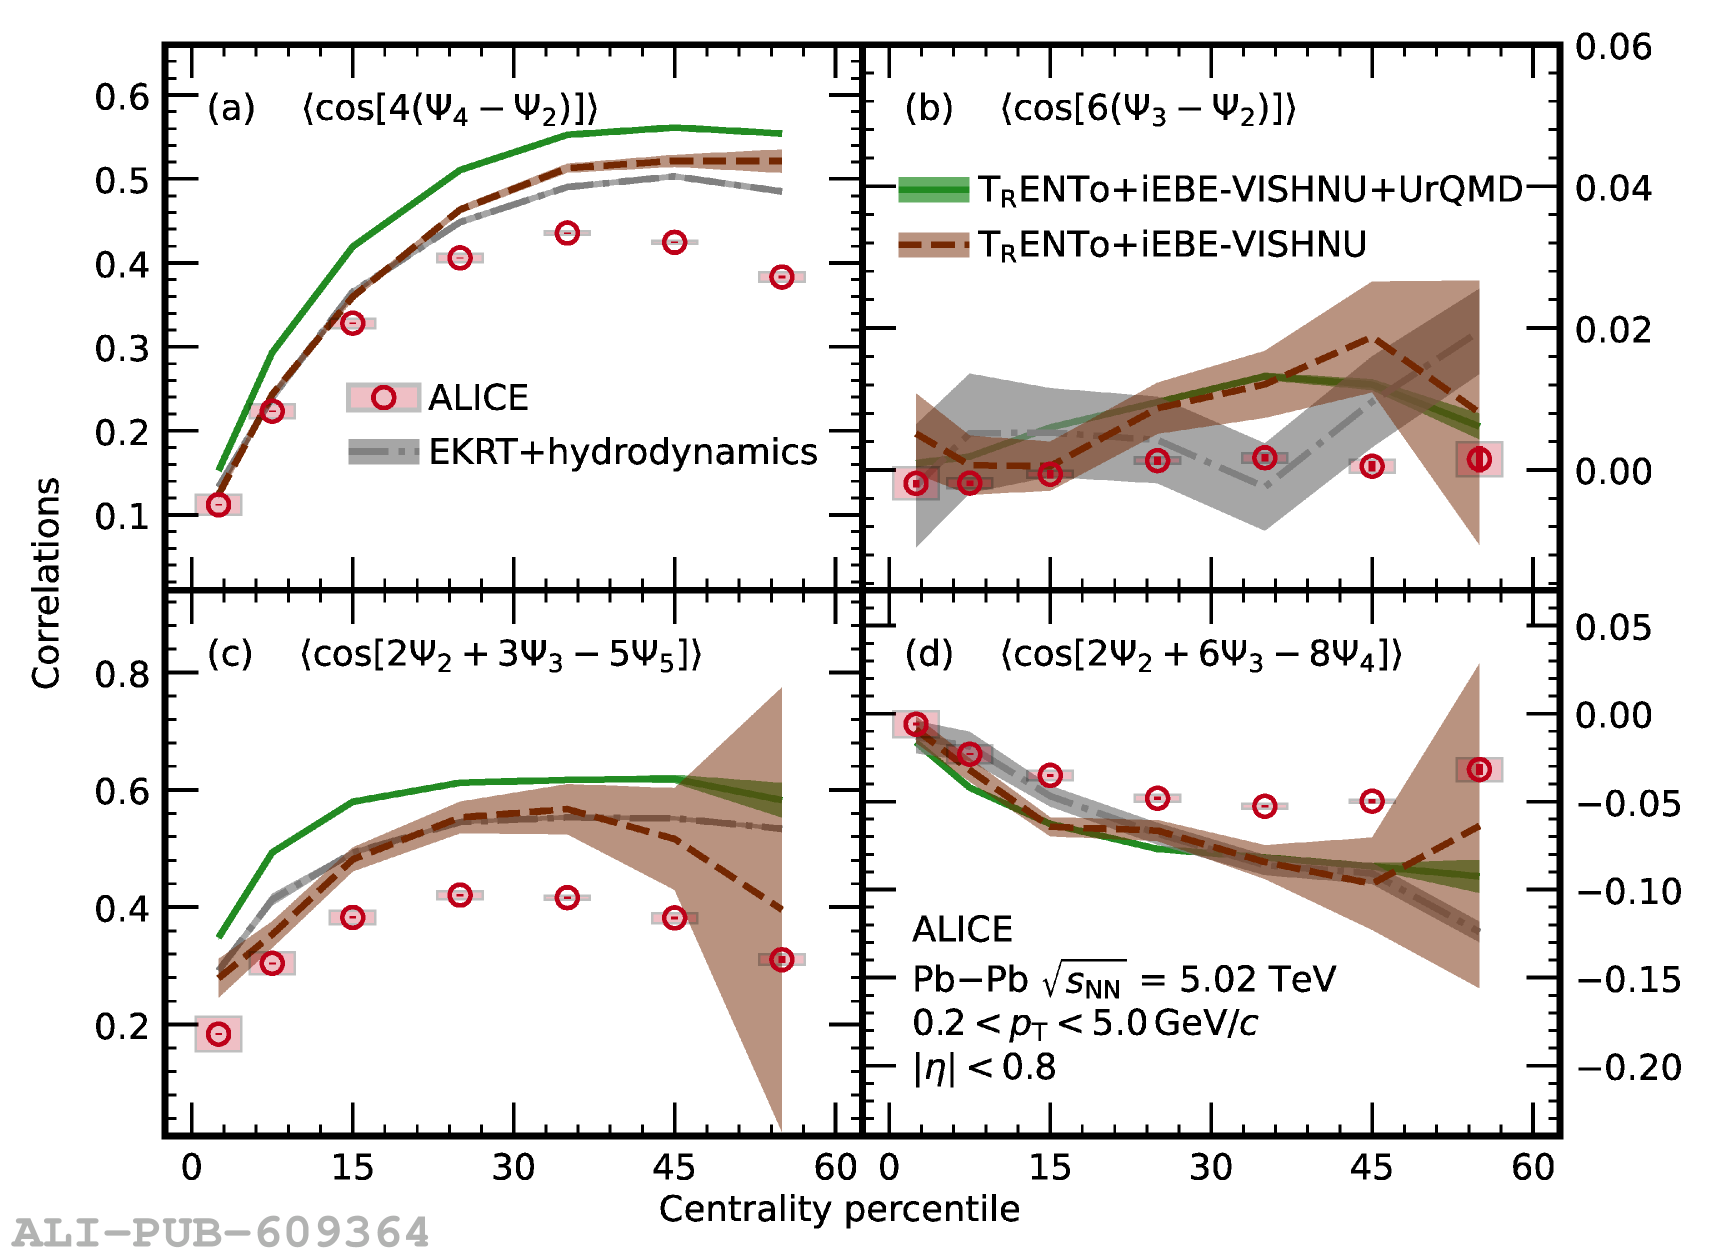 |