Source radius $r_{\textrm{core}}$ as a function of $\langle m_{\rm T} \rangle$ for the assumption of a Gaussian source with added resonances. The blue crosses result from fitting the p$-$p correlation function with the strong Argonne $v_{18}$ potential. The green squared crosses (red diagonal crosses) result from fitting the p$-\Lambda$ correlation functions with the strong $\chi$EFT LO (NLO) potential. Statistical (lines) and systematic (boxes) uncertainties are shown separately. The results shown in this figure were updated with respect to the initial publication [81] according to App.A [82]. | 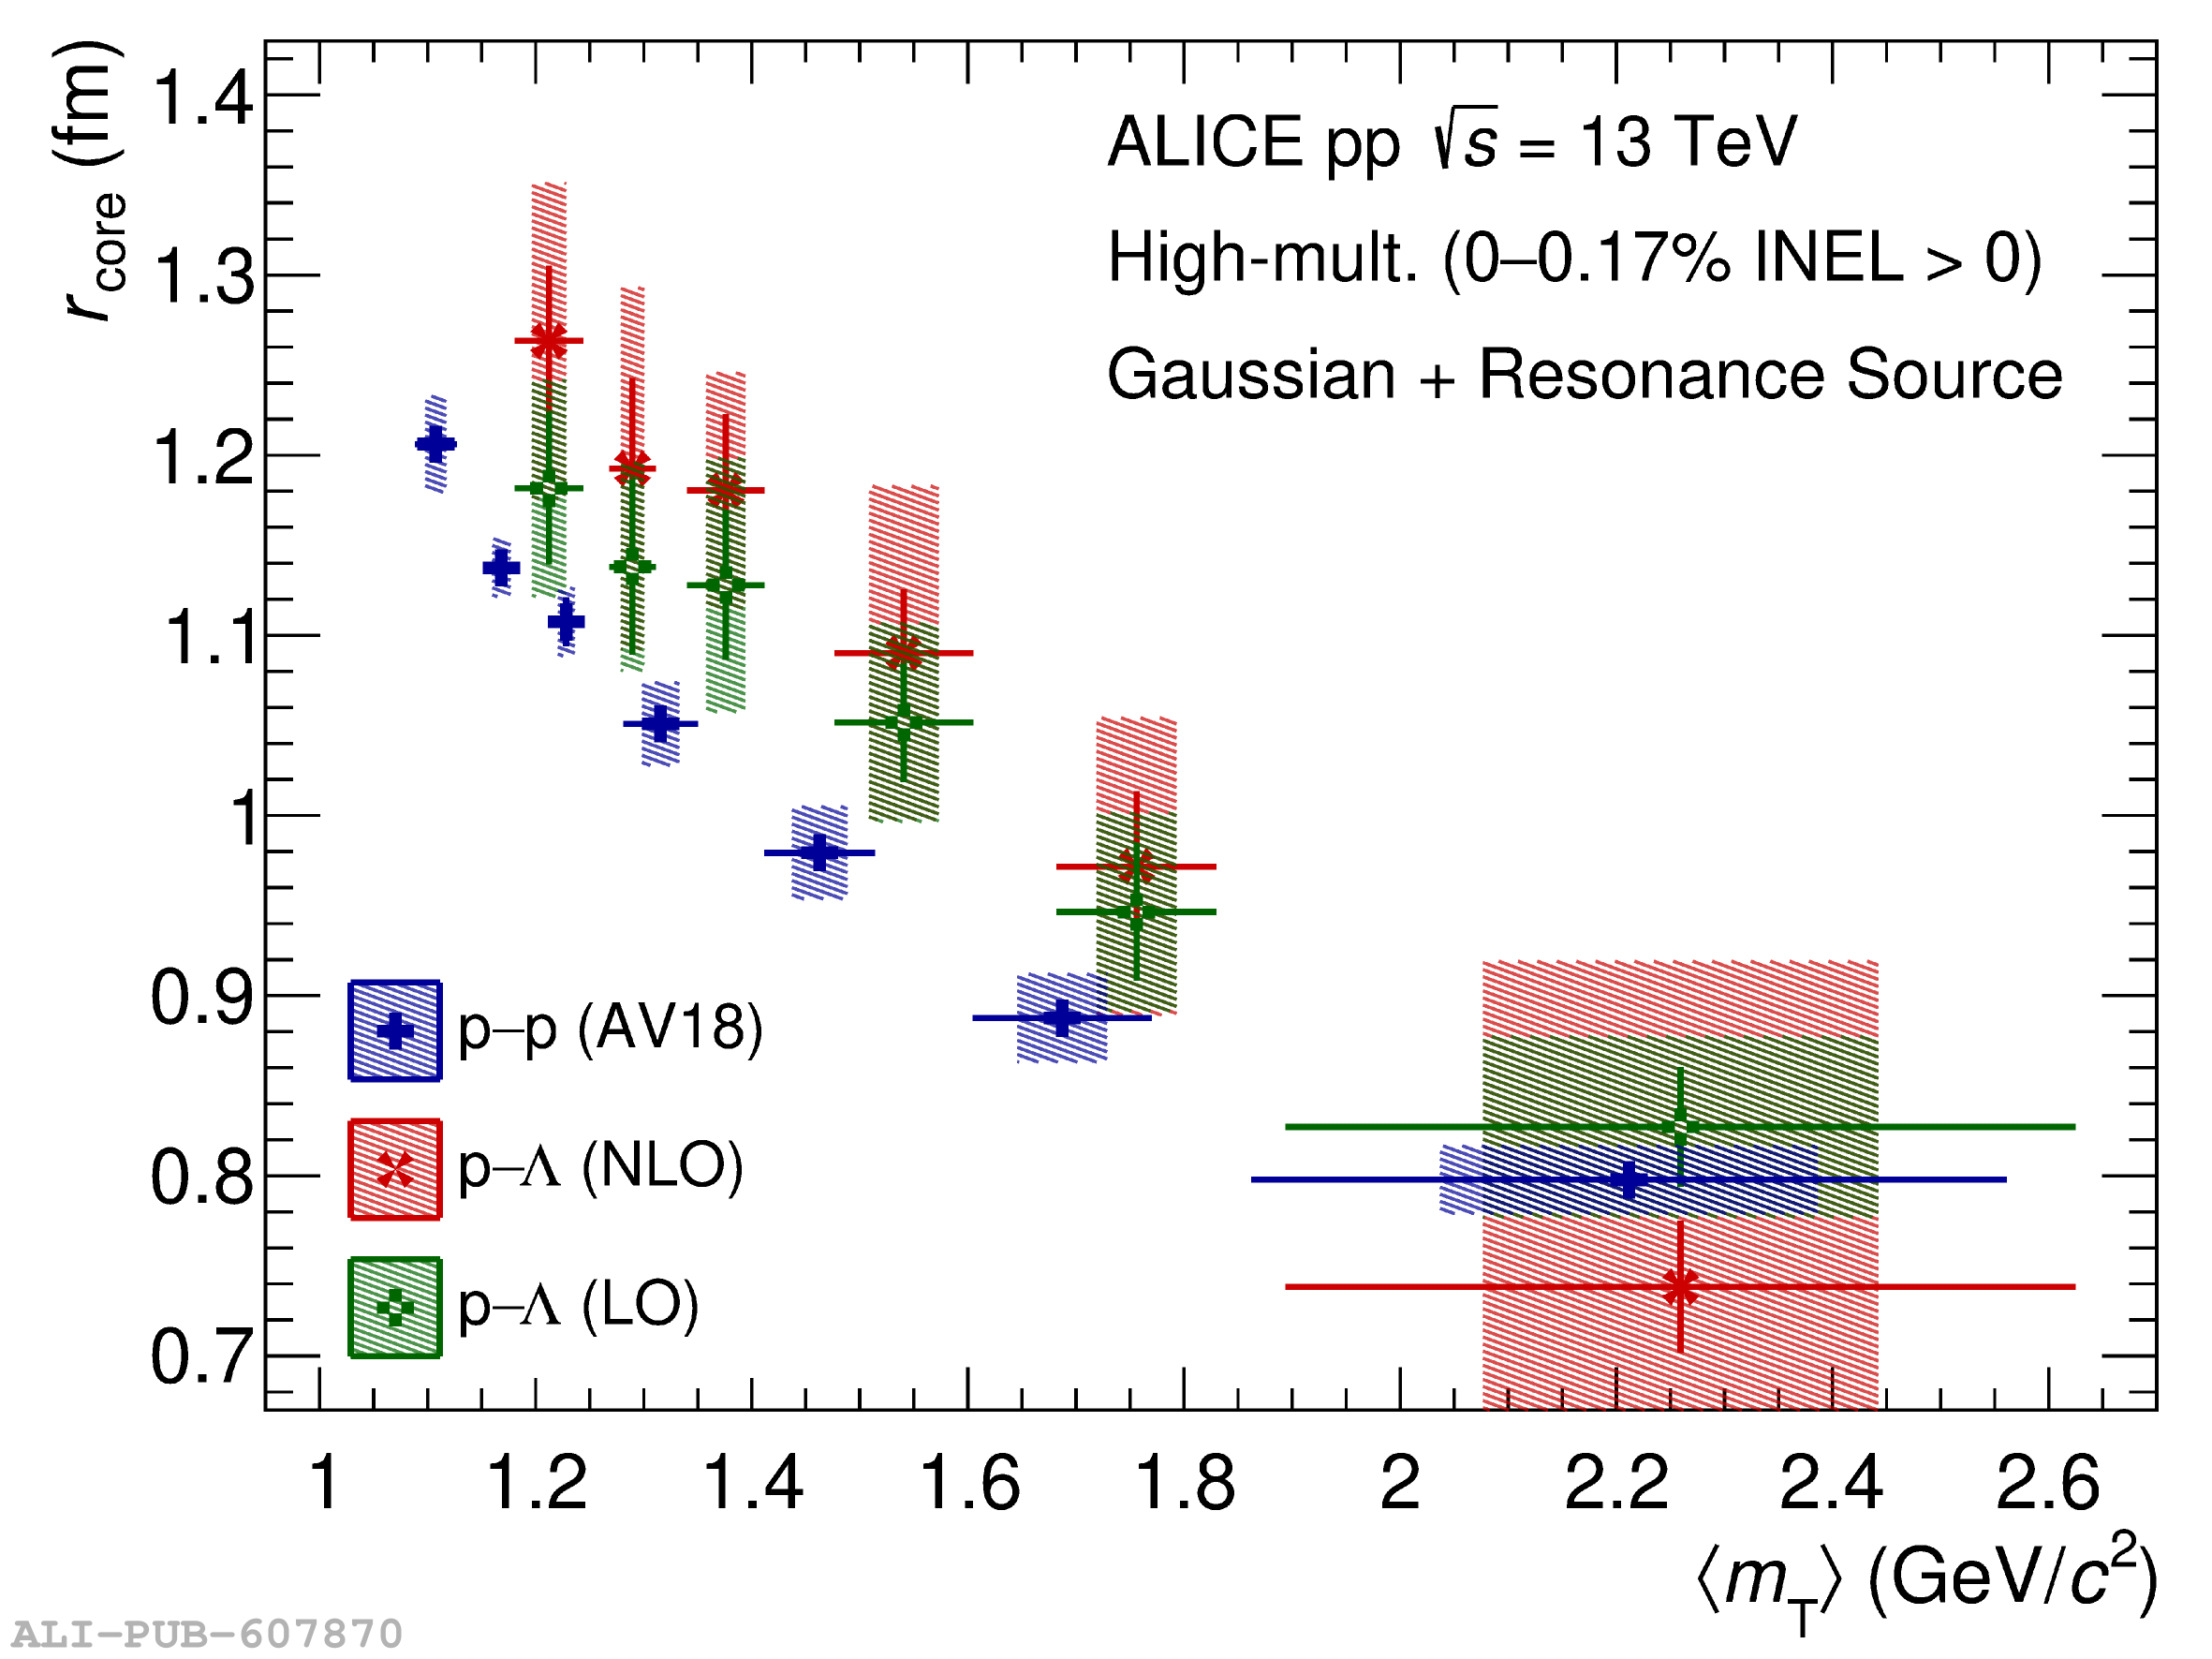 |