Projections of the coherent J/$\psi$ data points in (a) $\cos\theta$ and (b) $\varphi$, for events in the $-4 < y < -2.5$ rapidity interval. The curves are obtained by setting the lambda parameters in Eq.2 to the results of the fit to the distribution given in Table 2. The uncertainties on the data points are statistical. | 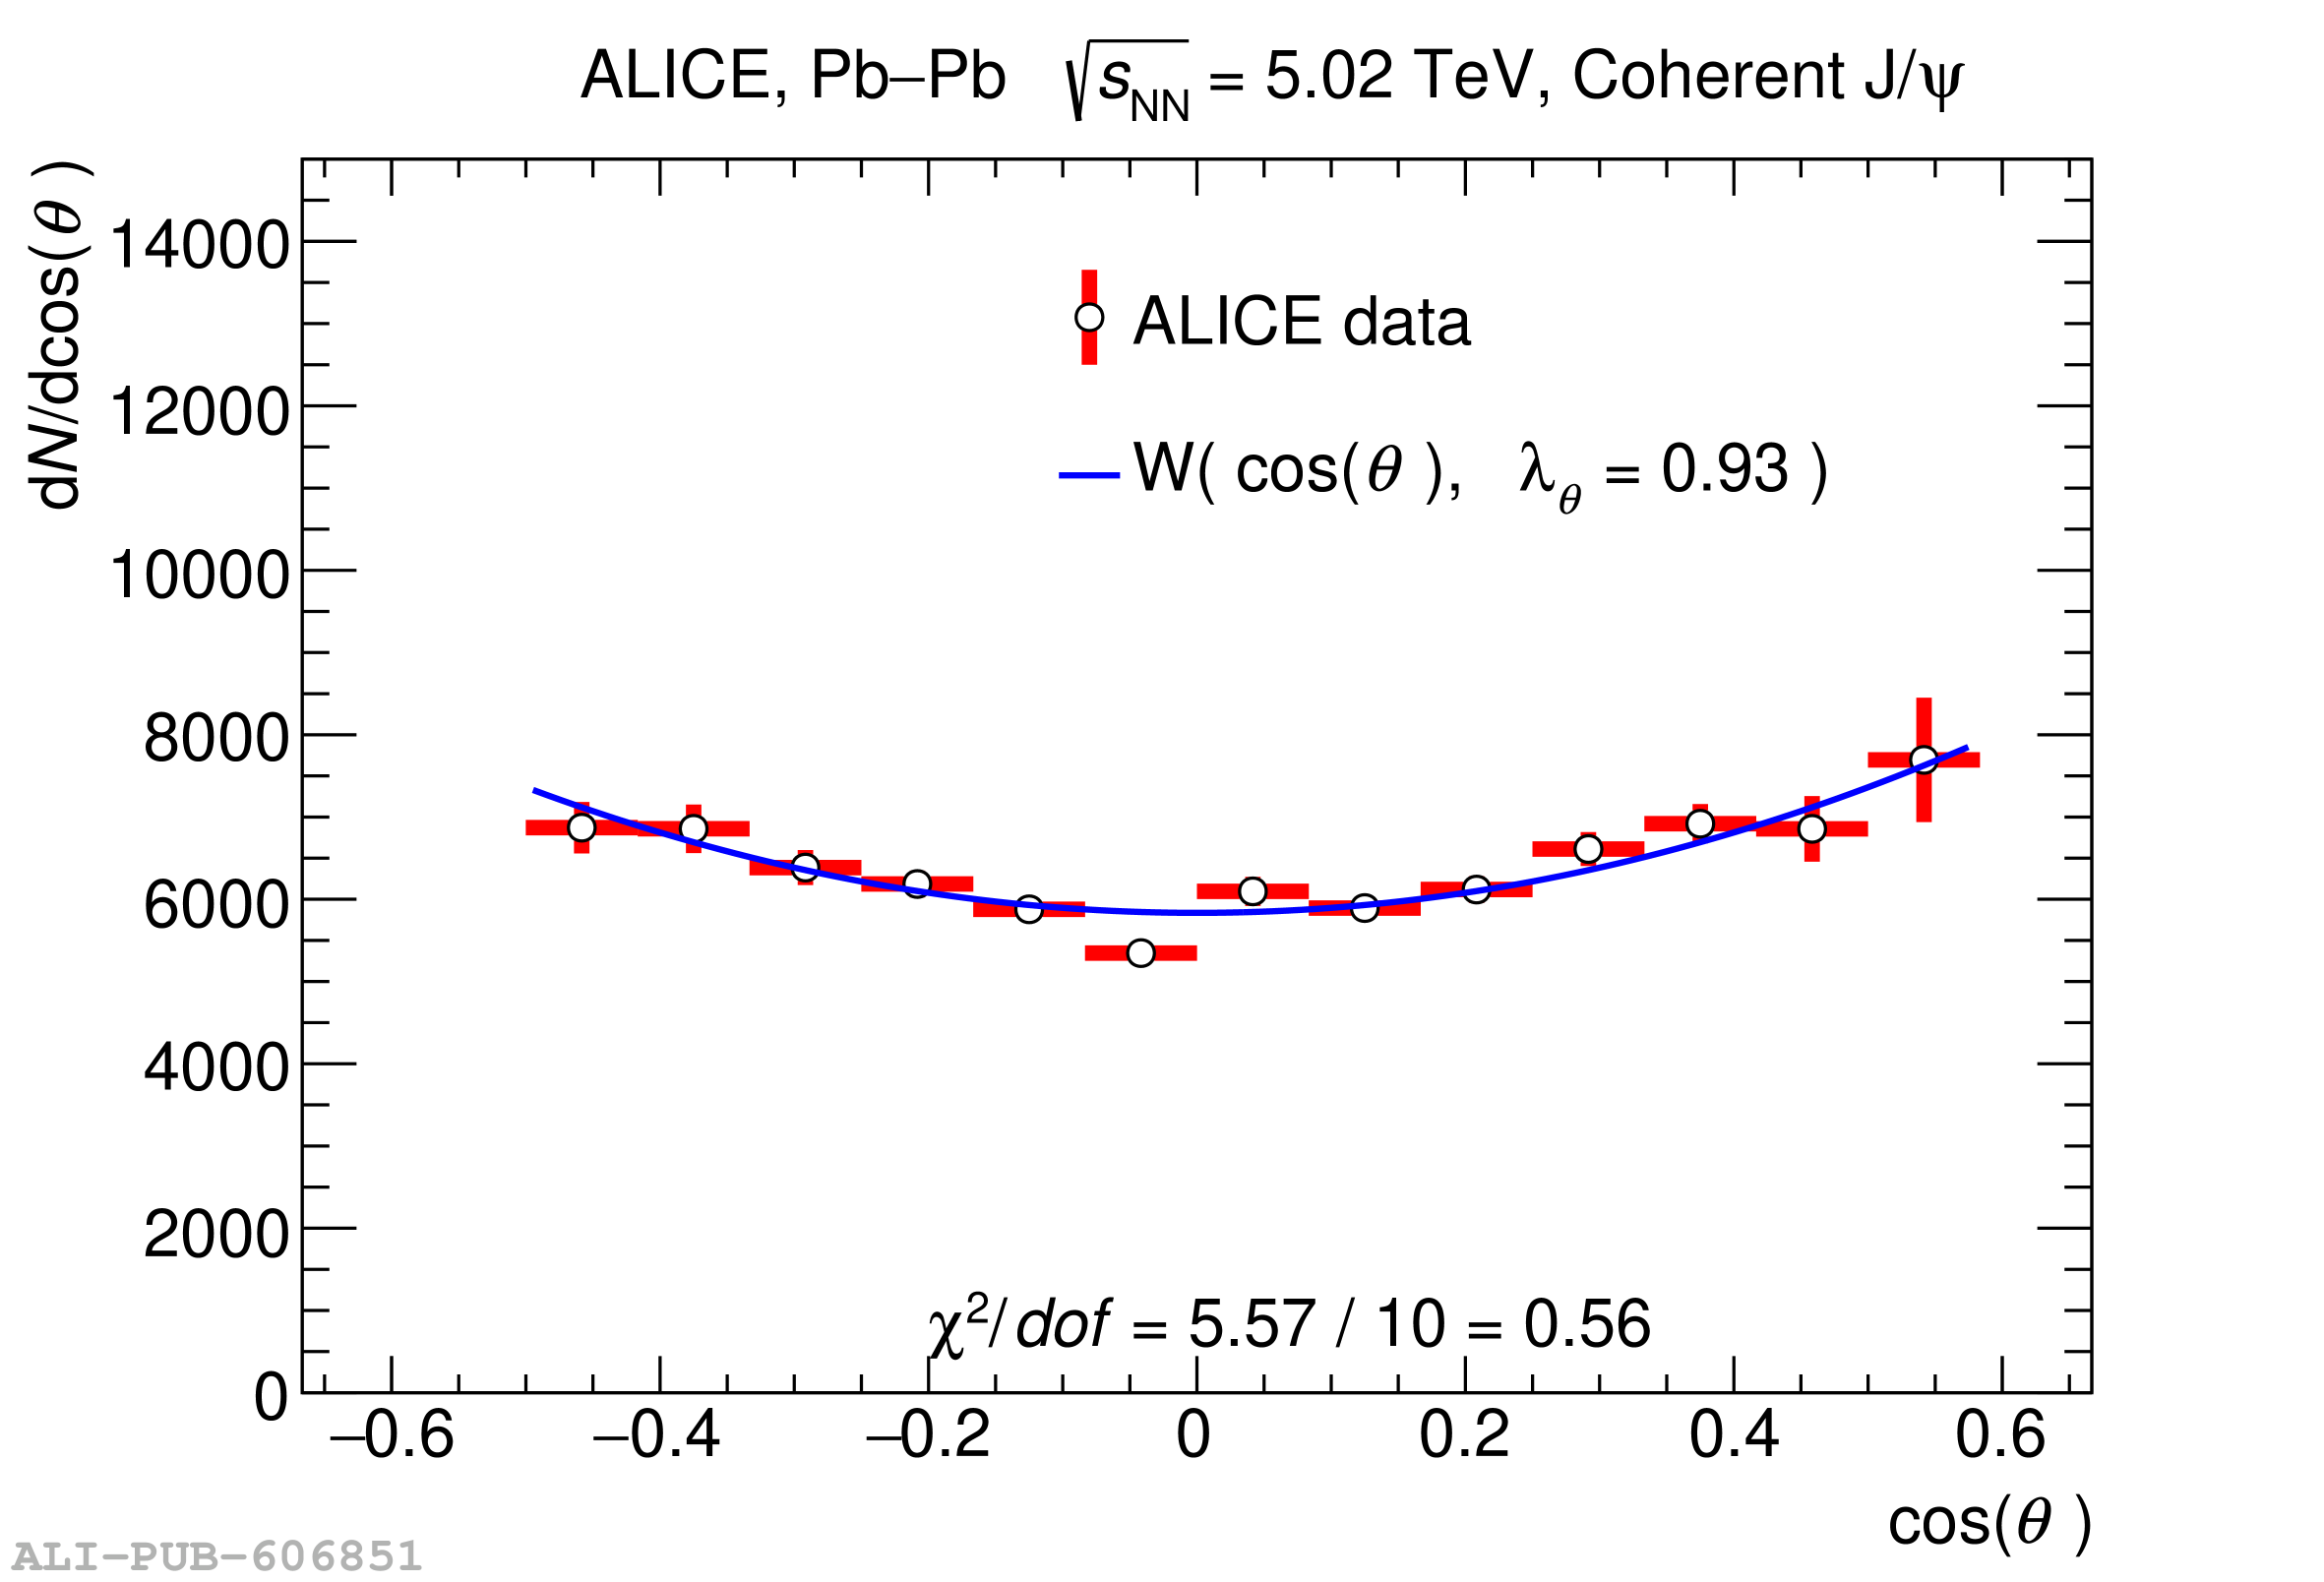 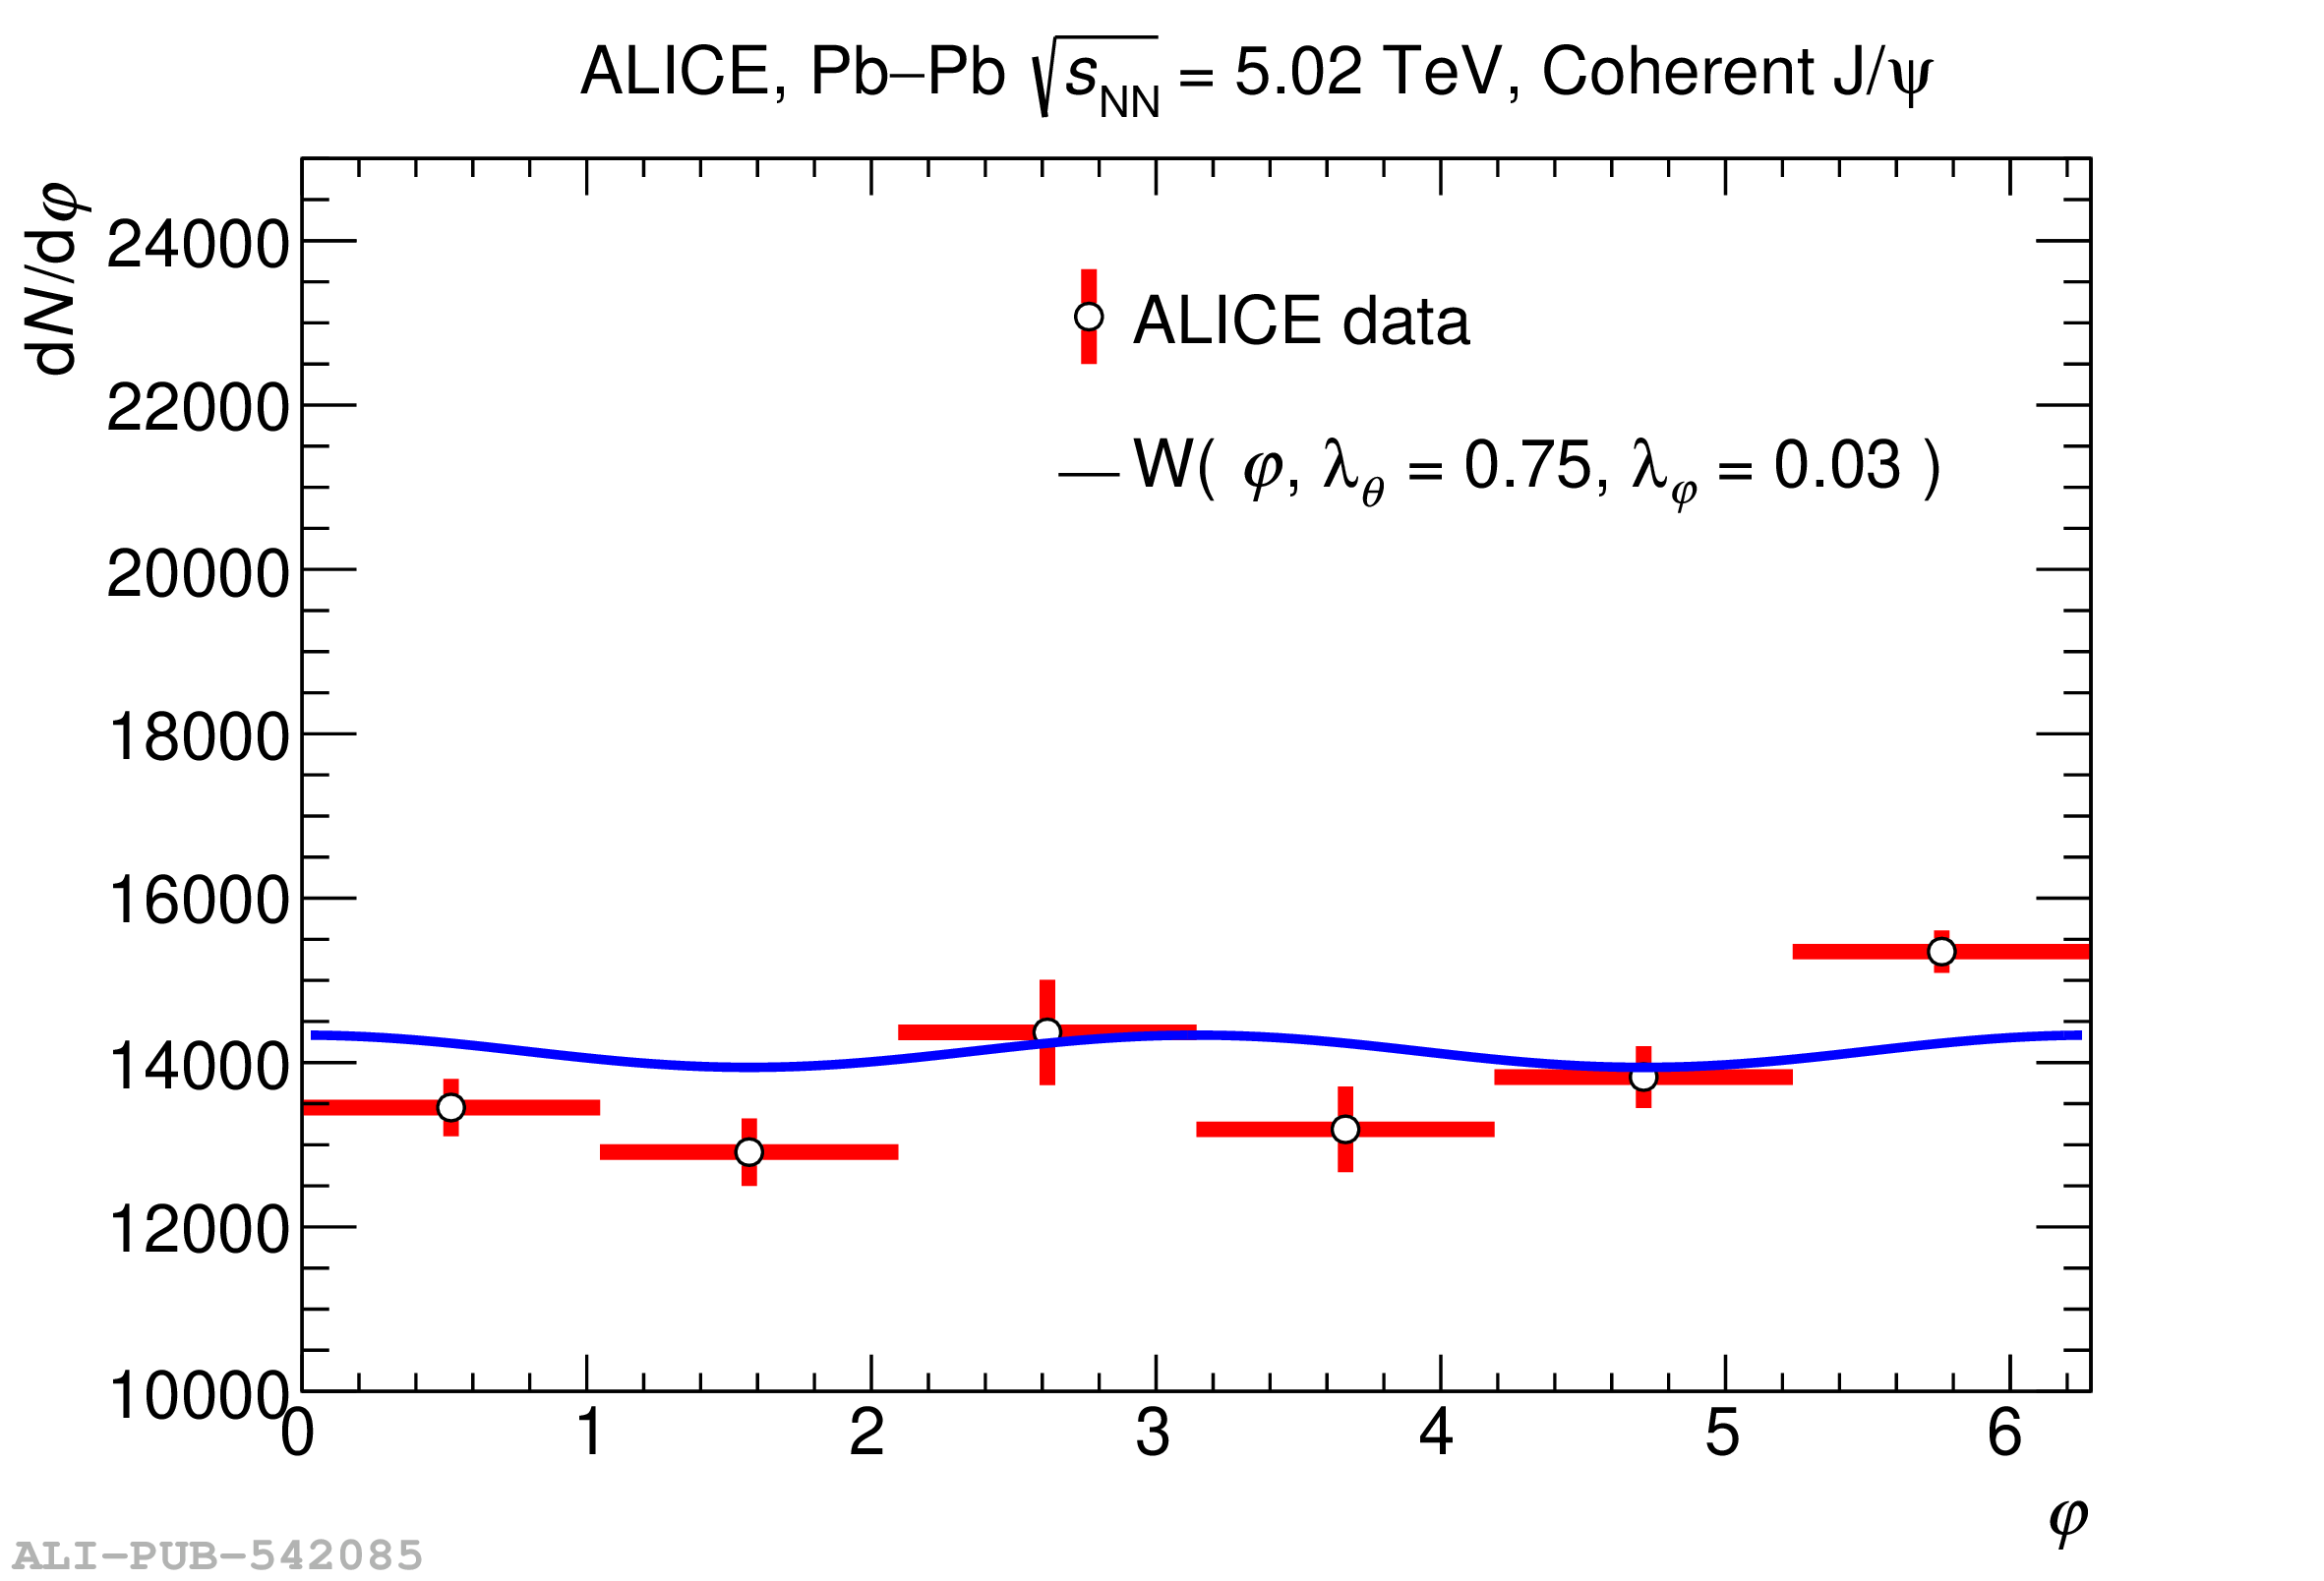 |