Invariant mass distribution of D*$^{+}$ candidates in pp collisions at $\sqrt{s}=$ 13 TeV for 65 $< p_{\rm T} < $ 80 GeV/$c$ (left) and 100 $< p_{\rm T}< $ 140 GeV/$c$ (right) using the EMCal L1 triggered data. The raw data distribution is shown in black, while the combined signal and background fit is overlayed as a blue line. The separated components of the signal and background contribution to the fit are displayed as red and gray lines, respectively. | 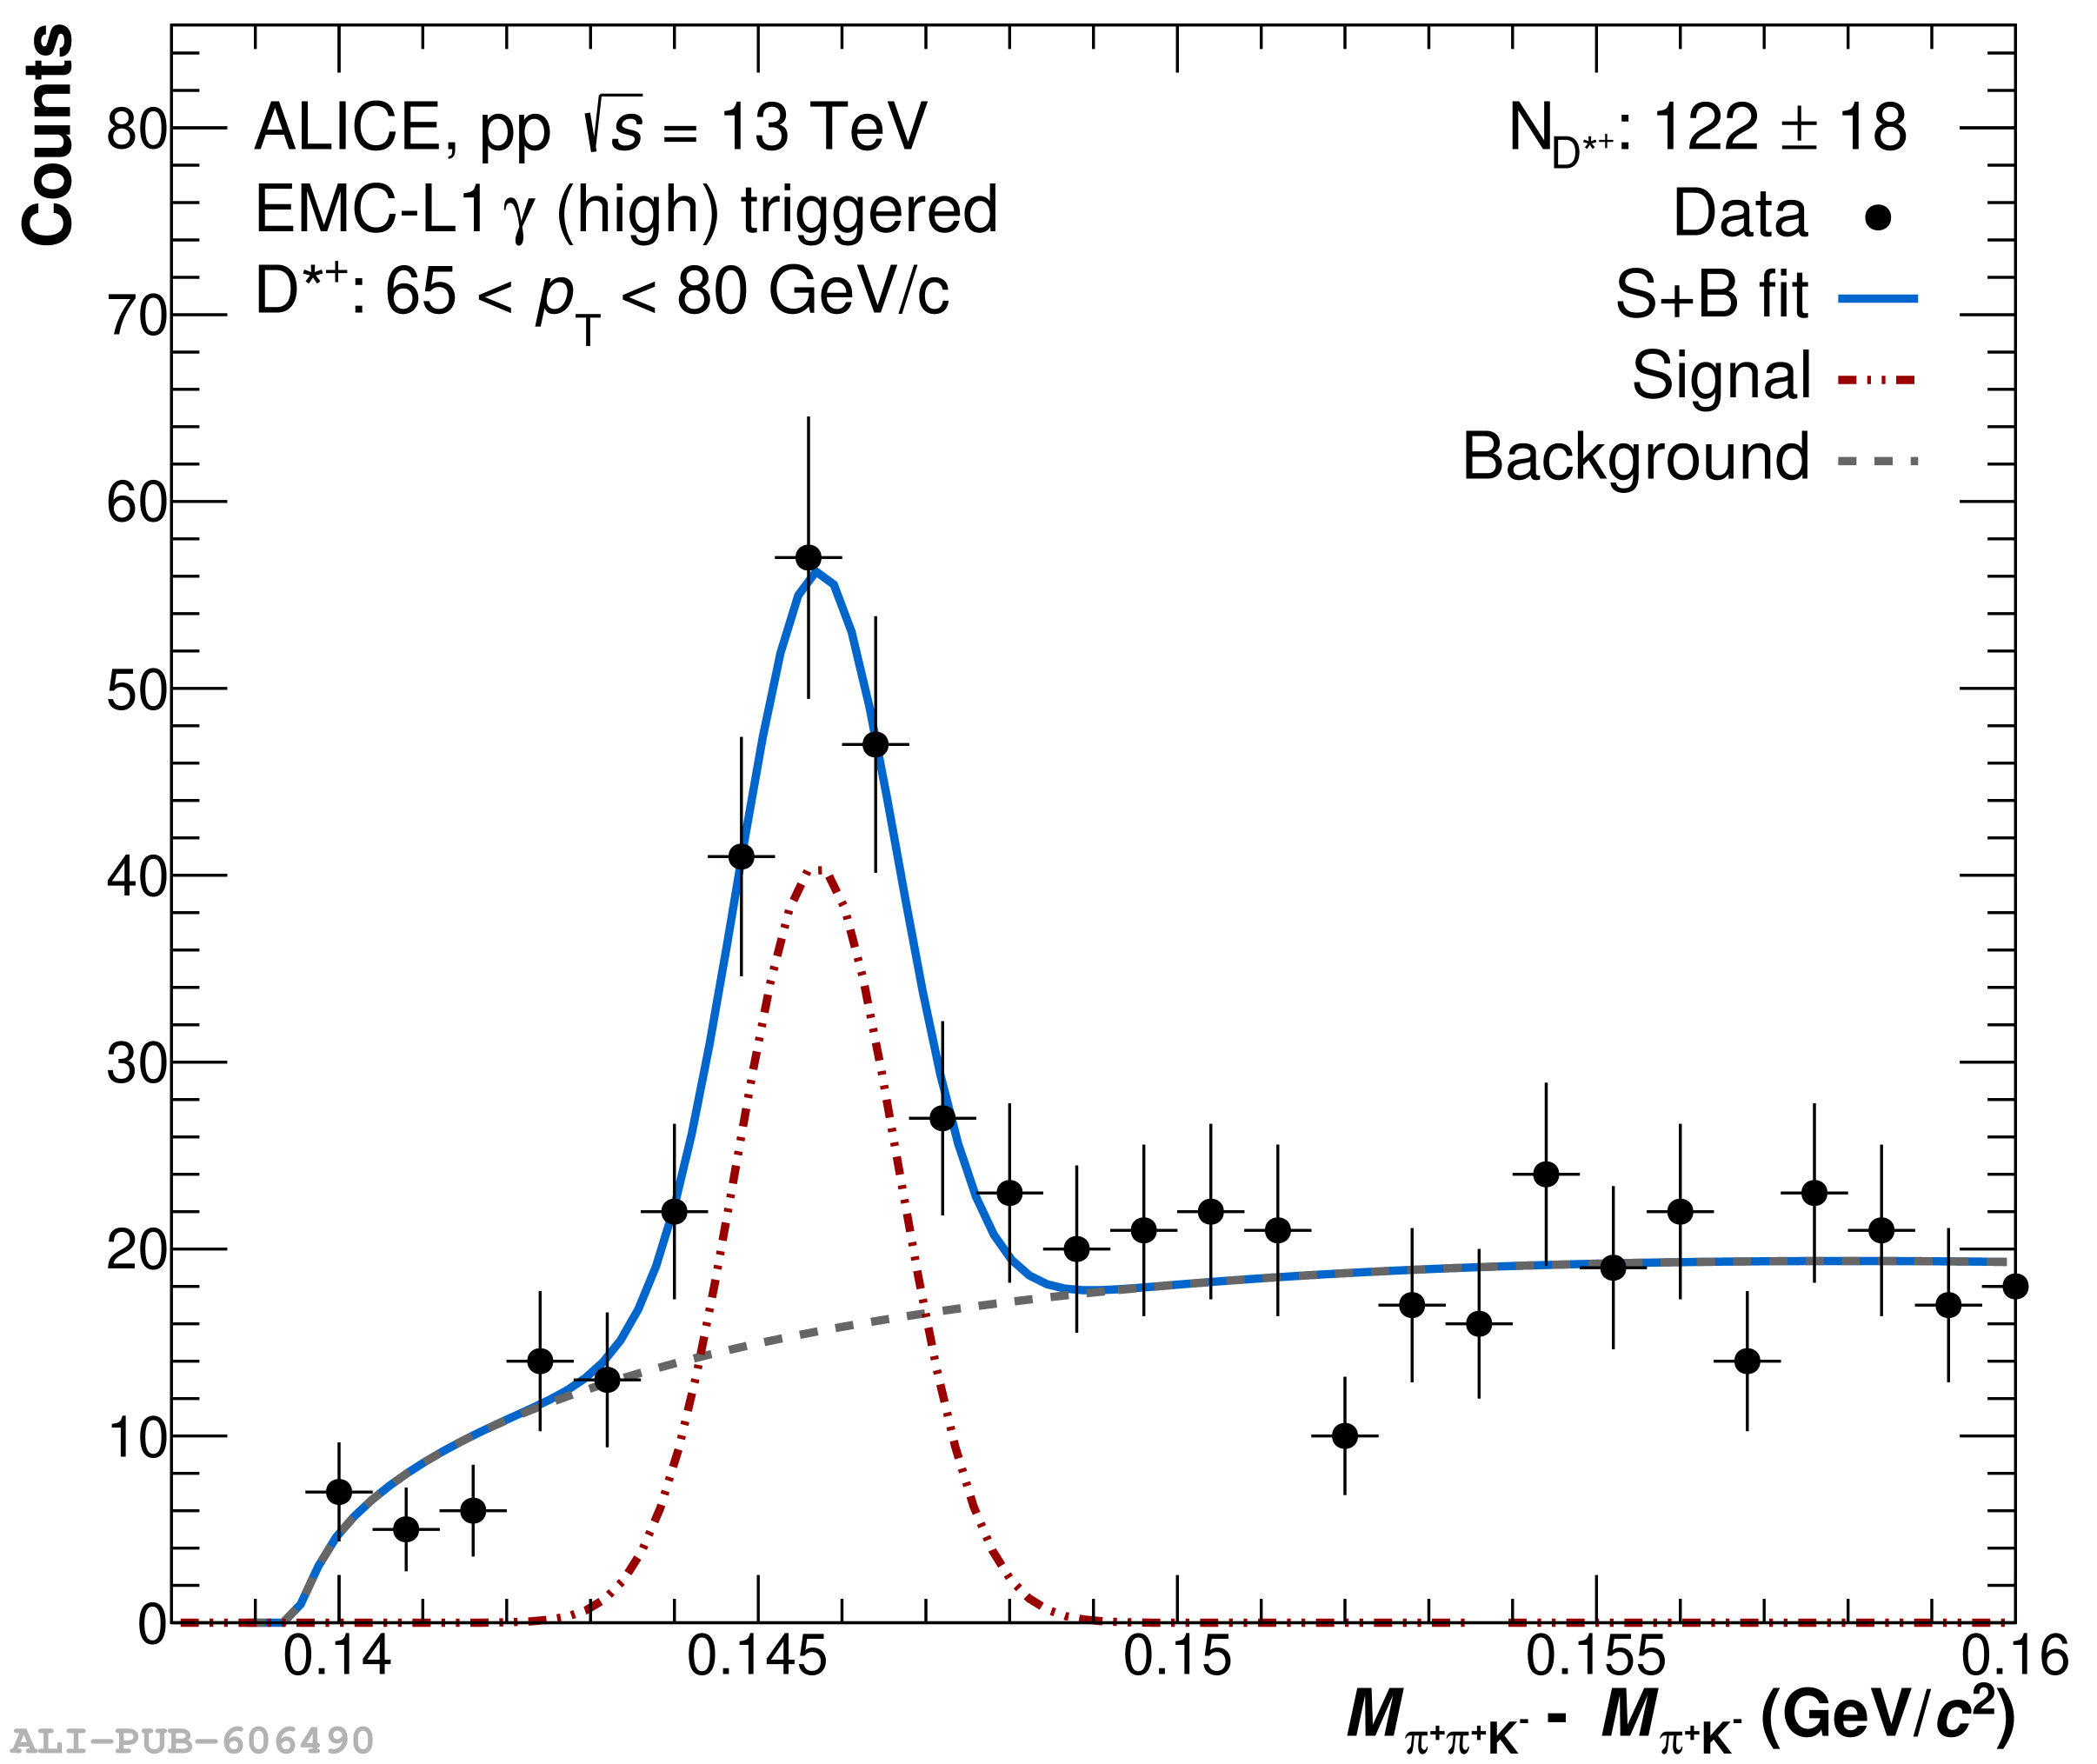 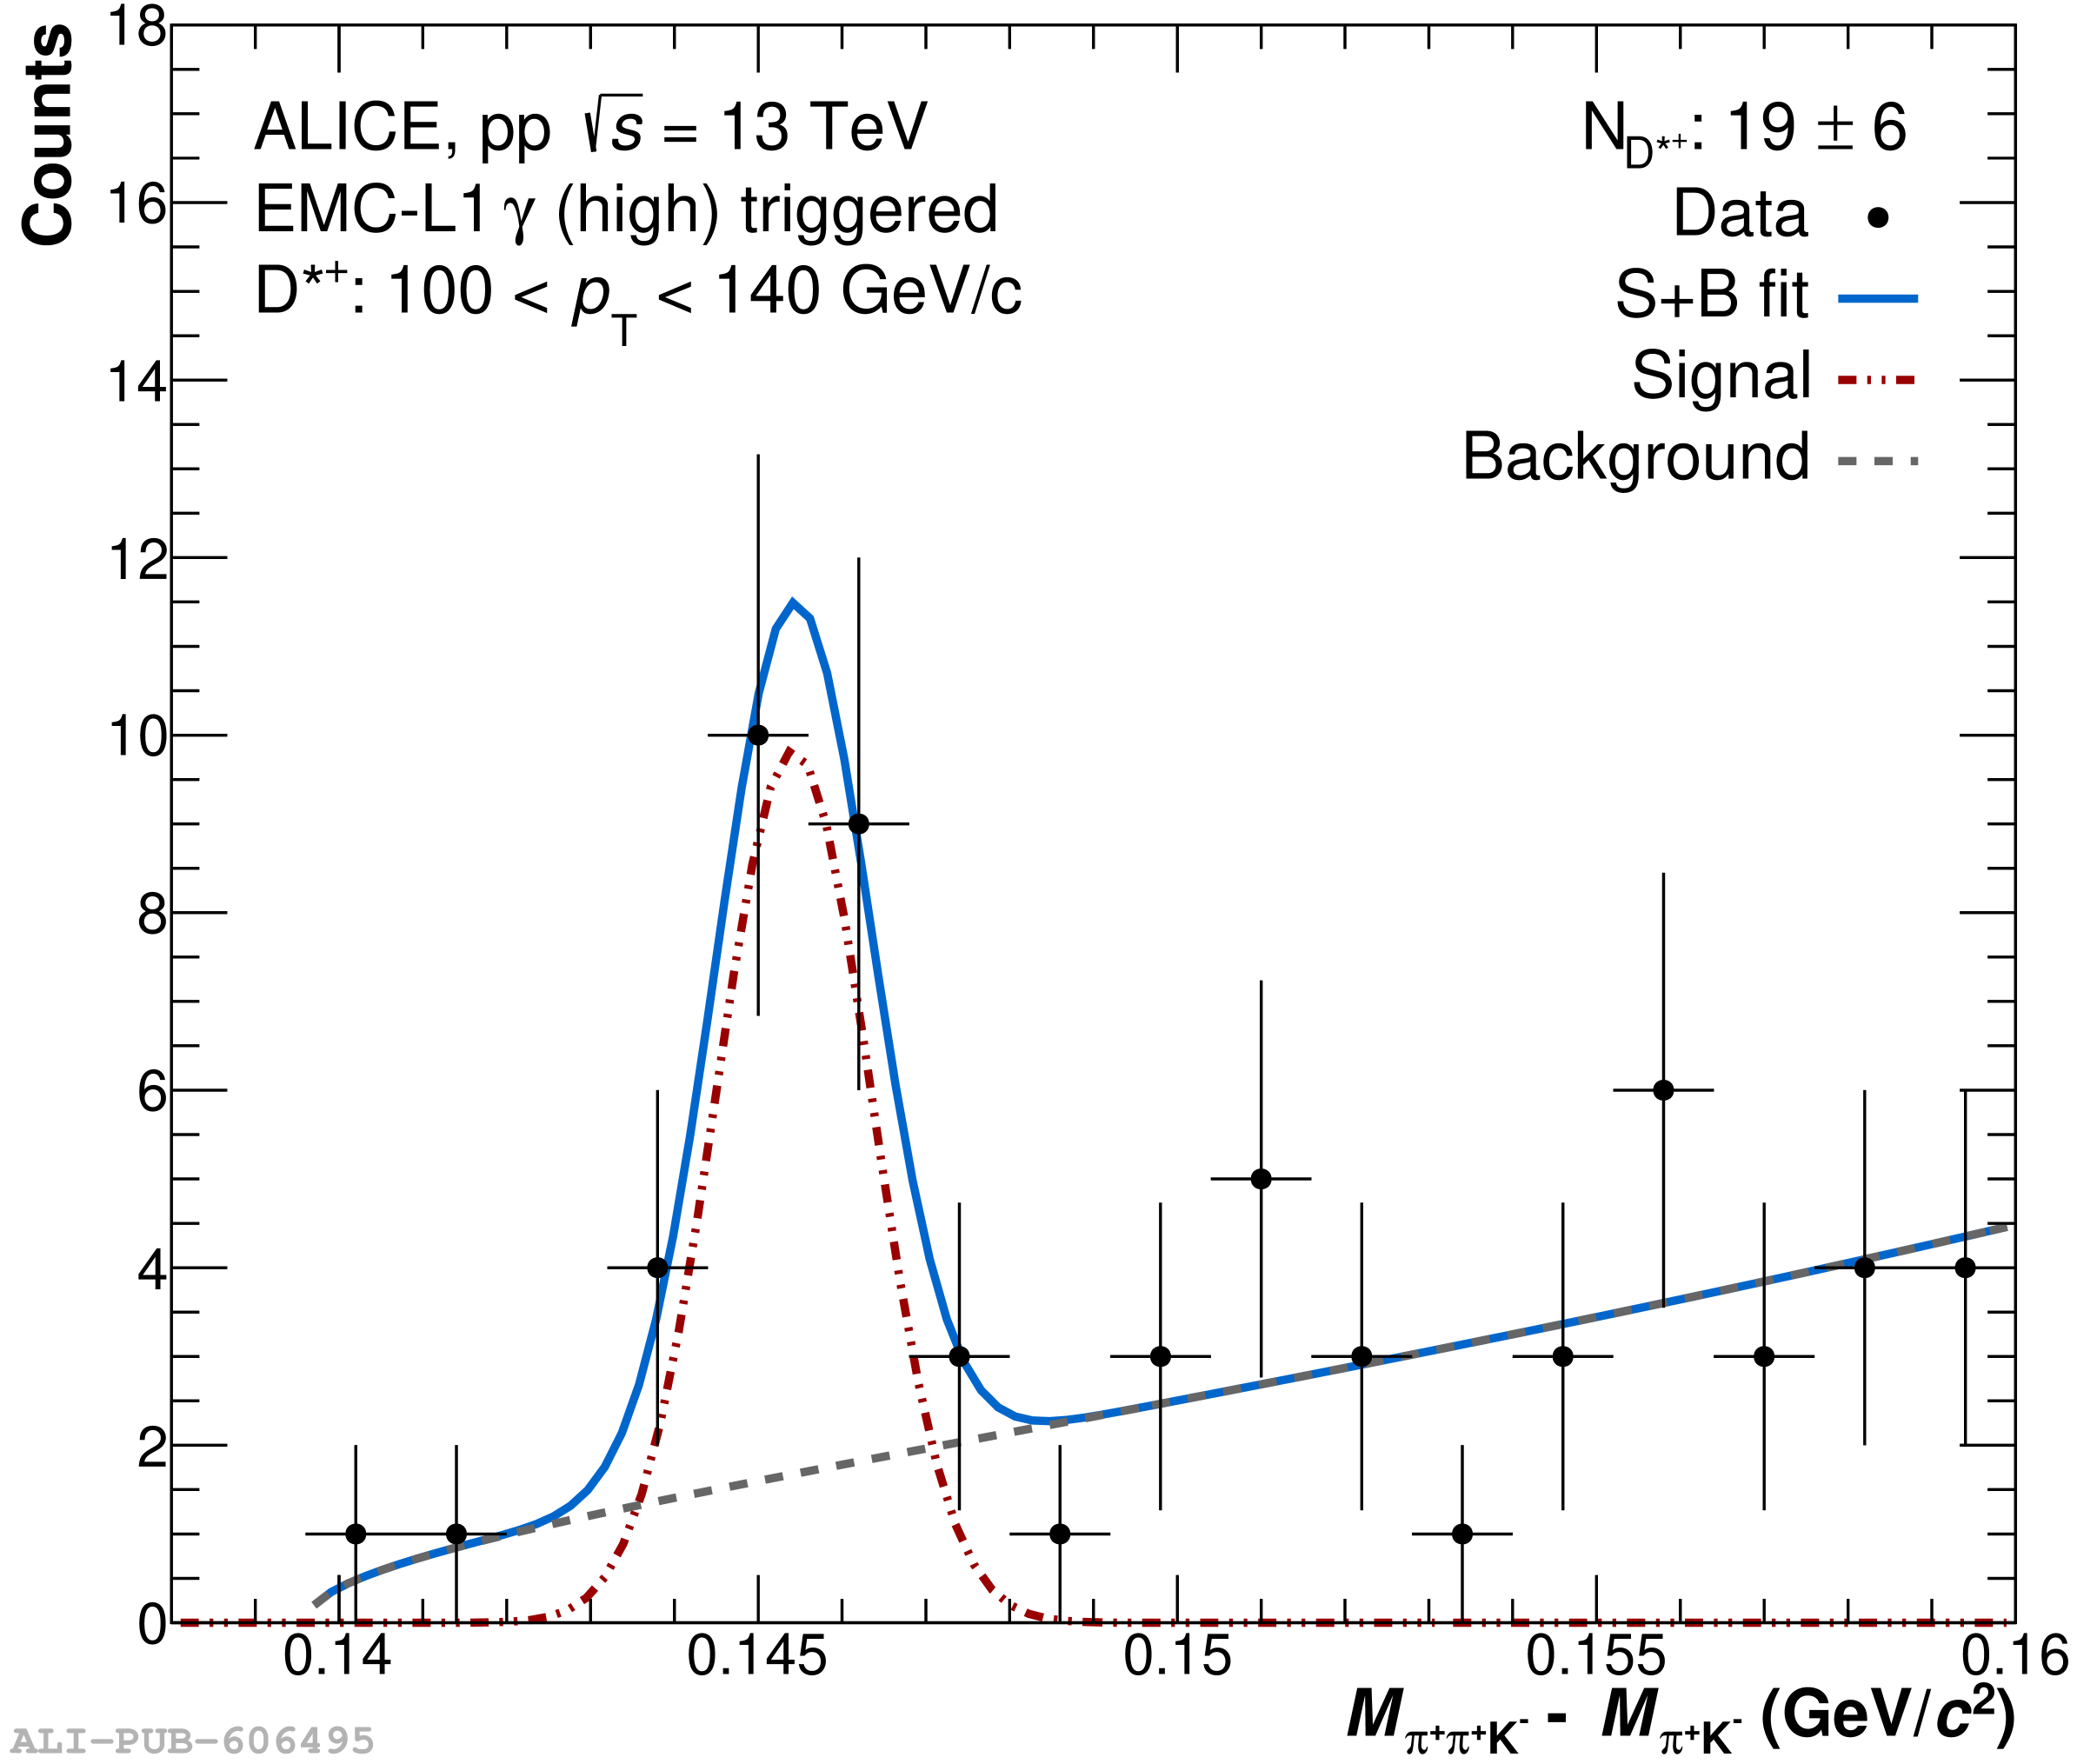 |