Left: Comparison of the $E/p$ distribution between real (black) and simulated (red) data for electron candidates with 3 $< p_{\rm T}< $ 4 GeV/$c$ in pp collisions at $\sqrt{s}=$ 13 TeV. Gaussian fits with exponential tails to both sides are superimposed for both distributions in the corresponding color. The truncated means for data and MC are indicated by vertical colored lines. The truncation and signal integration window is indicated by vertical dashed gray lines. Right: Data and simulation comparison of width (top) and mean (bottom) of the $E/p$ distributions of electrons as a function of transverse momentum in pp collisions at $\sqrt{s}=$ 13 TeV. Fit functions are shown as dashed lines, where their functional form is given in the respective legends. | 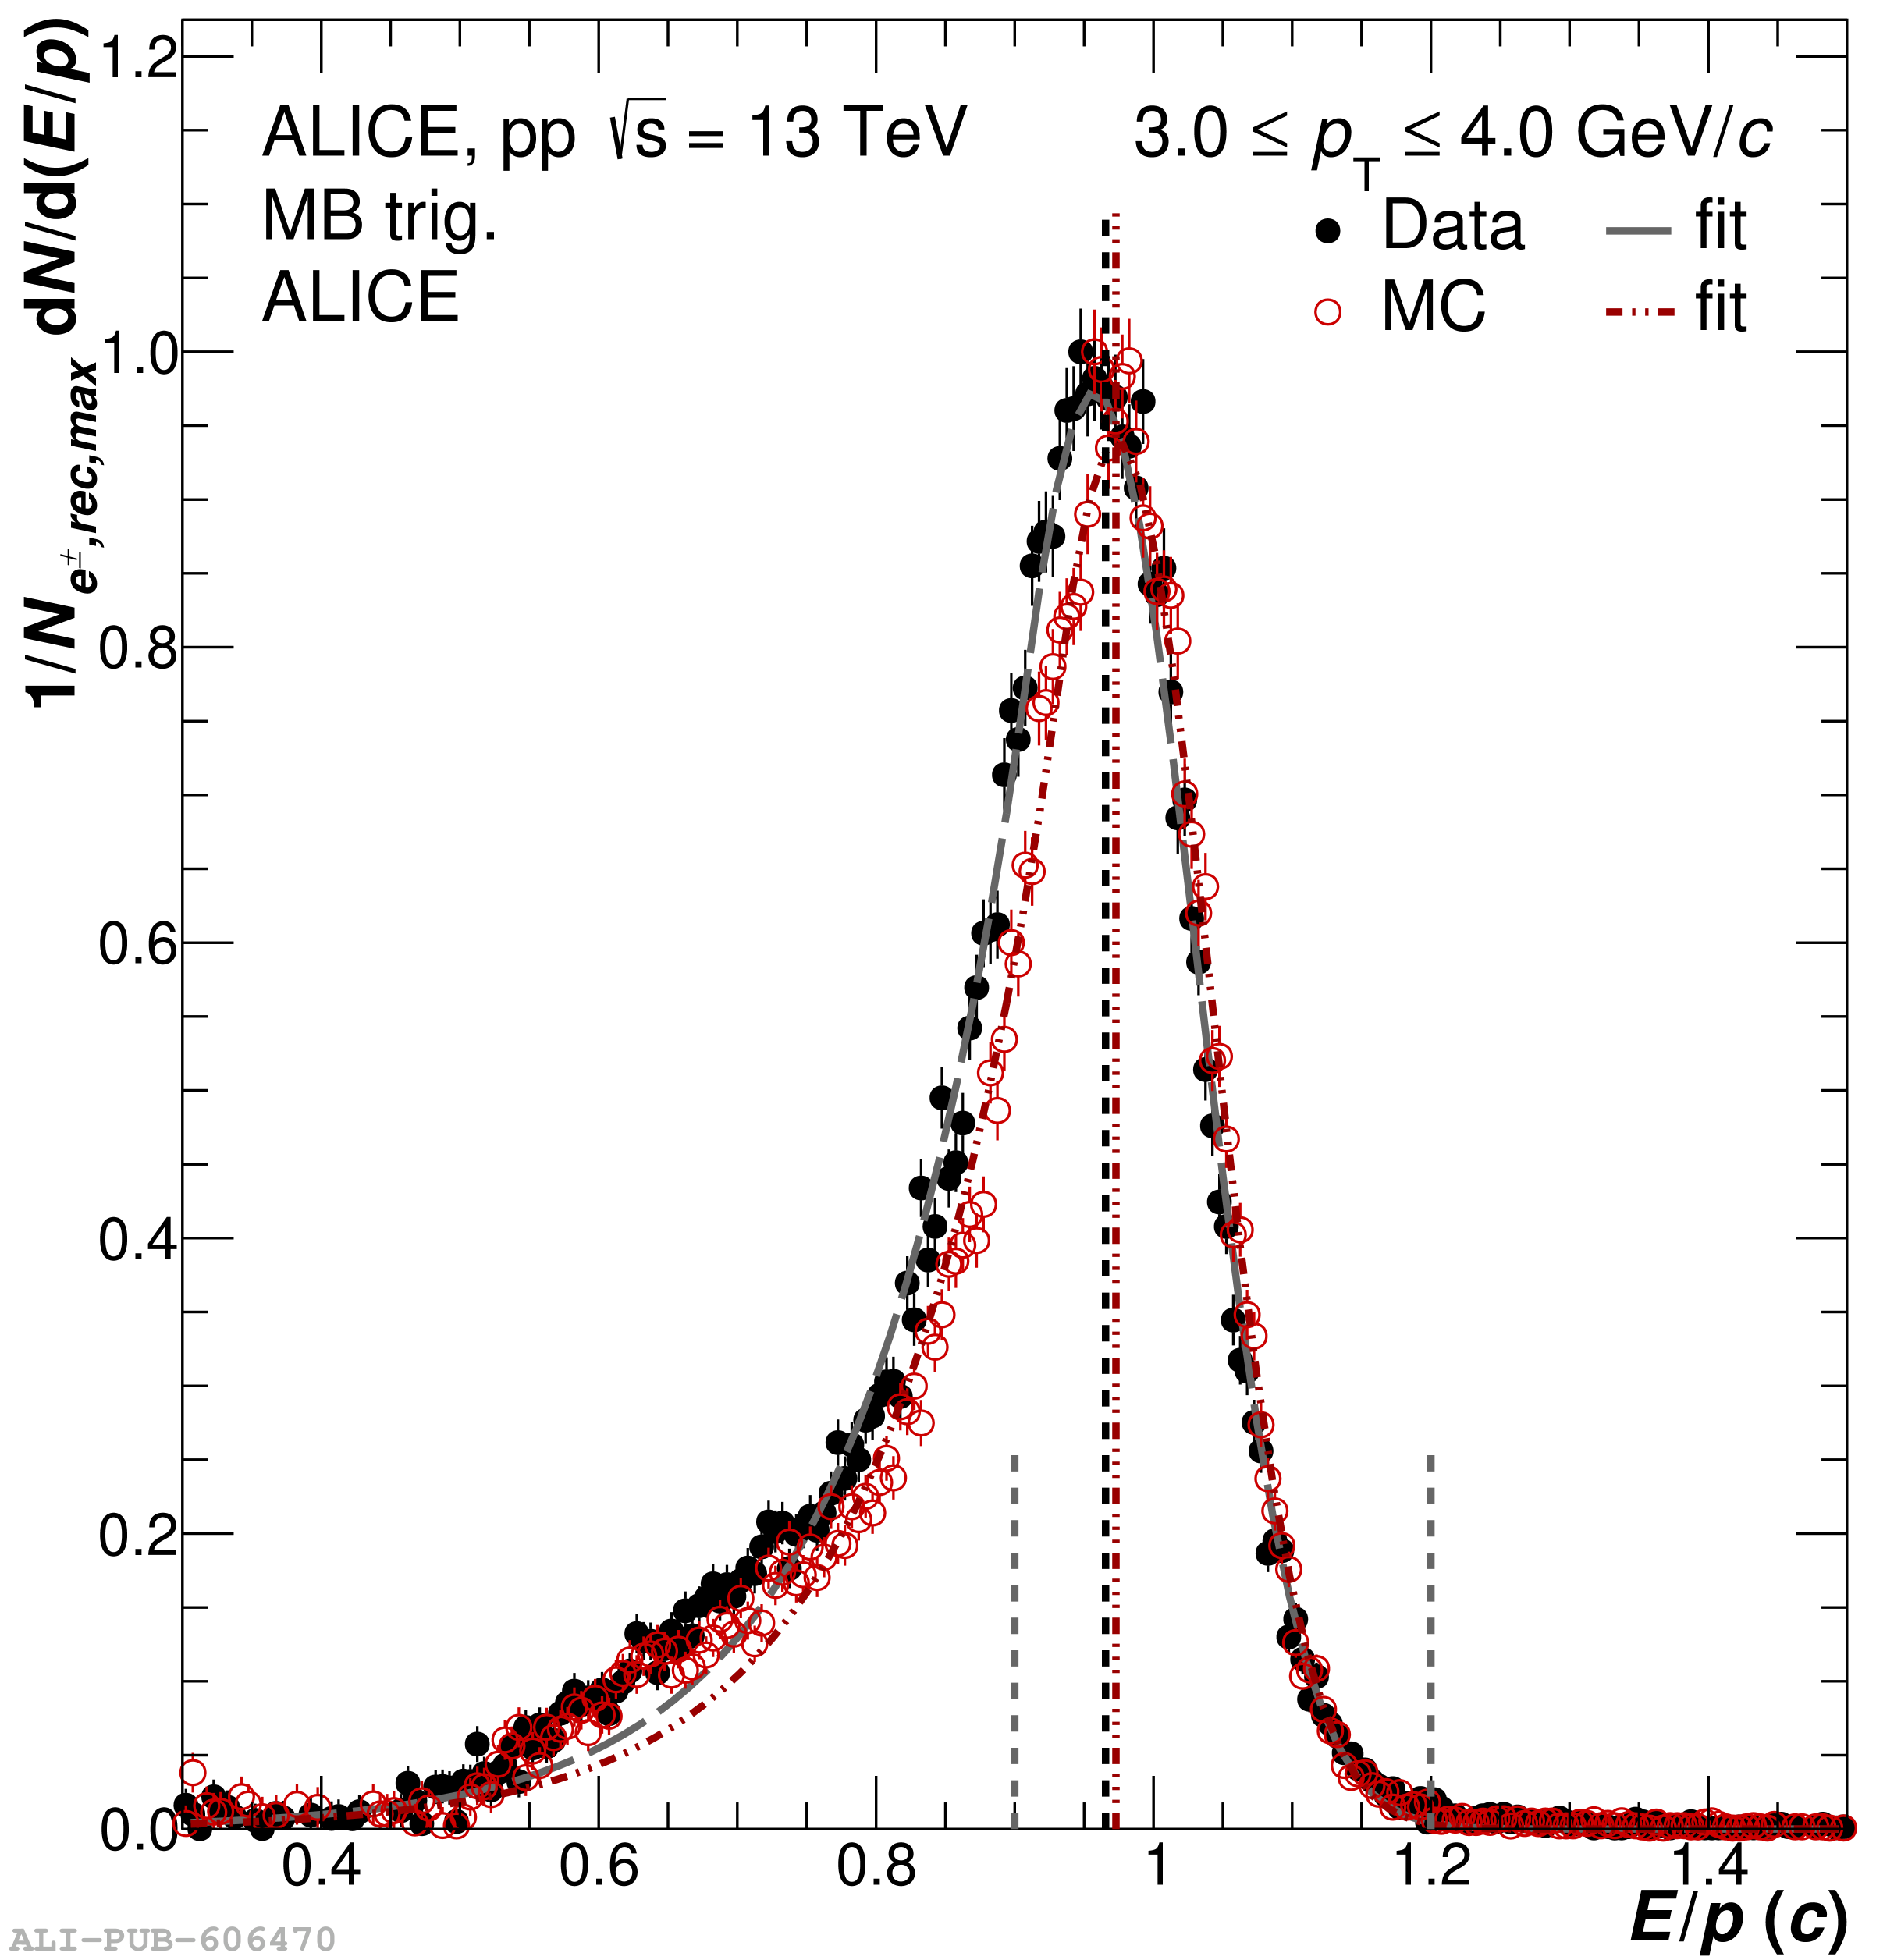 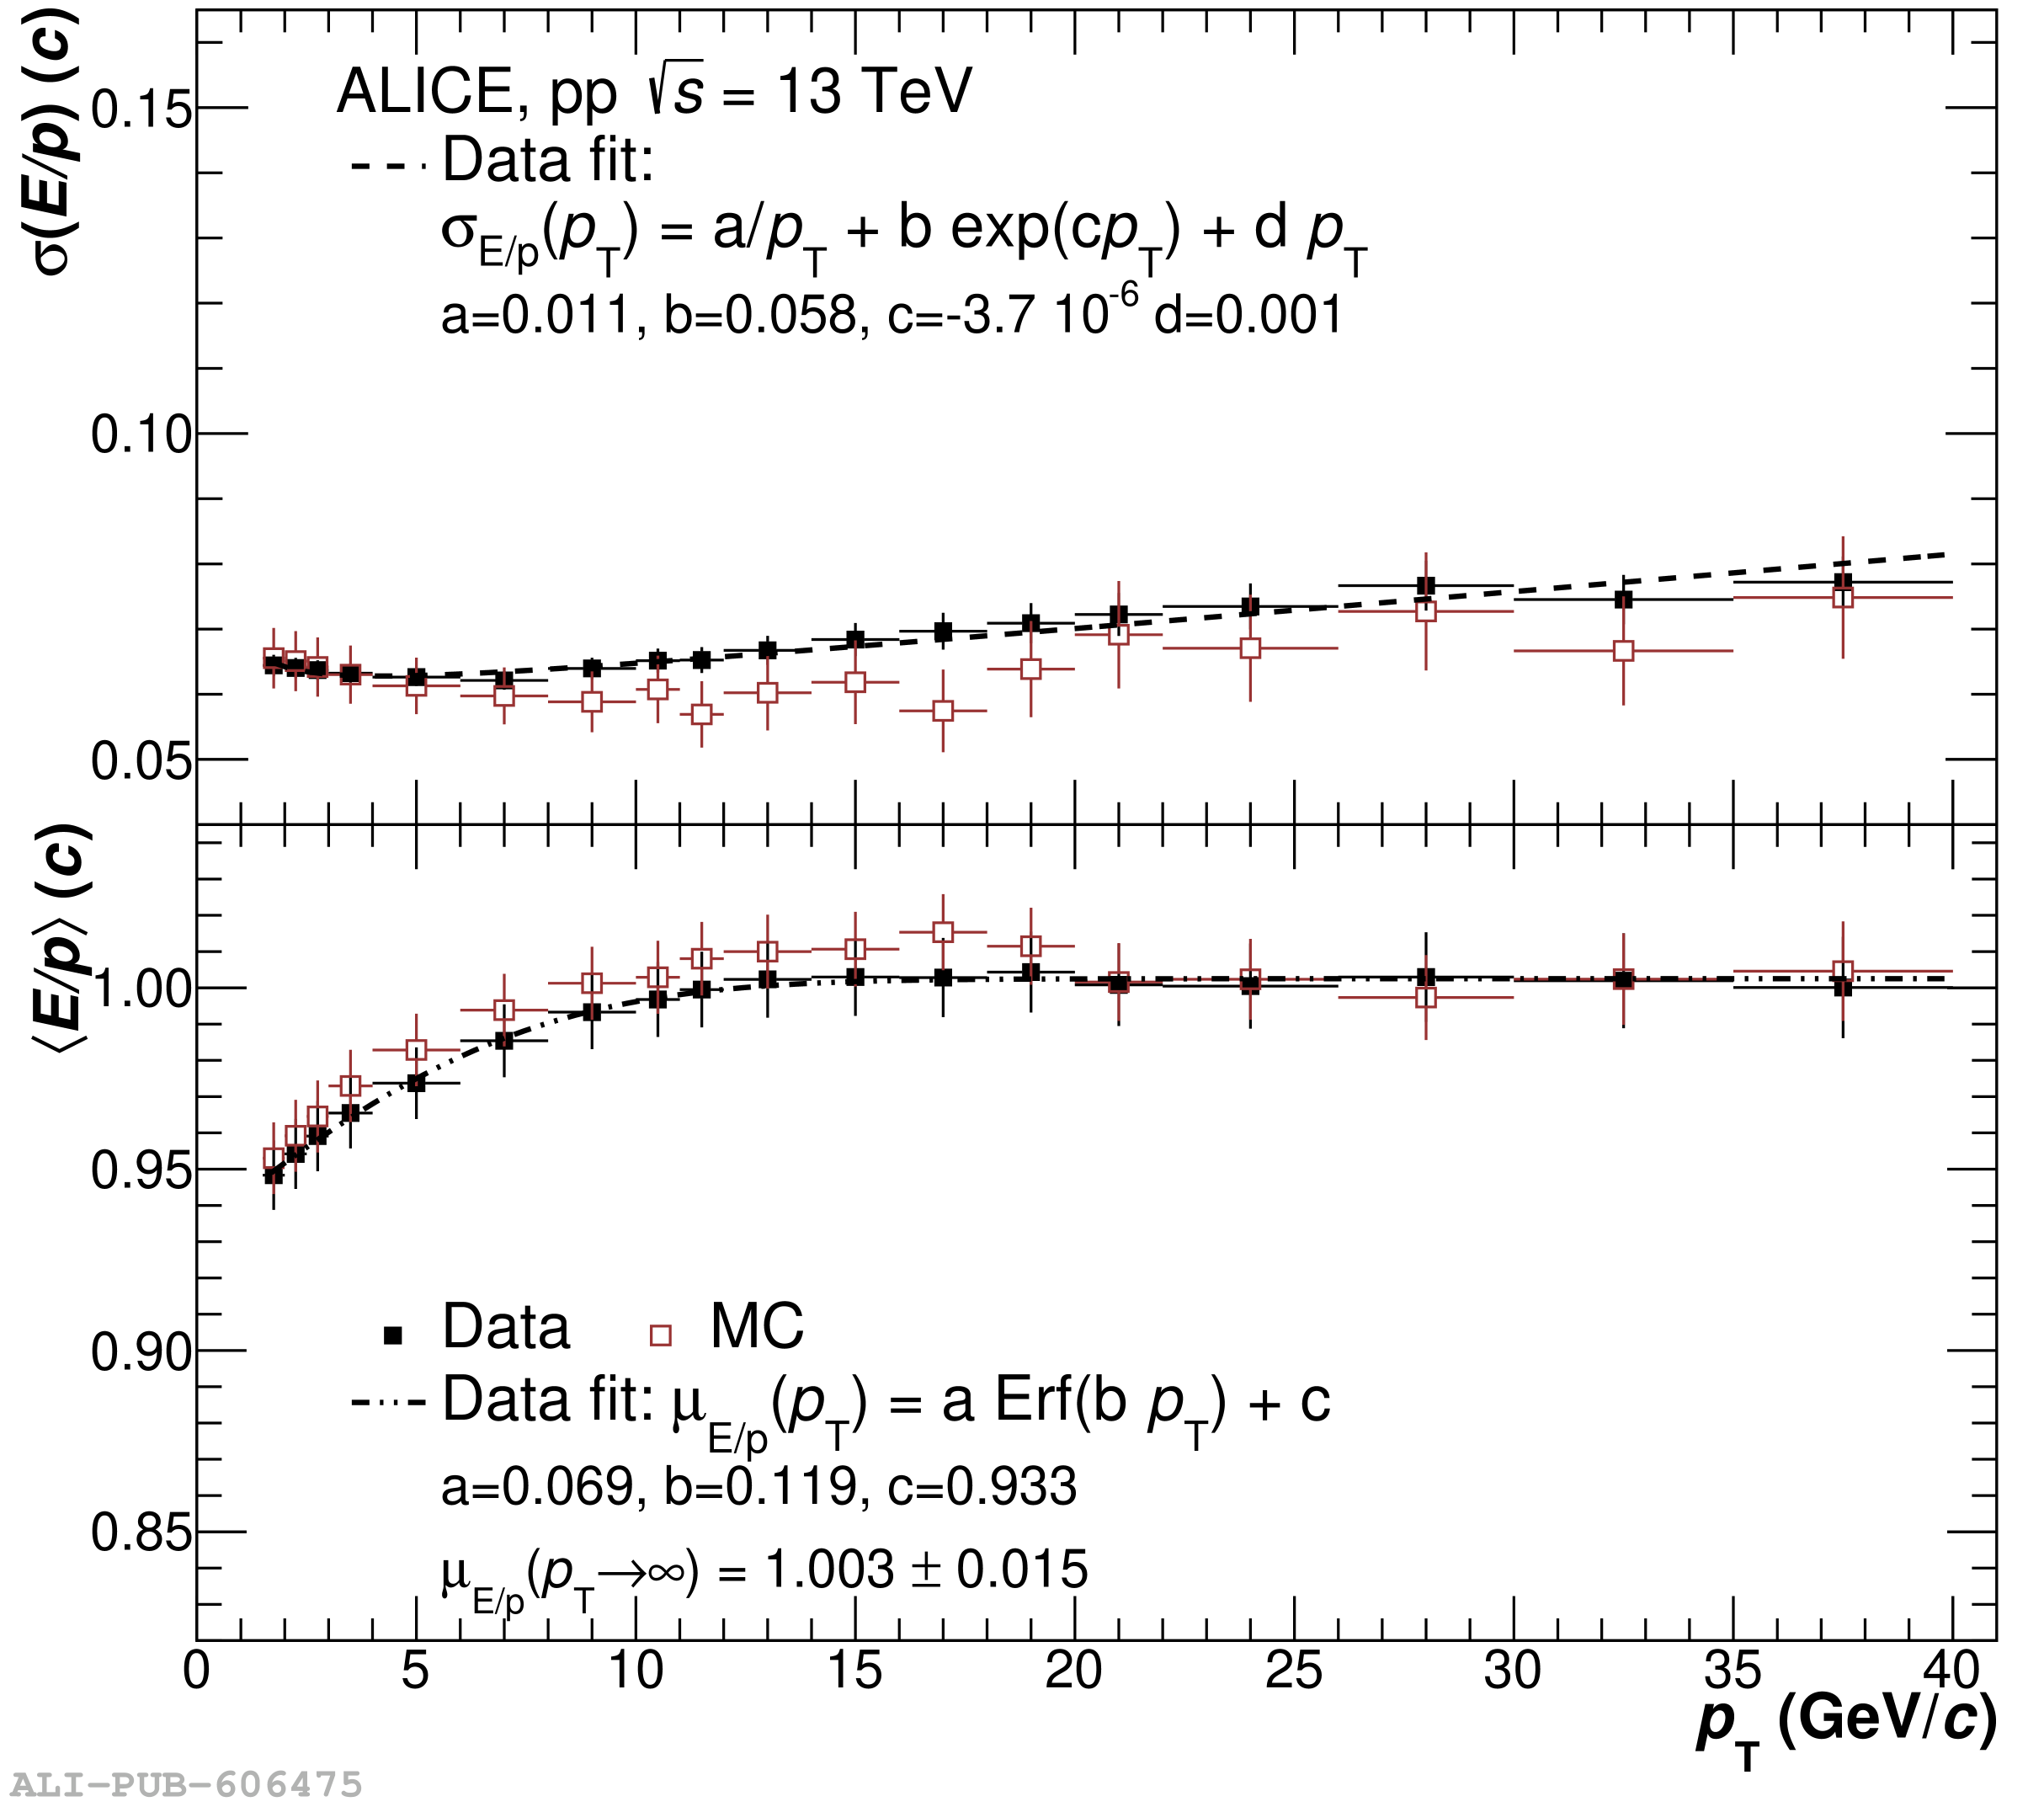 |