Illustration of the parameter-space of the photon $p_{\rm T}^{\rm iso}$ and $\sigma_{\rm long}^{2}$, used to estimate the background yield in the signal region ($\mathbb{A}$) from the observed yields in the three control regions ($\mathbb{B}$, $\mathbb{C}$, $\mathbb{D}$). The red regions indicate areas dominated by background and the blue regions by the photon signal. The color gradient indicates mixture of signal and background. | 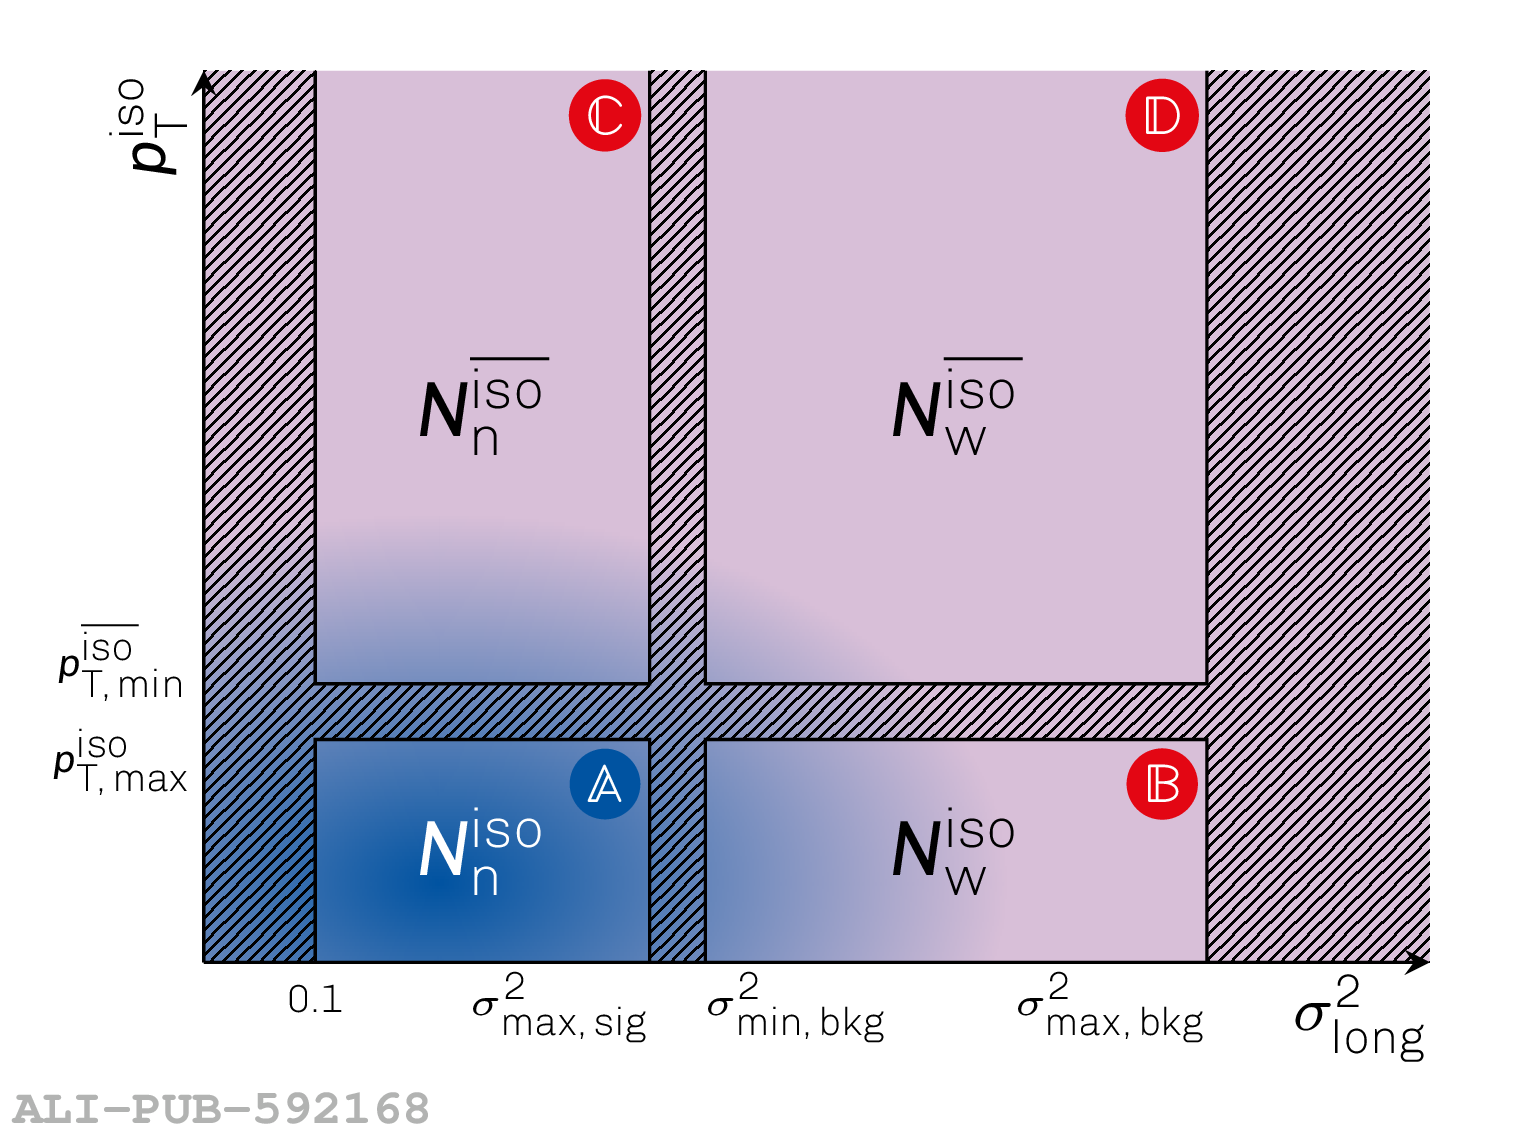 |