Left: Fraction of clusters with 2 or more cells for data and MC for clusters selected with PCM-EMC tagging and EMC tagging. Right: Ratio of fully corrected $\pi^{0}$ meson spectra obtained with PCM-EMC (top) and EMC (bottom) with $N_{\rm{cell}} \geq 2$ to the $N_{\rm{cell}} \geq 1$ with and without applying the cluster-size correction. | 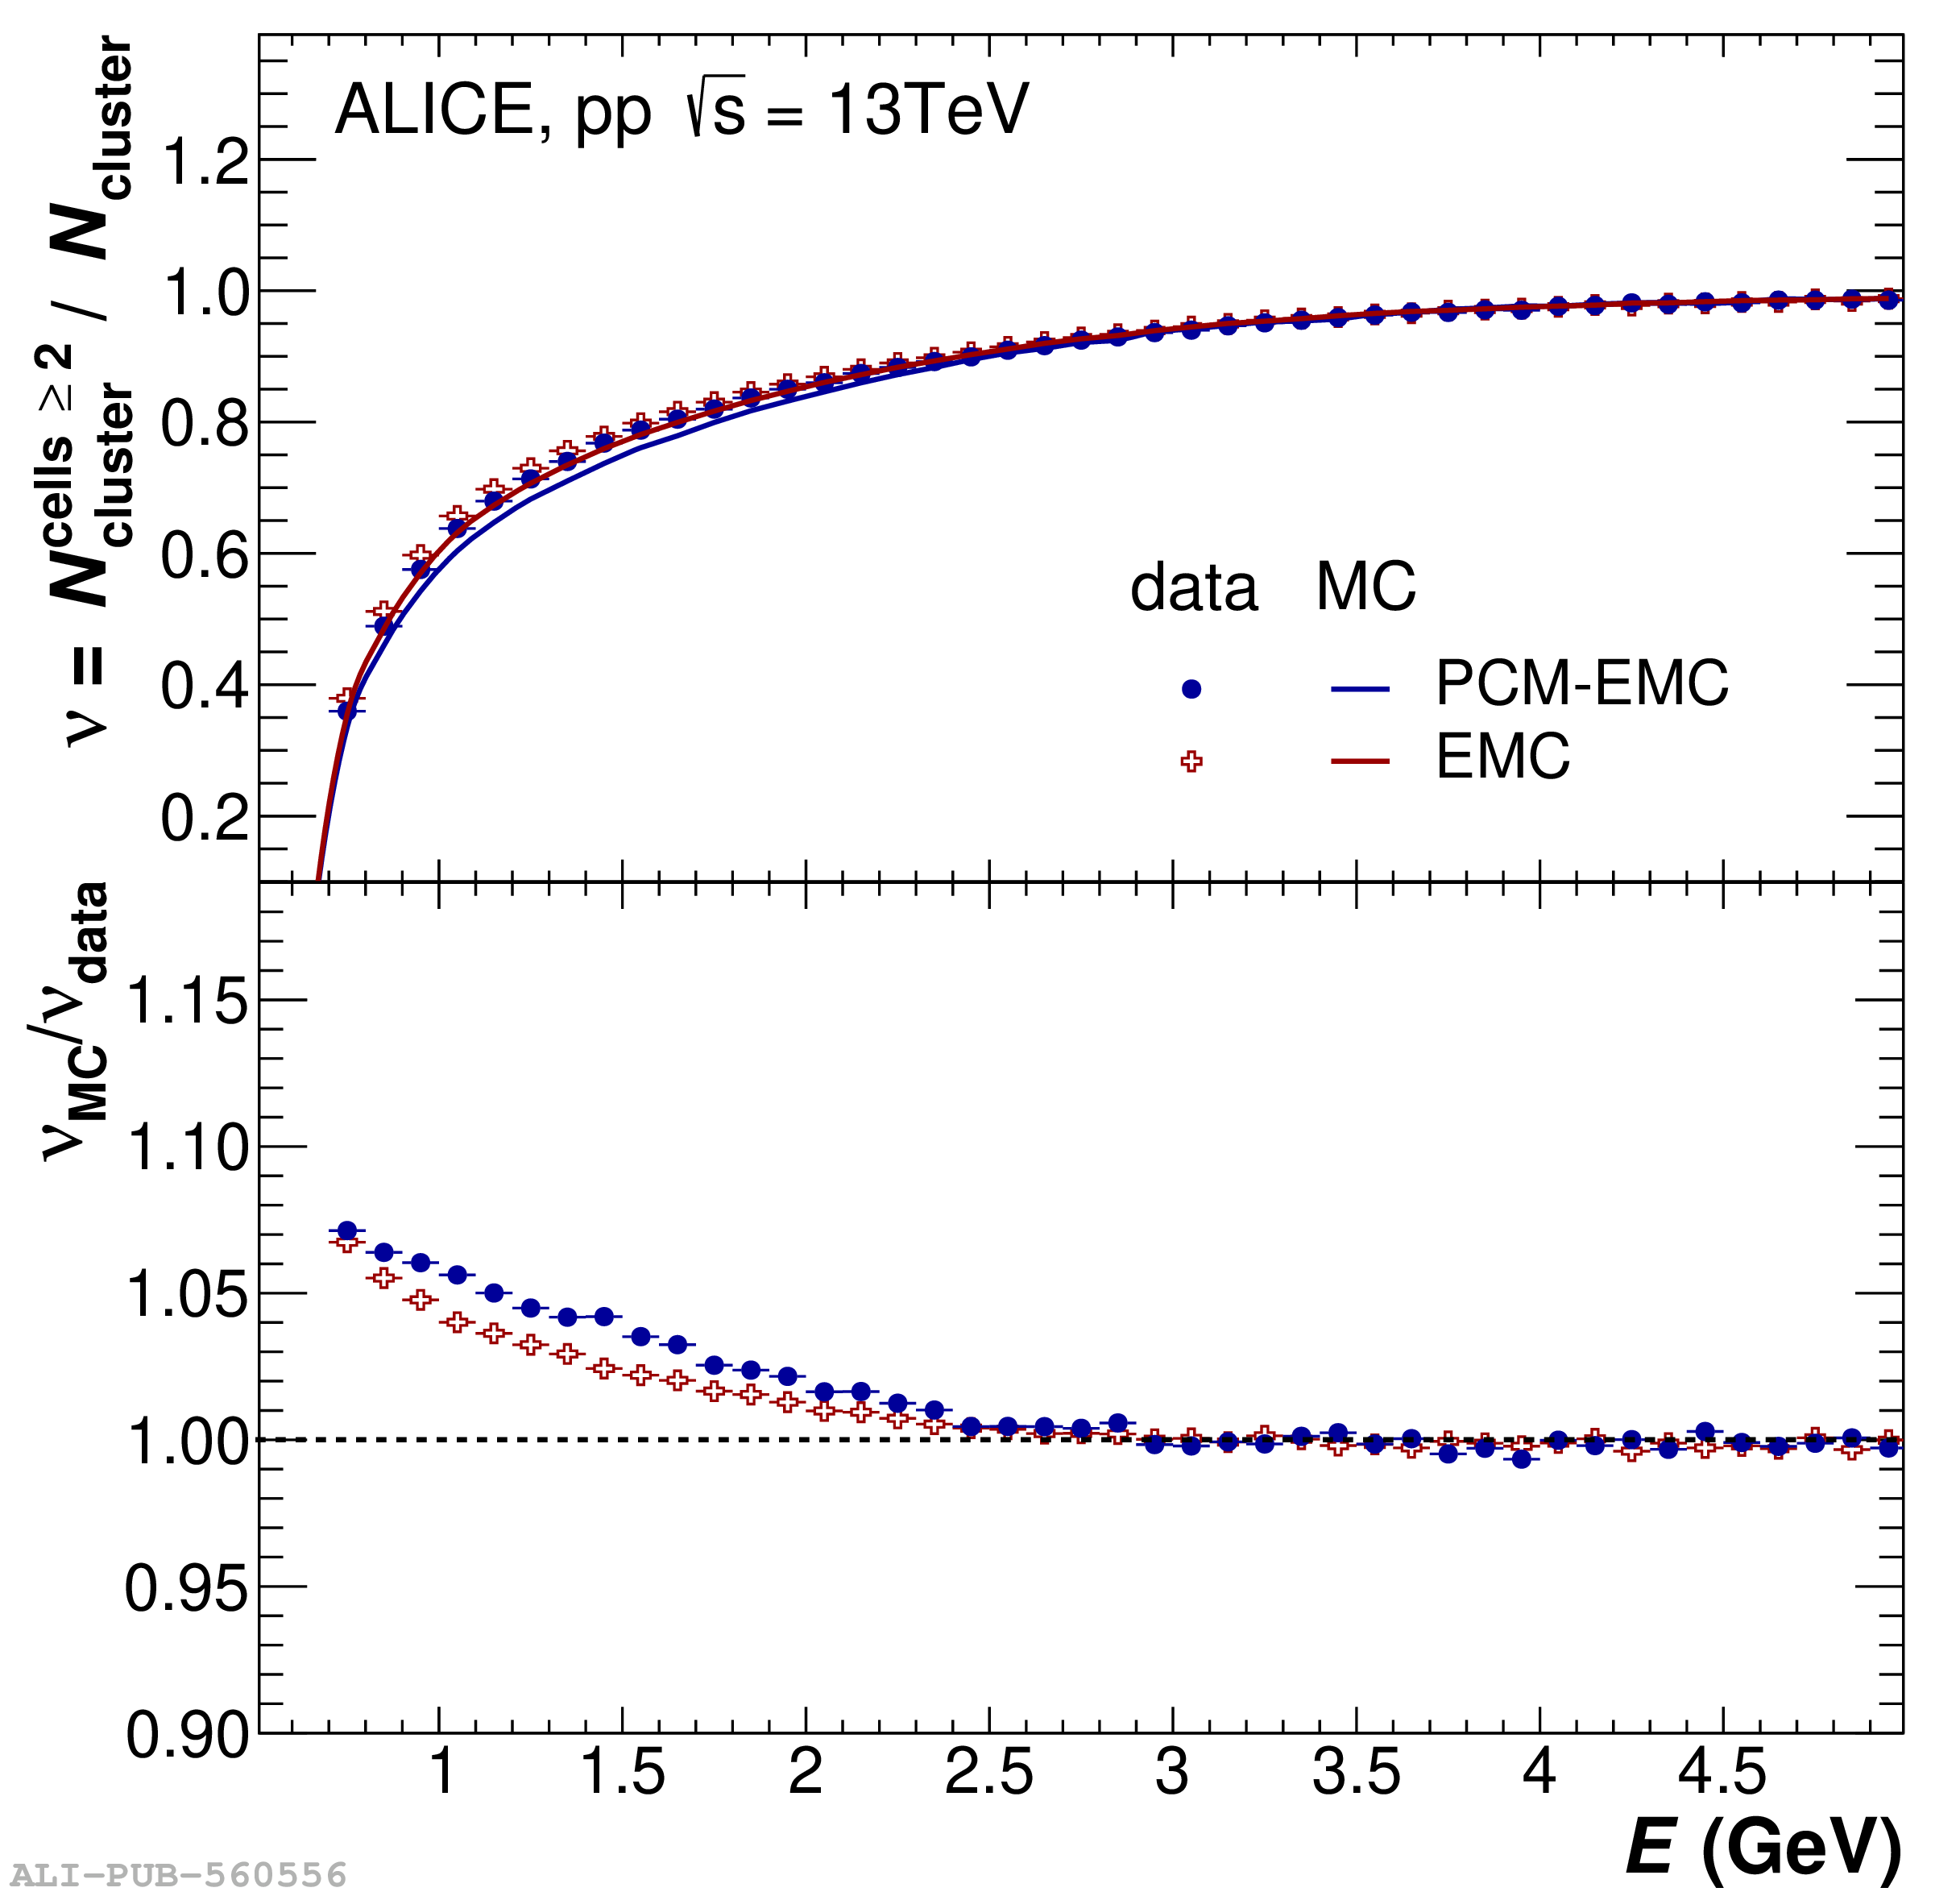 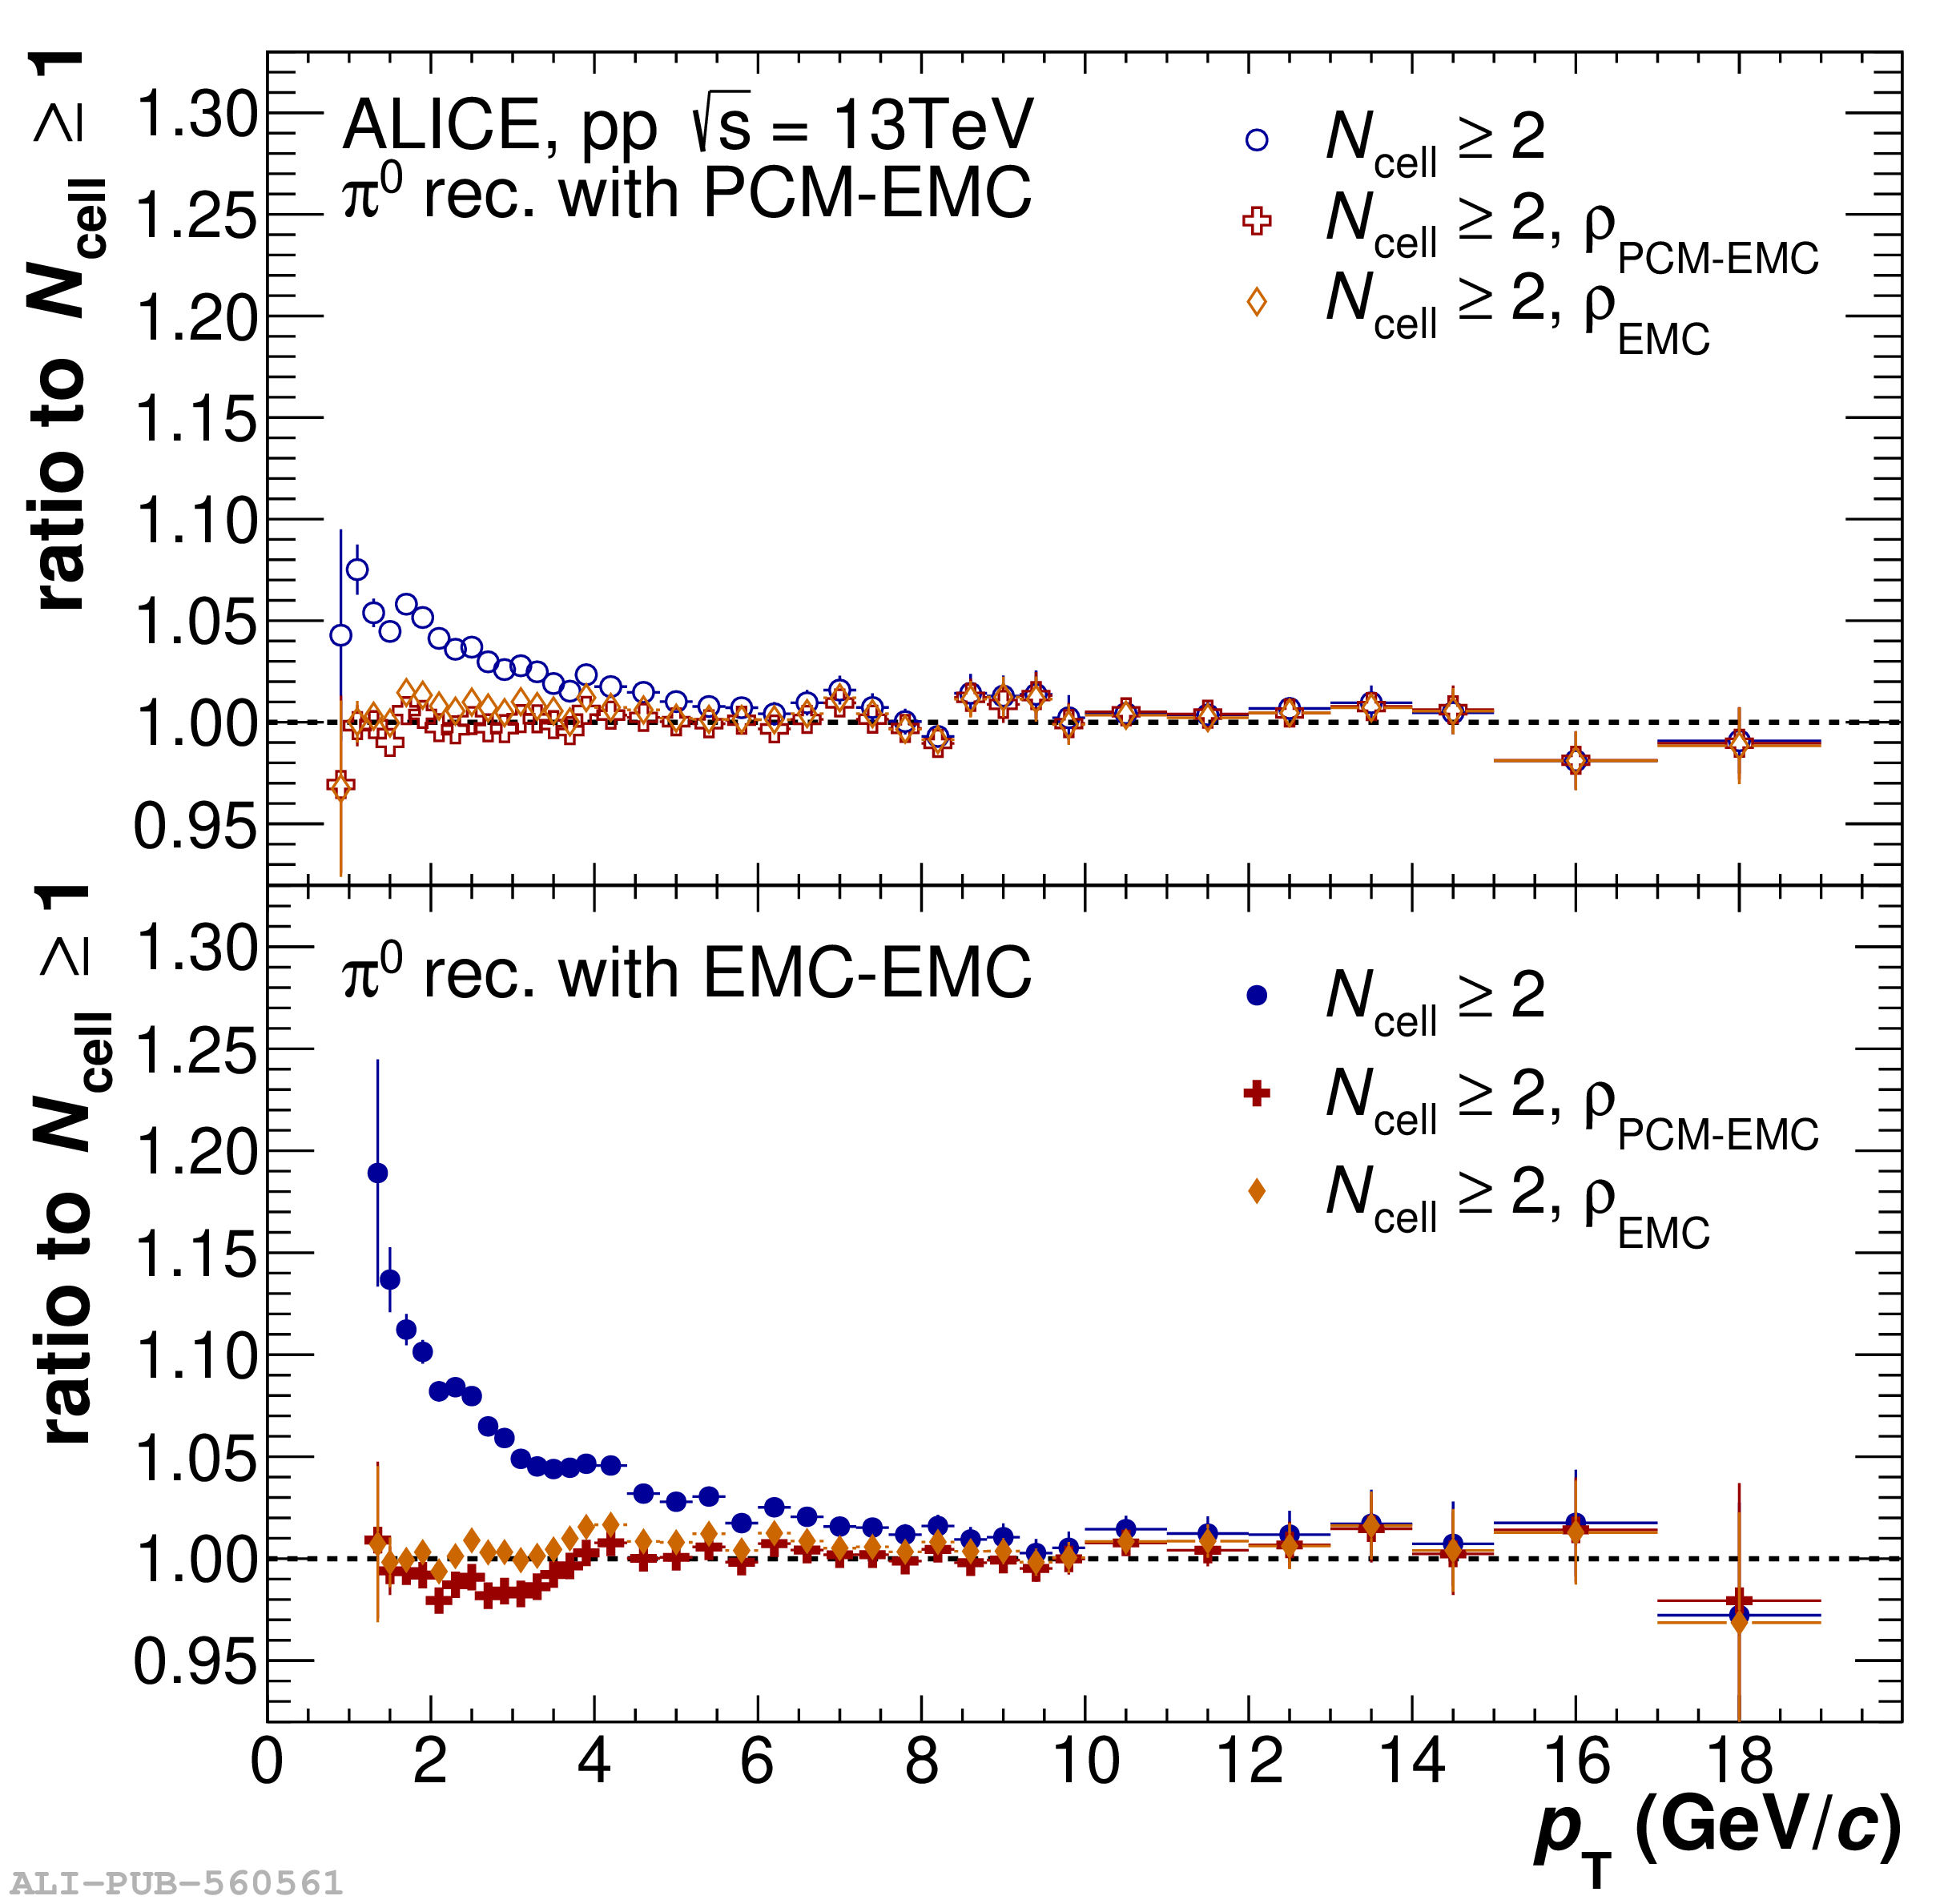 |