Left: Width of the distribution of $\Delta \mu_i$ (see text) as a function of the number of $\pi^{0}$ mesons in sample $S2$, for SMs 0$-$9 (blue, green, cyan) and SMs 10$-$17 (red, orange, yellow), for various $\sigma_{\pi^{0}}$ cell selection: 9.6 $< \sigma_{\pi^{0}} < $ 11.0 MeV/$c^2$ (circles), 9.0 $< \sigma_{\pi^{0}} < $ 12.0 MeV/$c^2$ (diamonds) and none (stars). Right: Statistical uncertainty on the $\pi^{0}$ meson mass as a function of the number of $\pi^{0}$ mesons collected in the cell, for SMs 0$-$9 with the tightest (blue) and without (green) selection on $\sigma_{\pi^{0}}$ as well as for SMs 10$-$17 with the tightest (red) and without (yellow) selection on $\sigma_{\pi^{0}}$. | 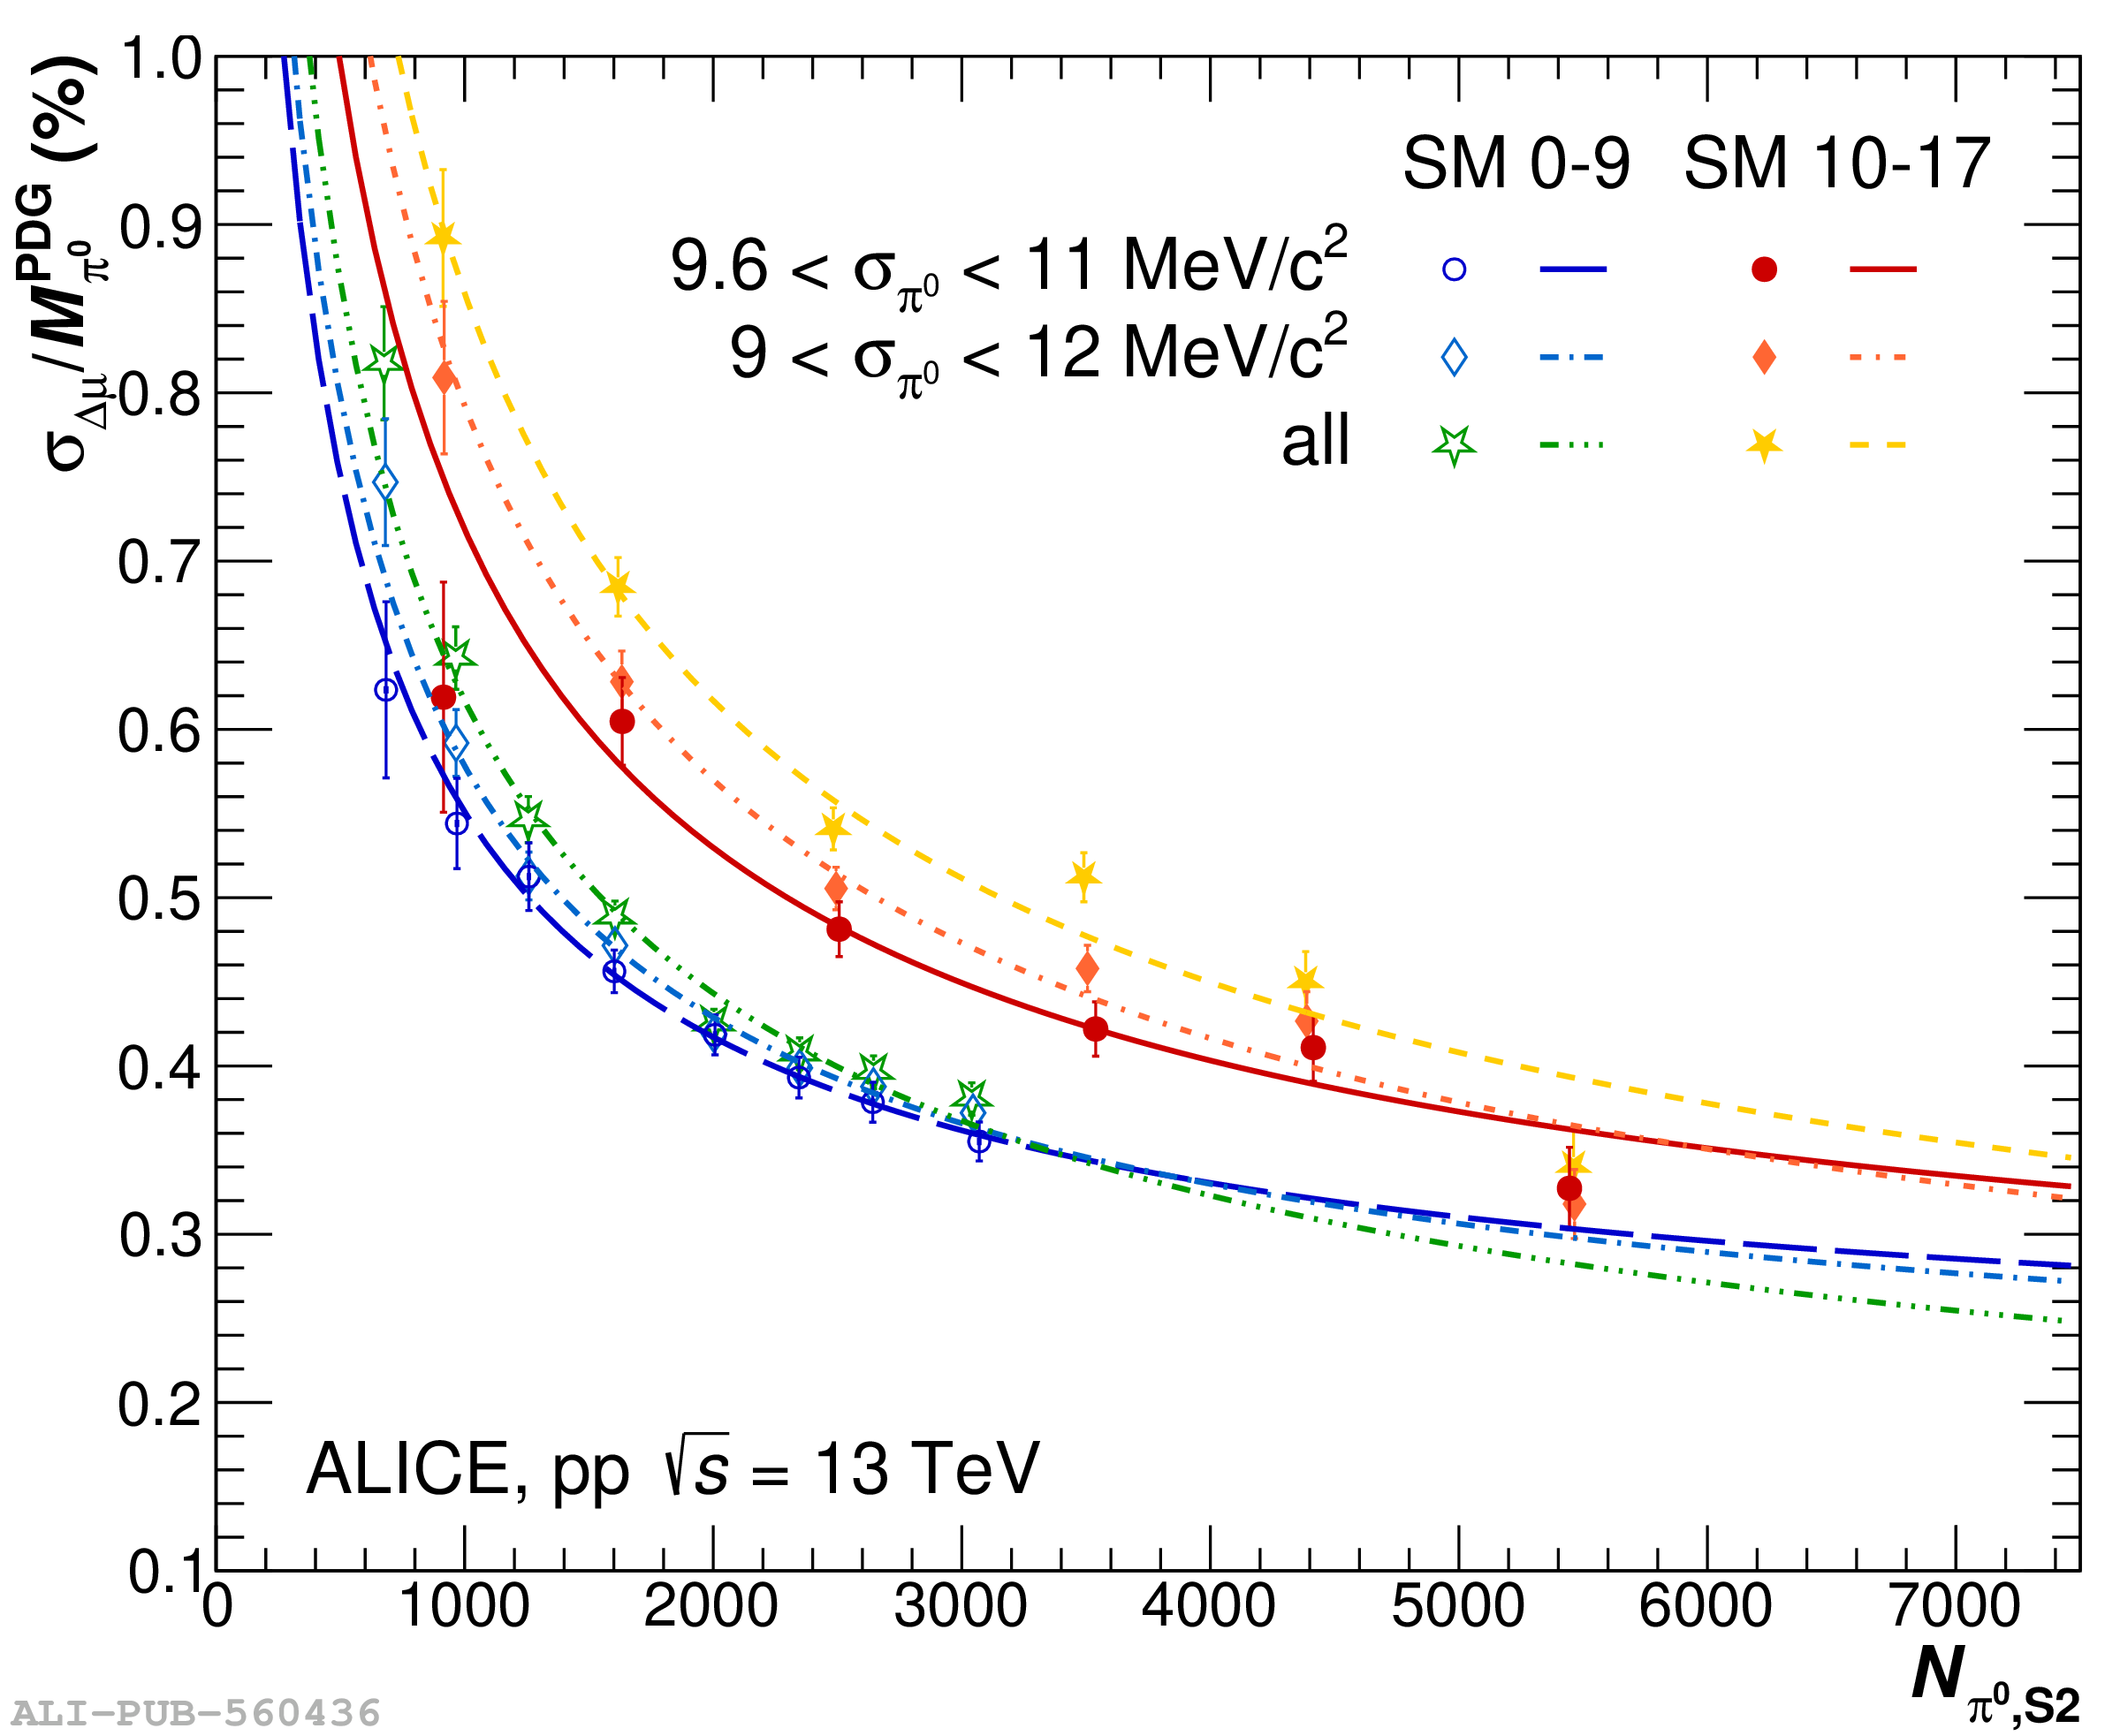 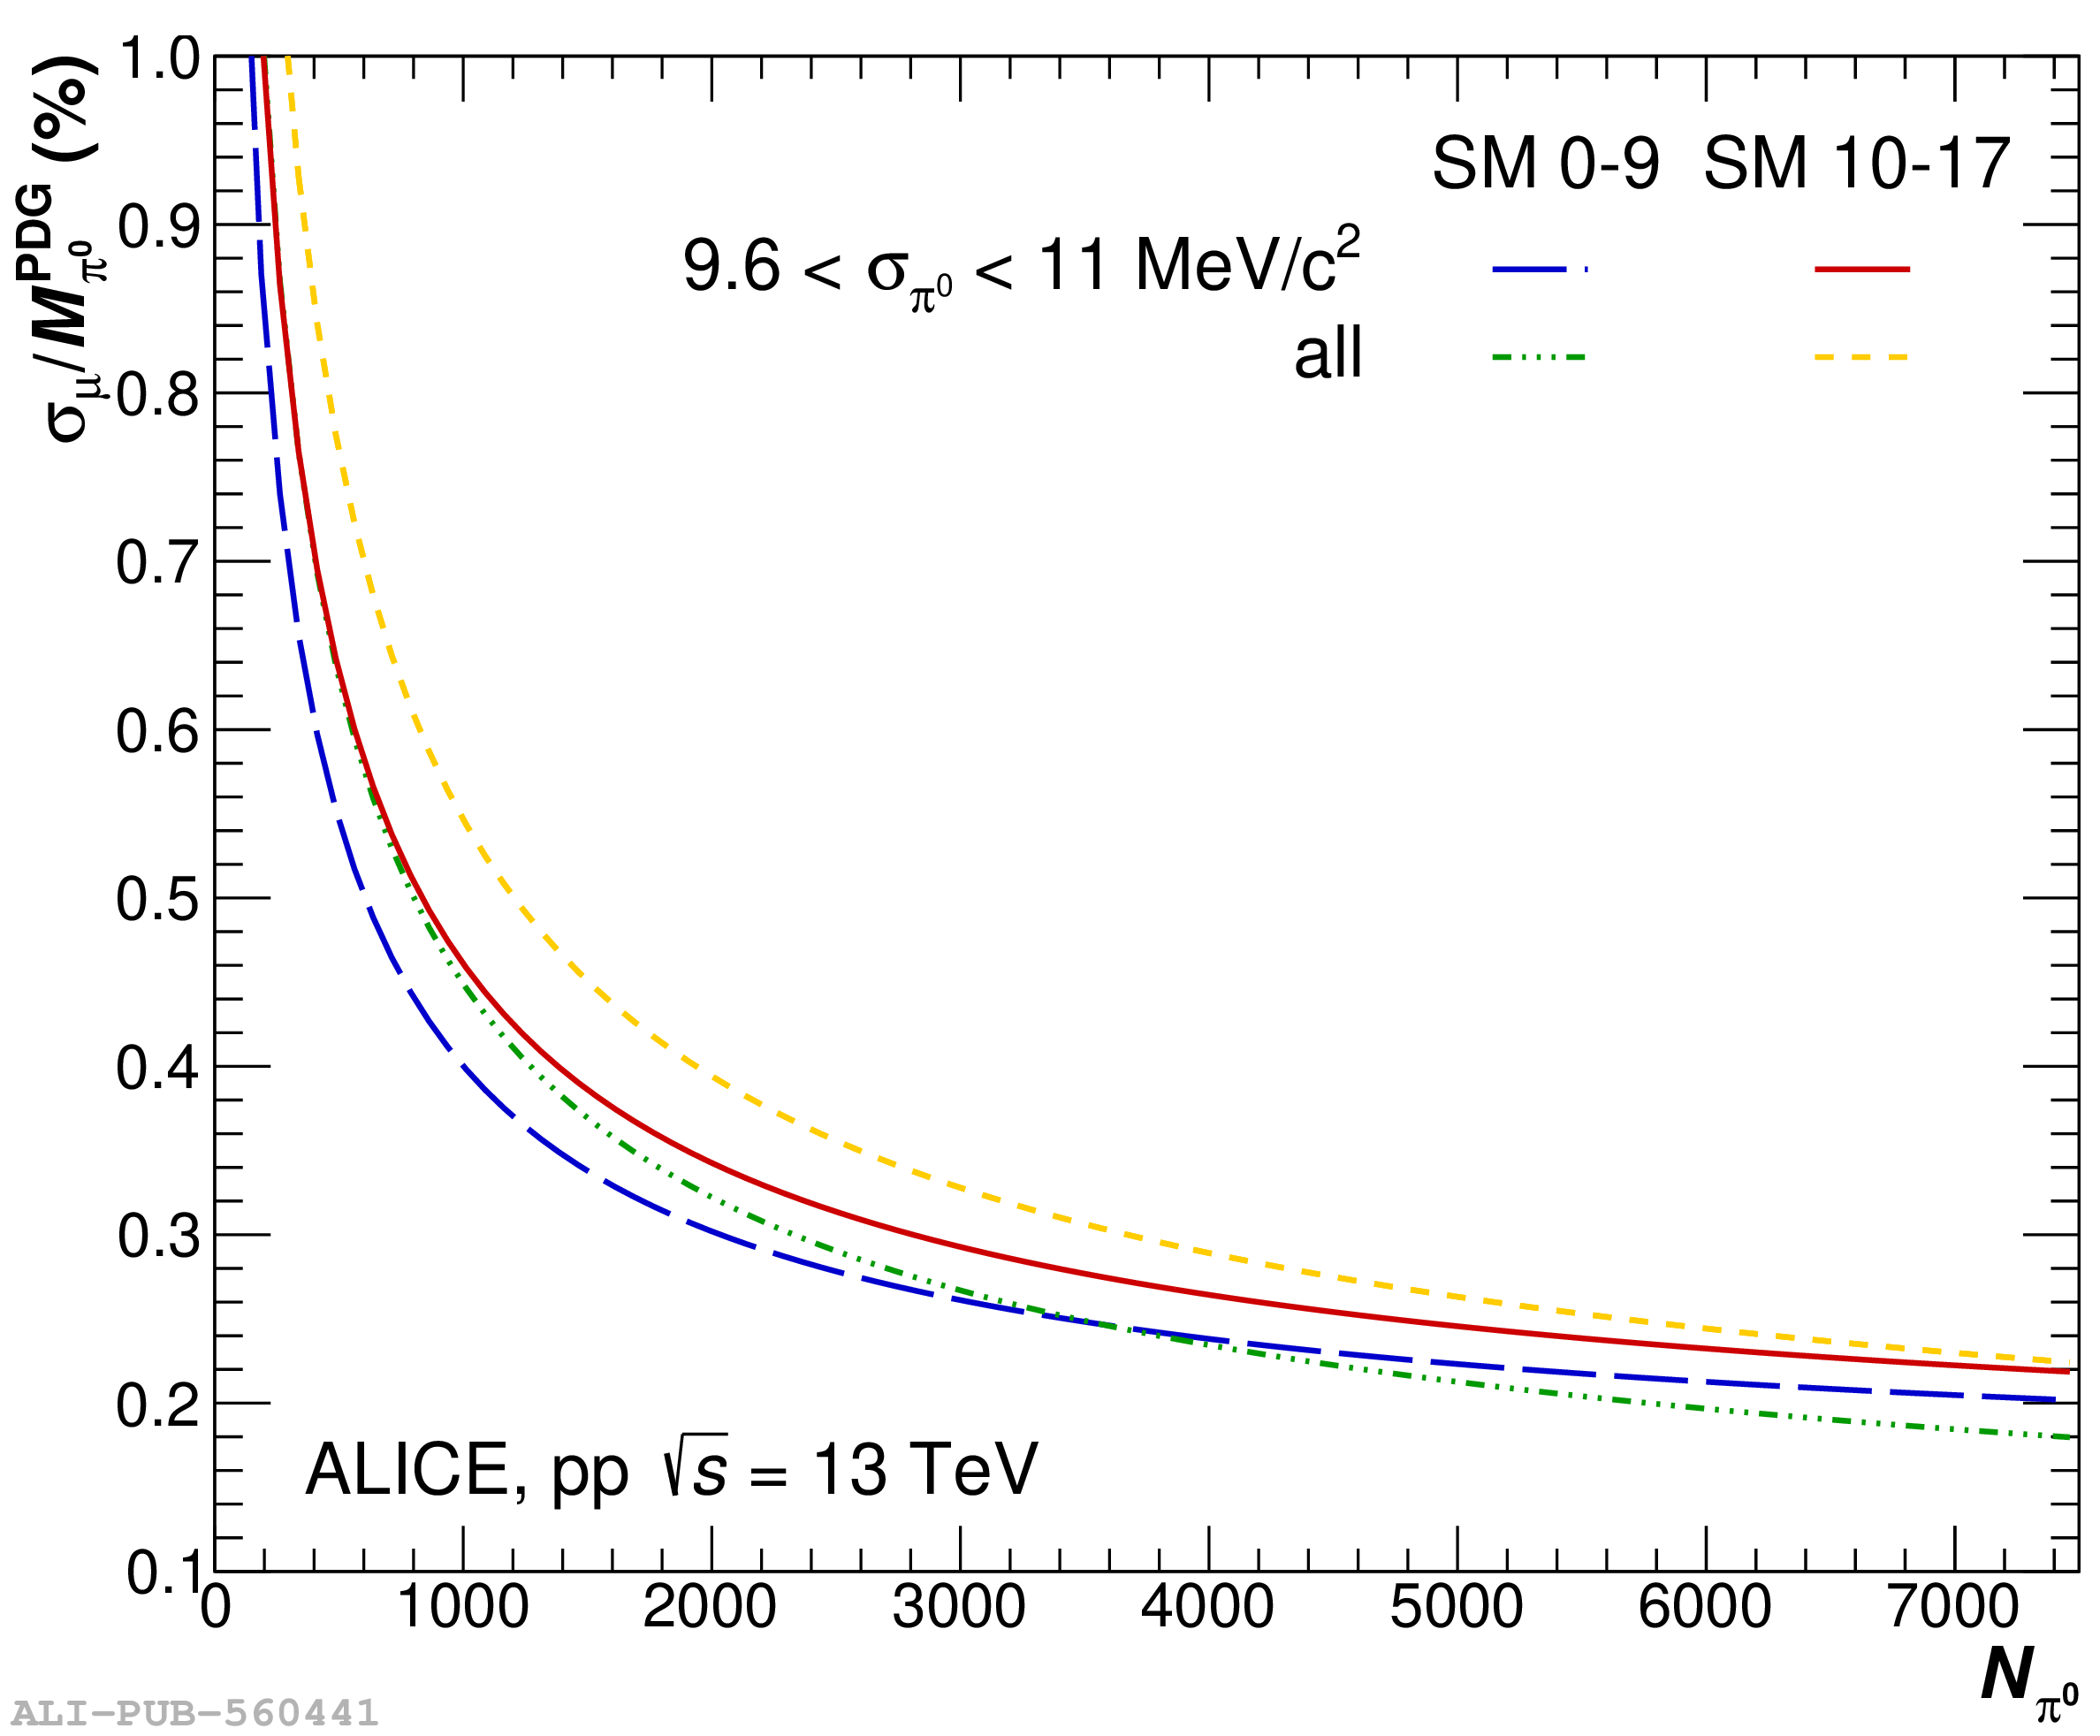 |