Raw distribution of the invariant mass of cluster pairs in EMCal (left) and DCal (right) for one run of 2018 data taking obtained during the QA process. The red line corresponds to a fit to the invariant mass distribution with a Gaussian function for the $\pi^{0}$ signal and a second-order polynomial for the background. The fit parameters are used to monitor the performance of the reconstruction and of the detectors. In the displayed run, 819535 events were collected. | 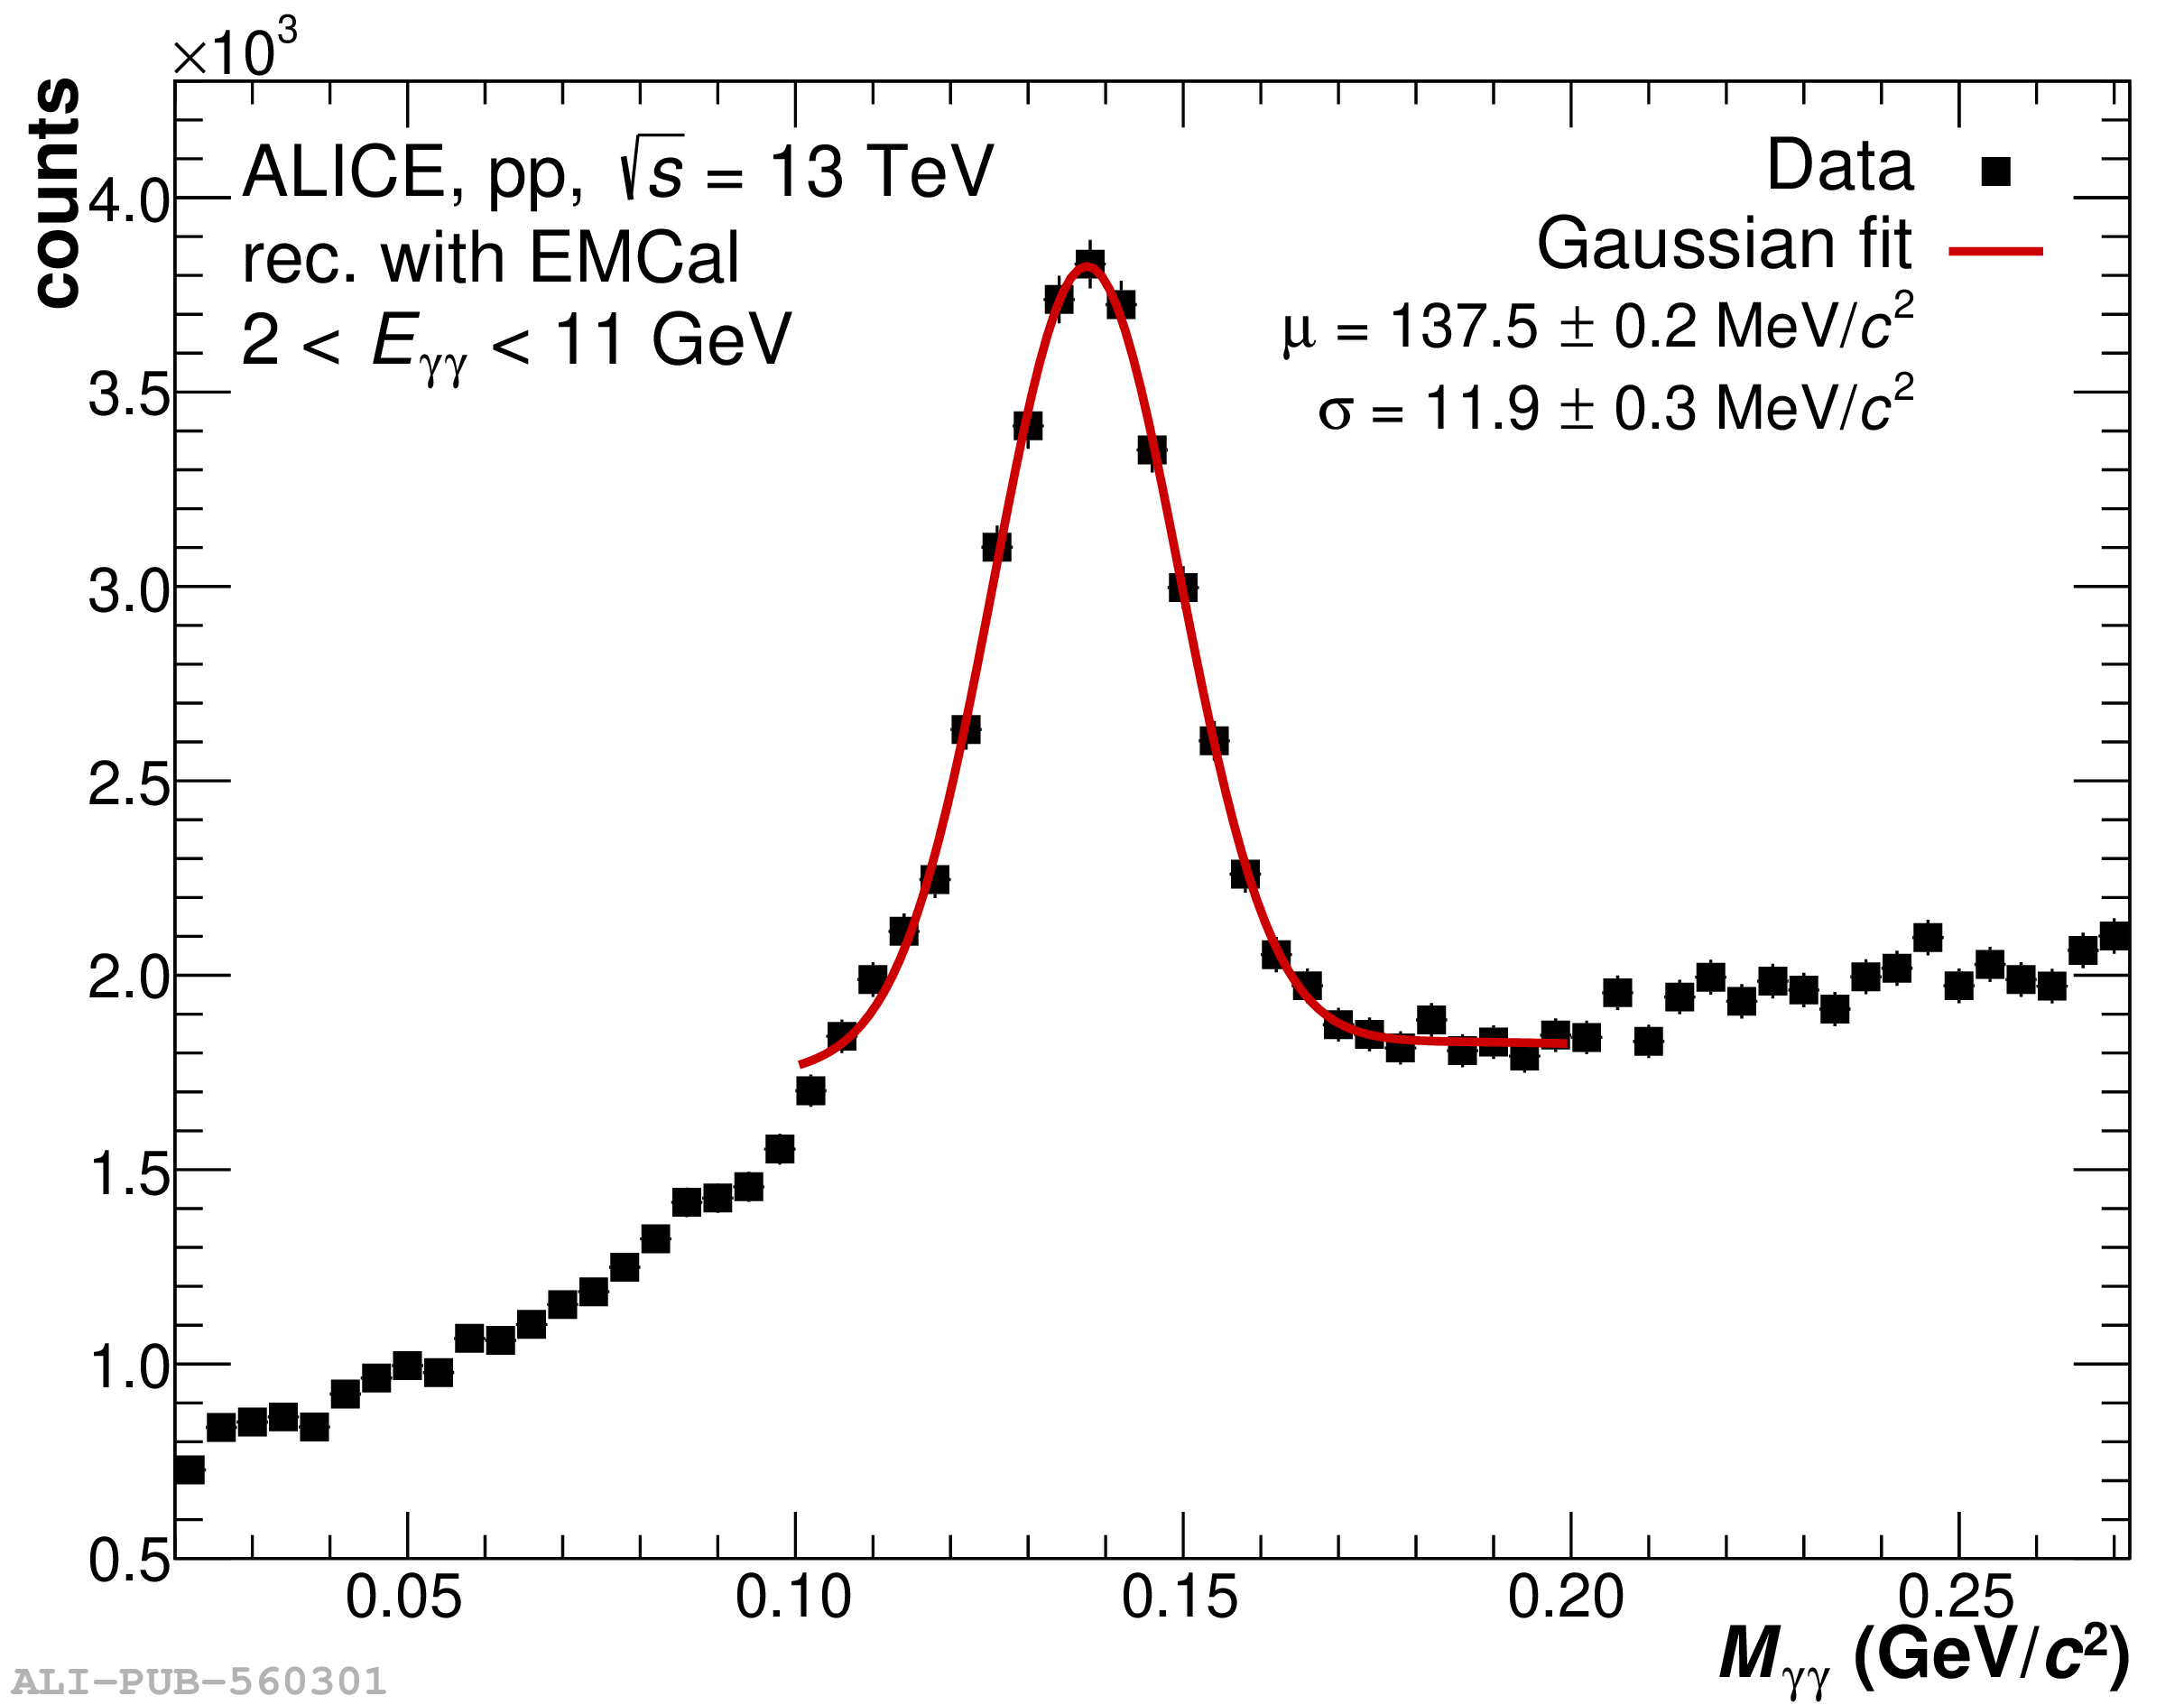 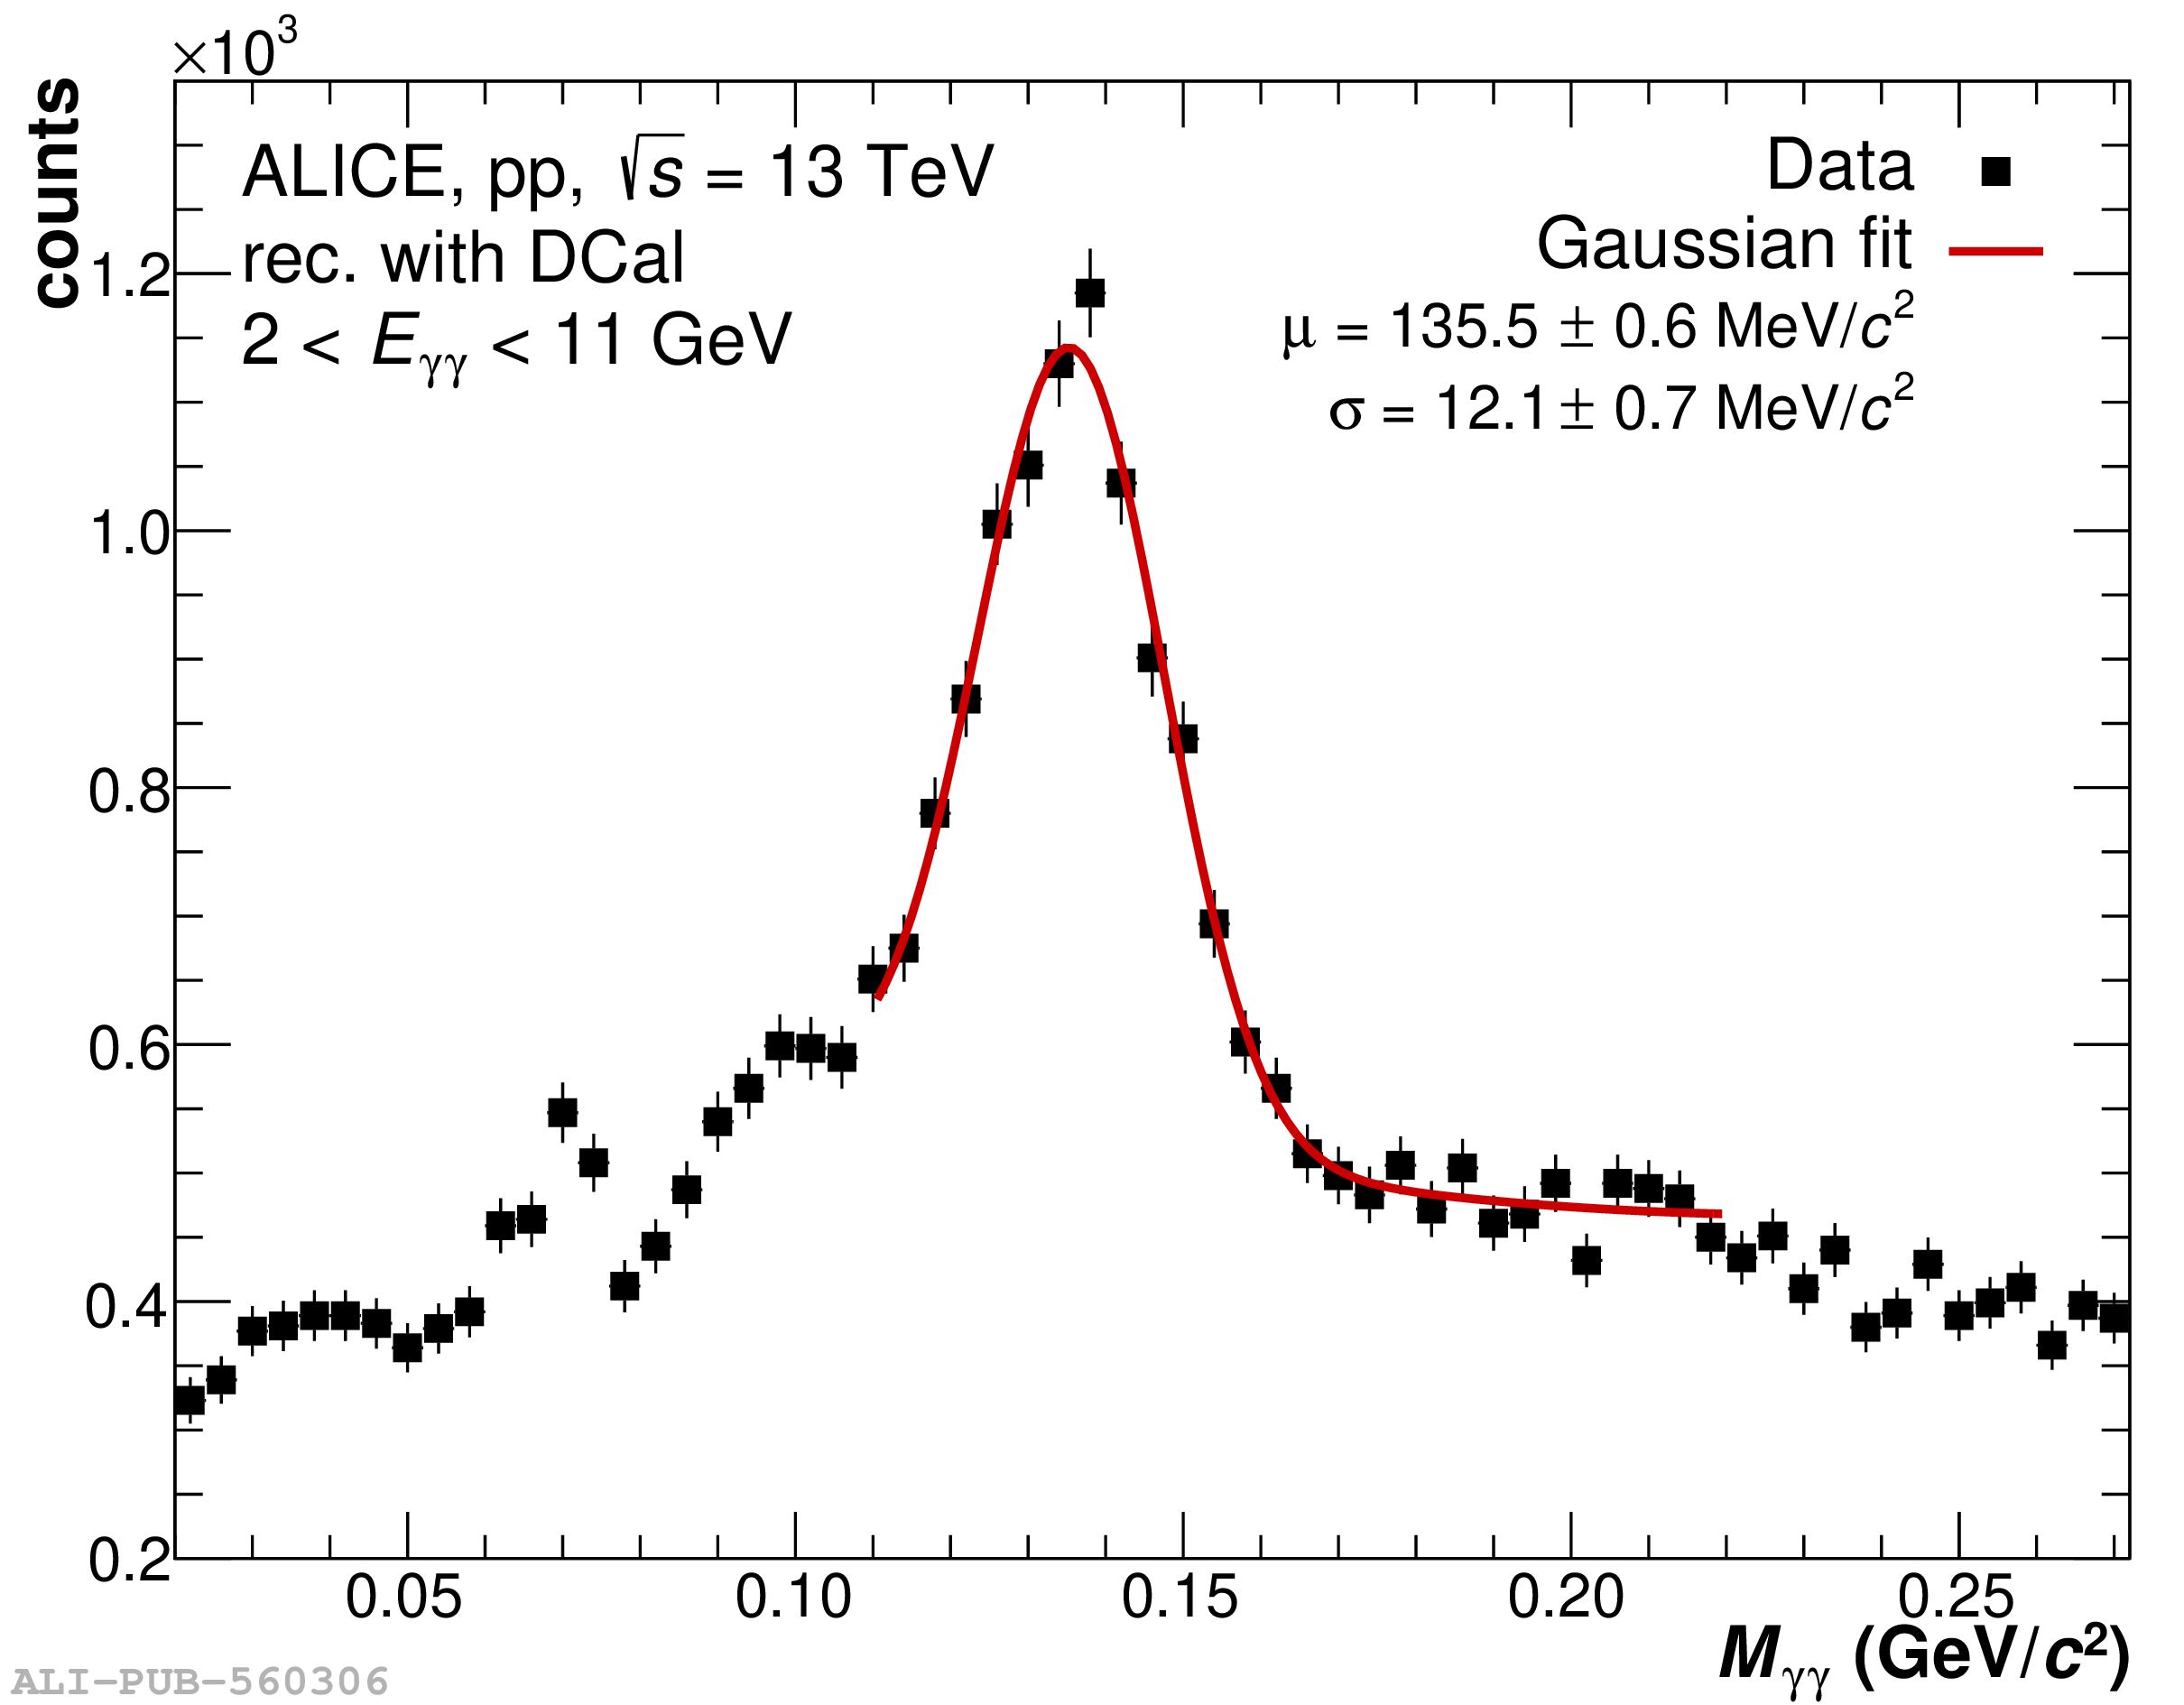 |