Purity of the isolated-photon sample as a function of $p_{\rm T}^{\gamma}$ calculated using Eq. (8). The statistical and systematic uncertainties have been evaluated as discussed in Sect. 4. The red and blue lines are the results of a fit to the measured purity using a two-sigmoid-function described by Eq. (11) for two different transverse momentum intervals. | 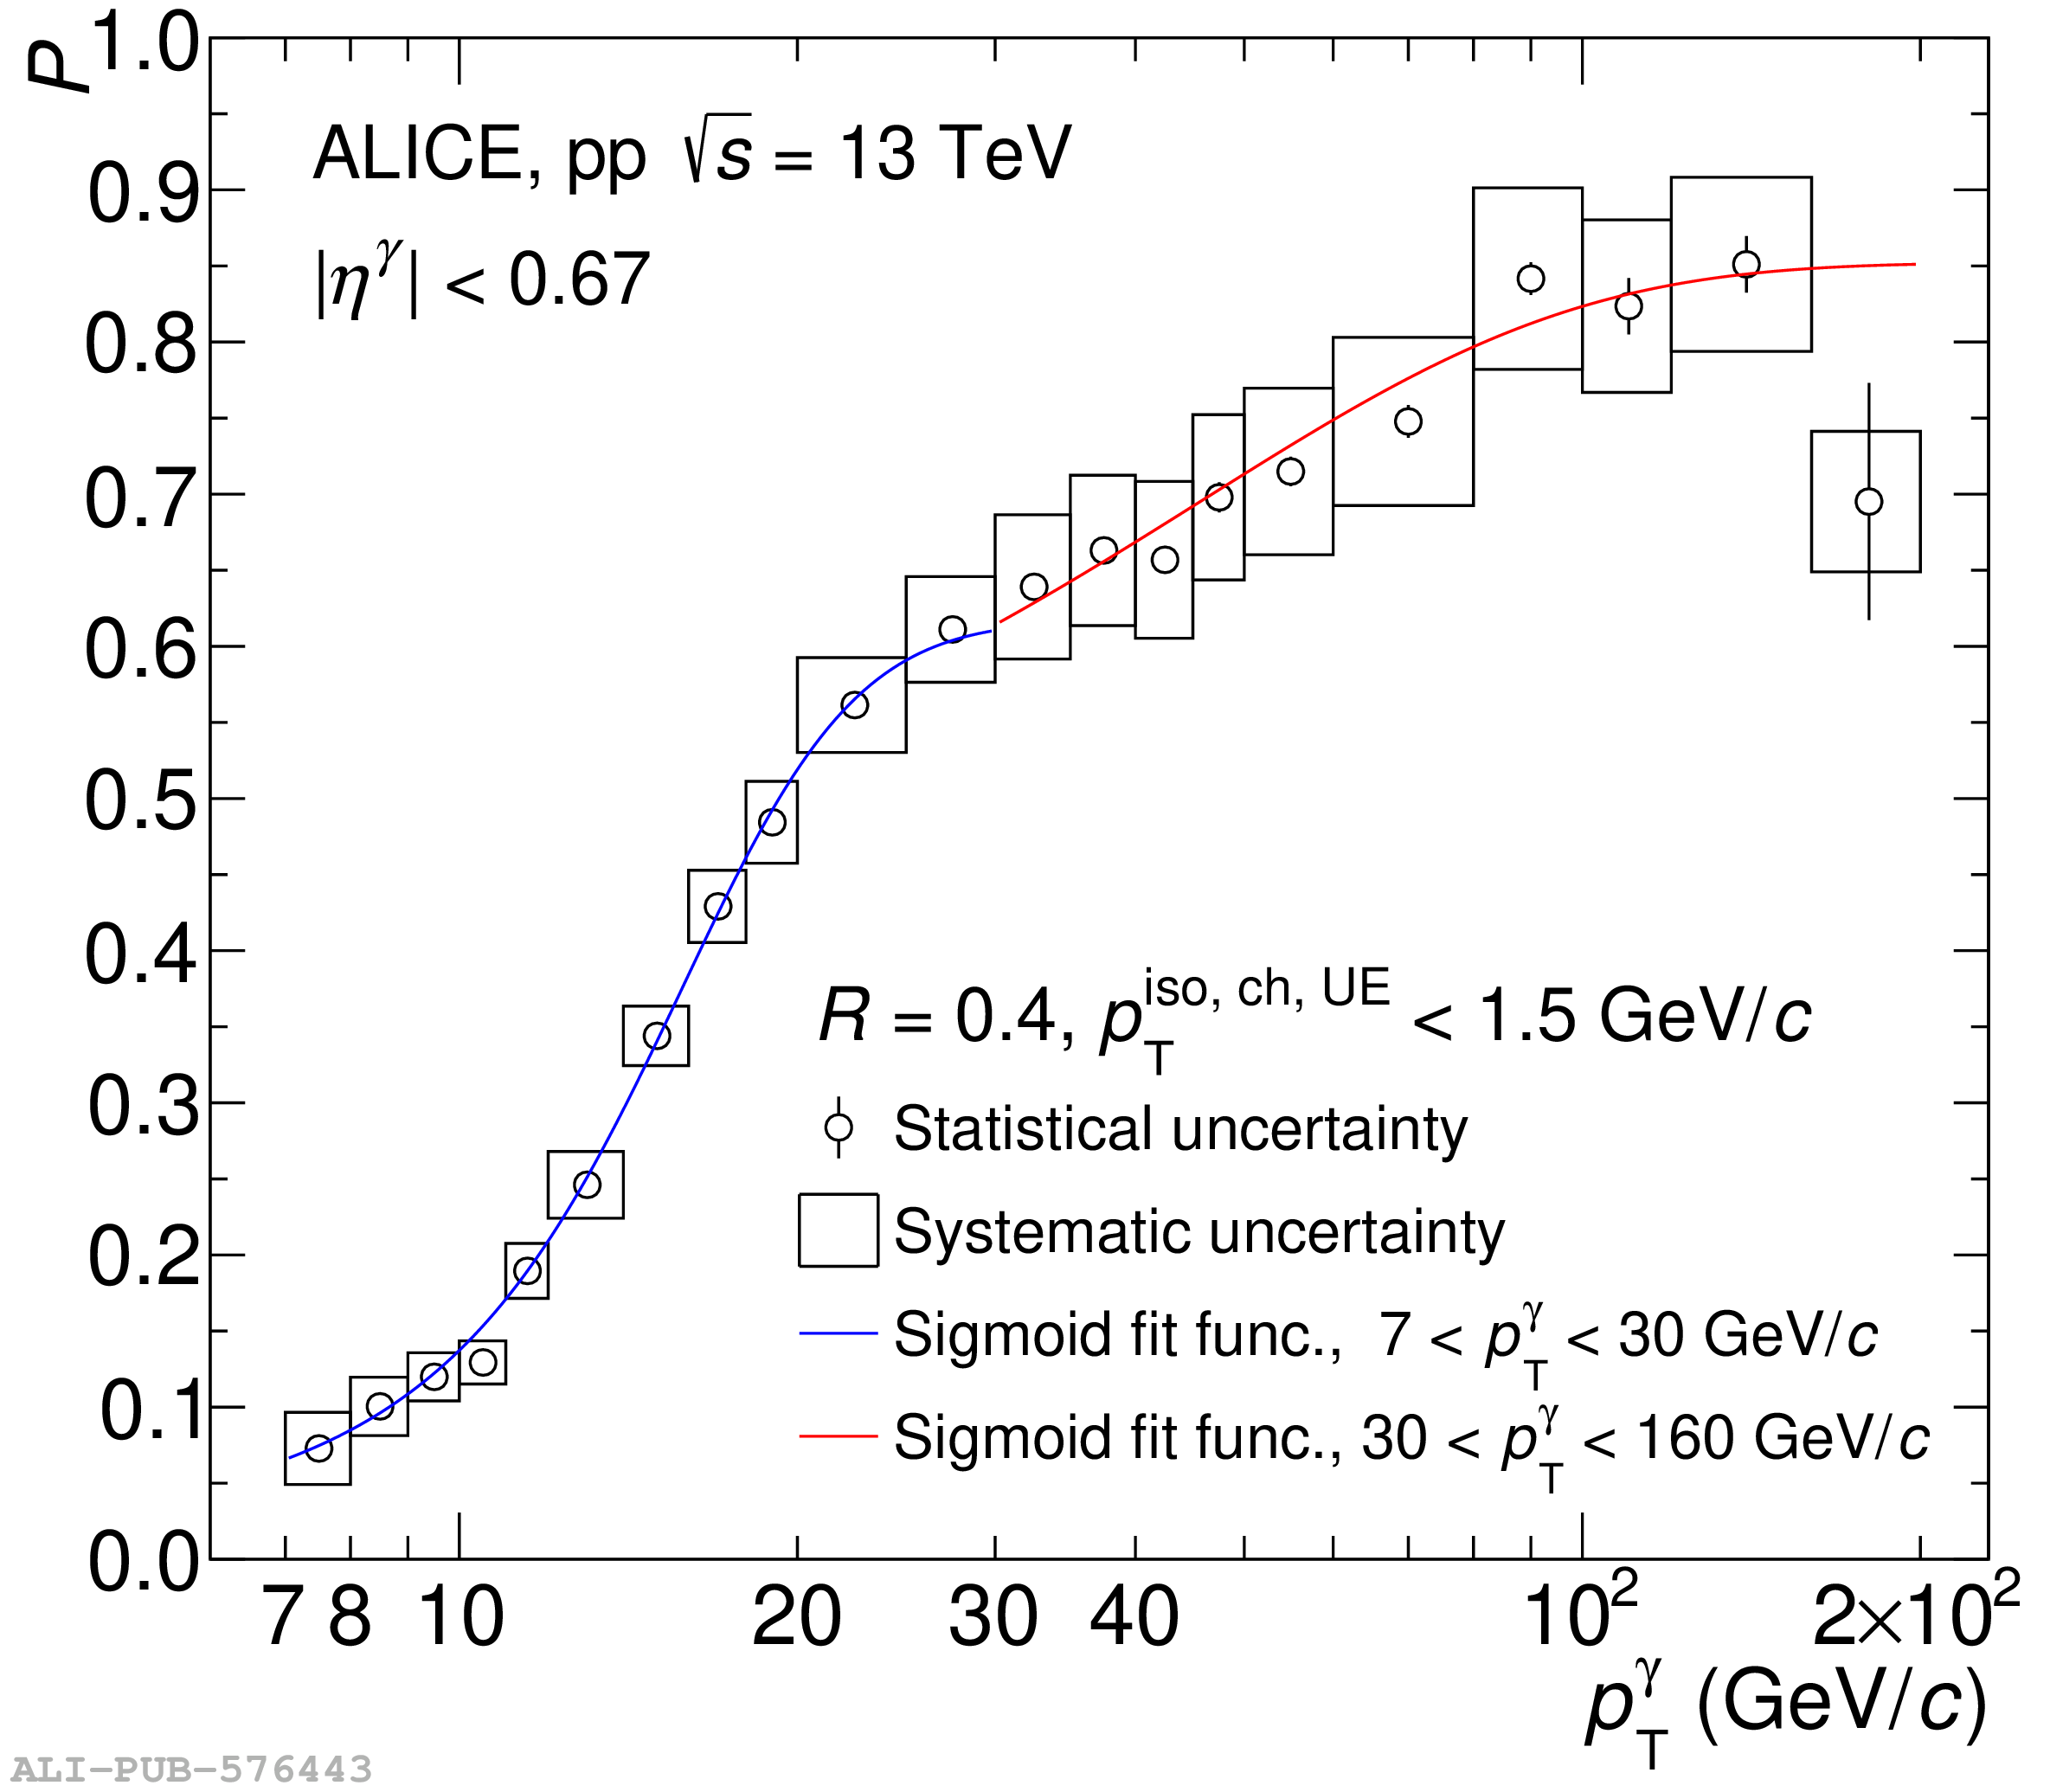 |