This Letter presents measurements of long-range transverse-momentum correlations using a new observable, $v_{0}(p_\mathrm{T})$, serving as a probe of event-by-event radial-flow fluctuations, the underlying radial expansion, and the medium properties in heavy-ion collisions. Results are reported for inclusive charged particles, pions, kaons, and protons across various centrality intervals in Pb$-$Pb collisions at $\sqrt{s_\mathrm{NN}} = 5.02$ TeV, recorded by the ALICE detector. A pseudorapidity-gap technique, similar to that used in anisotropic-flow studies, is employed to suppress short-range correlations. At low $p_\mathrm{T}$, a characteristic mass ordering consistent with hydrodynamic collective flow is observed. At higher $p_\mathrm{T}$ ($> 3$ GeV/$c$), protons exhibit larger $v_{0}(p_\mathrm{T})$ than pions and kaons, in agreement with expectations from quark-recombination models. Comparisons to viscous hydrodynamic calculations with varying bulk viscosity and equation of state demonstrate the sensitivity of the $v_{0}(p_\mathrm{T})$ observable to these key medium properties. The findings establish $v_{0}(p_\mathrm{T})$ as a valuable addition to the set of observables used in Bayesian analyses for extracting the transport properties and constraining the equation of state of strongly interacting matter, while also helping to systematically explore its sensitivity and impact within such global studies.
Phys. Rev. Lett. 136, 032302 (2026)
HEP Data
e-Print: arXiv:2504.04796 | PDF | inSPIRE
CERN-EP-2025-084
Figure group
Figure 1
$v_{0}(p_\mathrm{T})$ of inclusive charged particles shown as a function of $p_\mathrm{T}$ in Pb$-$Pb collisions at $\sqrt{s_\mathrm{NN}} = 5.02$ TeV for centrality intervals 10$-$20\% (a), 30$-$40\% (b), and 60$-$70\% (c). The measurements are compared to expectations from HIJING and IP-Glasma+MUSIC+UrQMD models. $v_{0}(p_\mathrm{T})/v_{0}$ of inclusive charged particles shown as a function of $p_\mathrm{T}$ for the centrality intervals (d). The statistical (systematic) uncertainties are represented by vertical bars (boxes). | 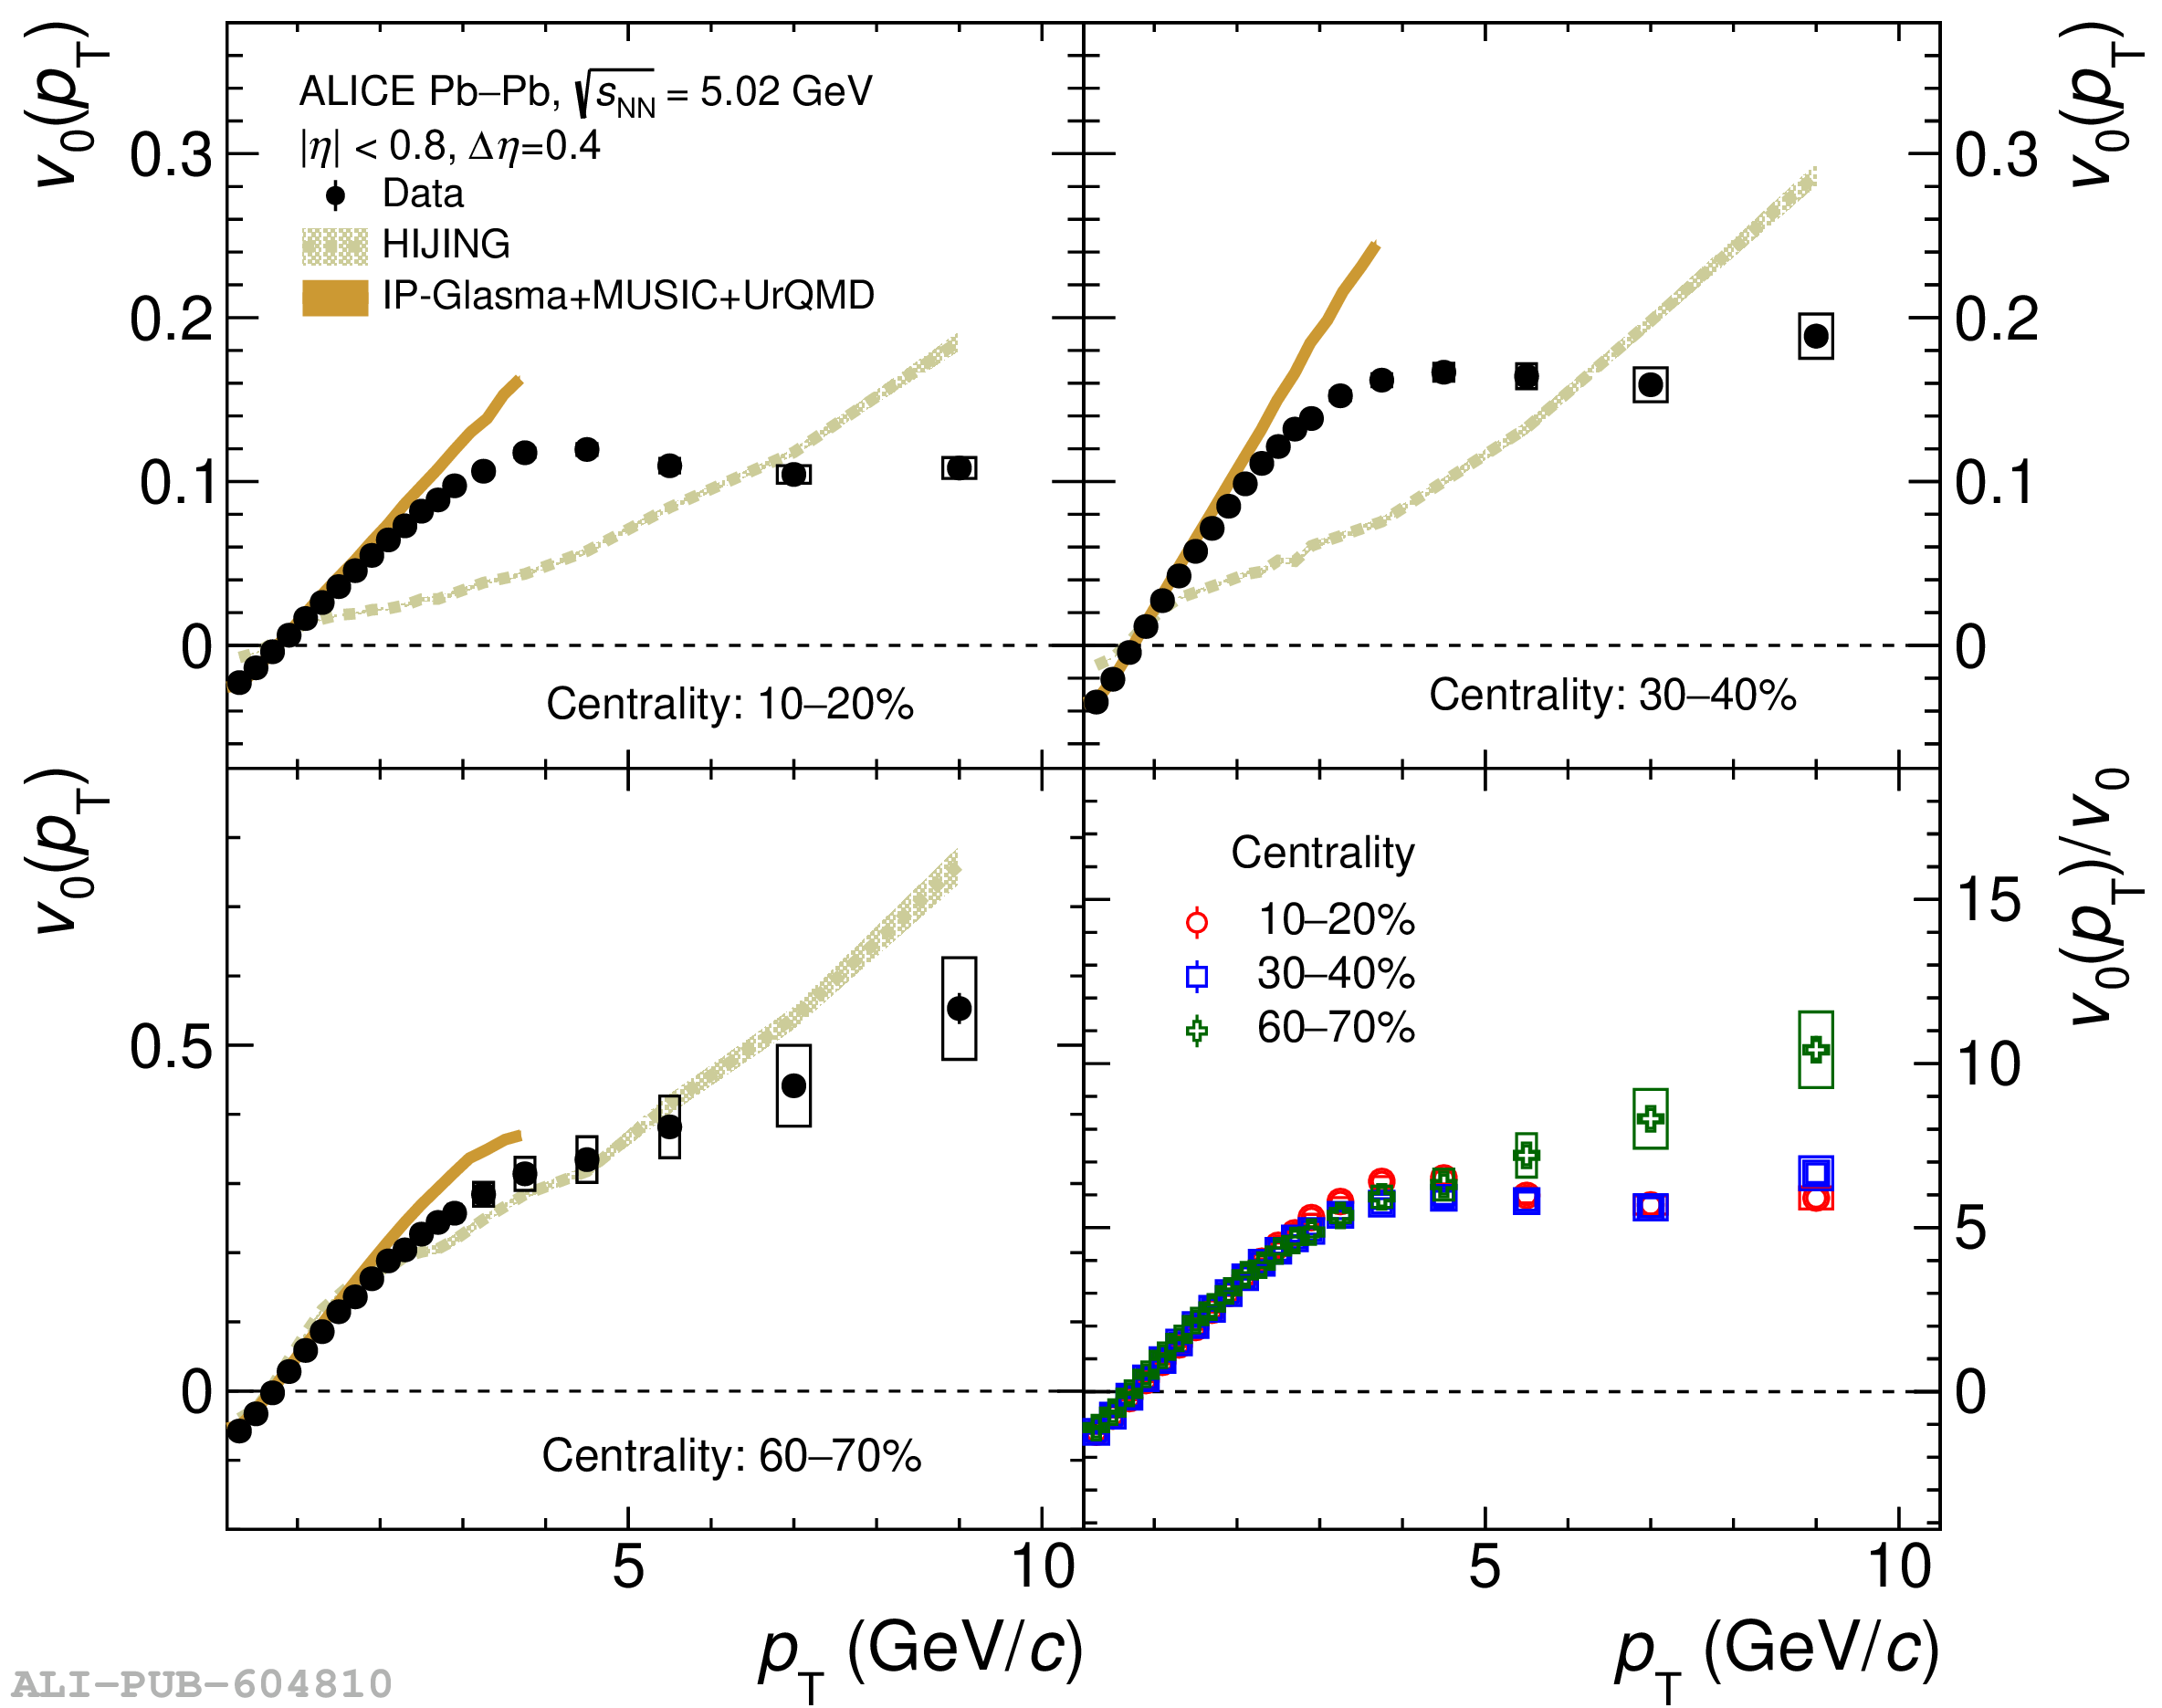 |
Figure 2
$v_{0}(p_\mathrm{T})$ of pions ($\pi^{\pm}$), kaons ($\mathrm{K}^{\pm}$), and protons ($\mathrm{p}(\bar{\mathrm{p}})$) shown as a function of $p_\mathrm{T}$ in Pb$-$Pb collisions at $\sqrt{s_\mathrm{NN}} = 5.02$ TeV for centrality intervals 10$-$20\% (a), 30$-$40\% (b), and 60$-$70\% (c). The measurements are compared to results from HIJING and IP-Glasma+MUSIC+UrQMD models. The statistical (systematic) uncertainties are represented by vertical bars (boxes). The bottom panels show the (Data-Model)/$\sigma$, representing the deviation between the experimental data and model predictions, normalized by the uncertainty. | 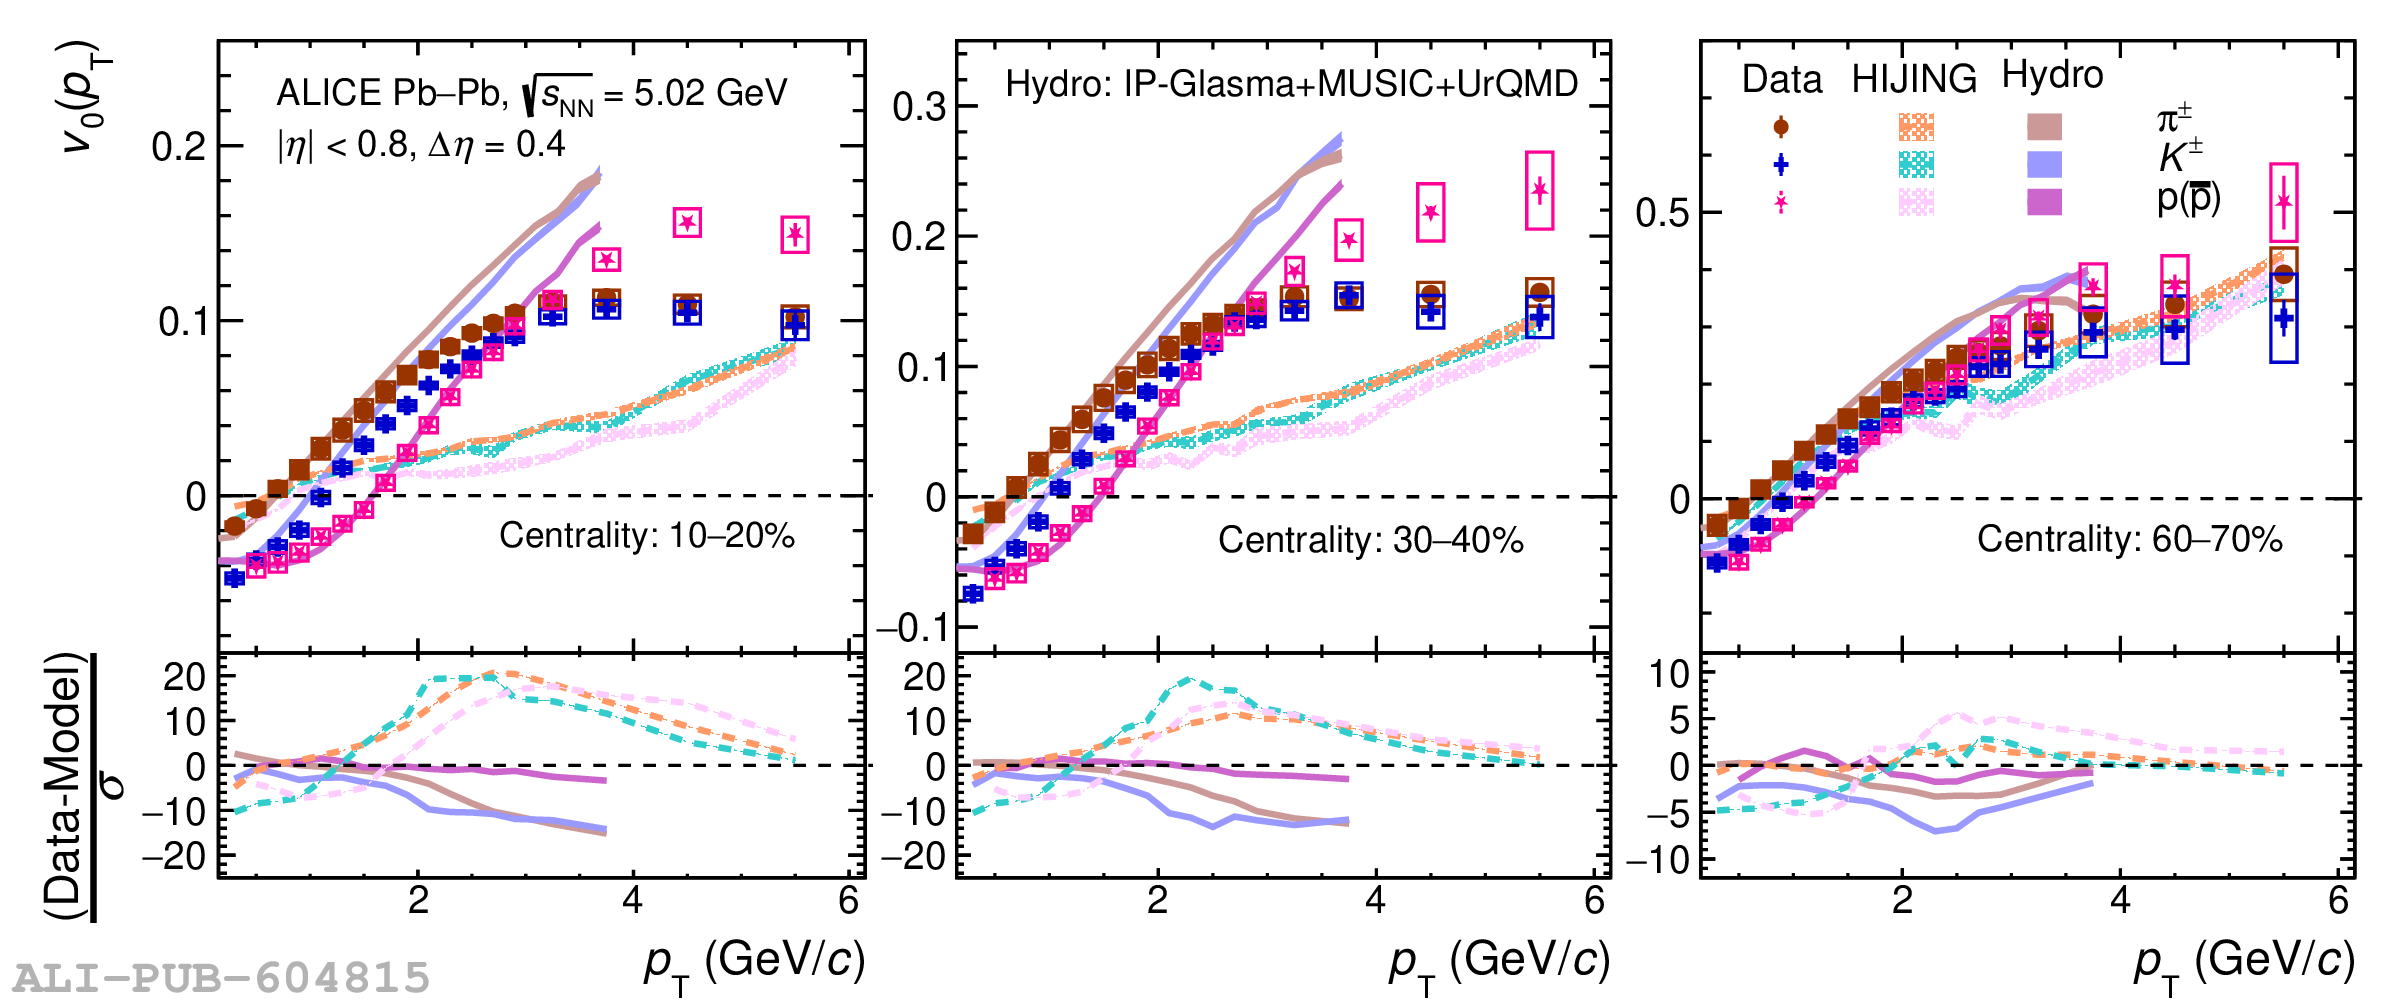 |
Figure 3
Comparison of $v_{0}(p_\mathrm{T})$ for inclusive charged particles in 10$-$20\% central Pb$-$Pb collisions at $\sqrt{s_\mathrm{NN}} = 5.02$ TeV with IP-Glasma+MUSIC+UrQMD calculations: variations in transport coefficients, $\eta/s$ and $\zeta/s$ (a), different equations of state from Ref. (b), and initial conditions (IC) with (w/) and without (w/o) sub-nucleonic fluctuations (c). The statistical (systematic) uncertainties are represented by vertical bars (boxes). | 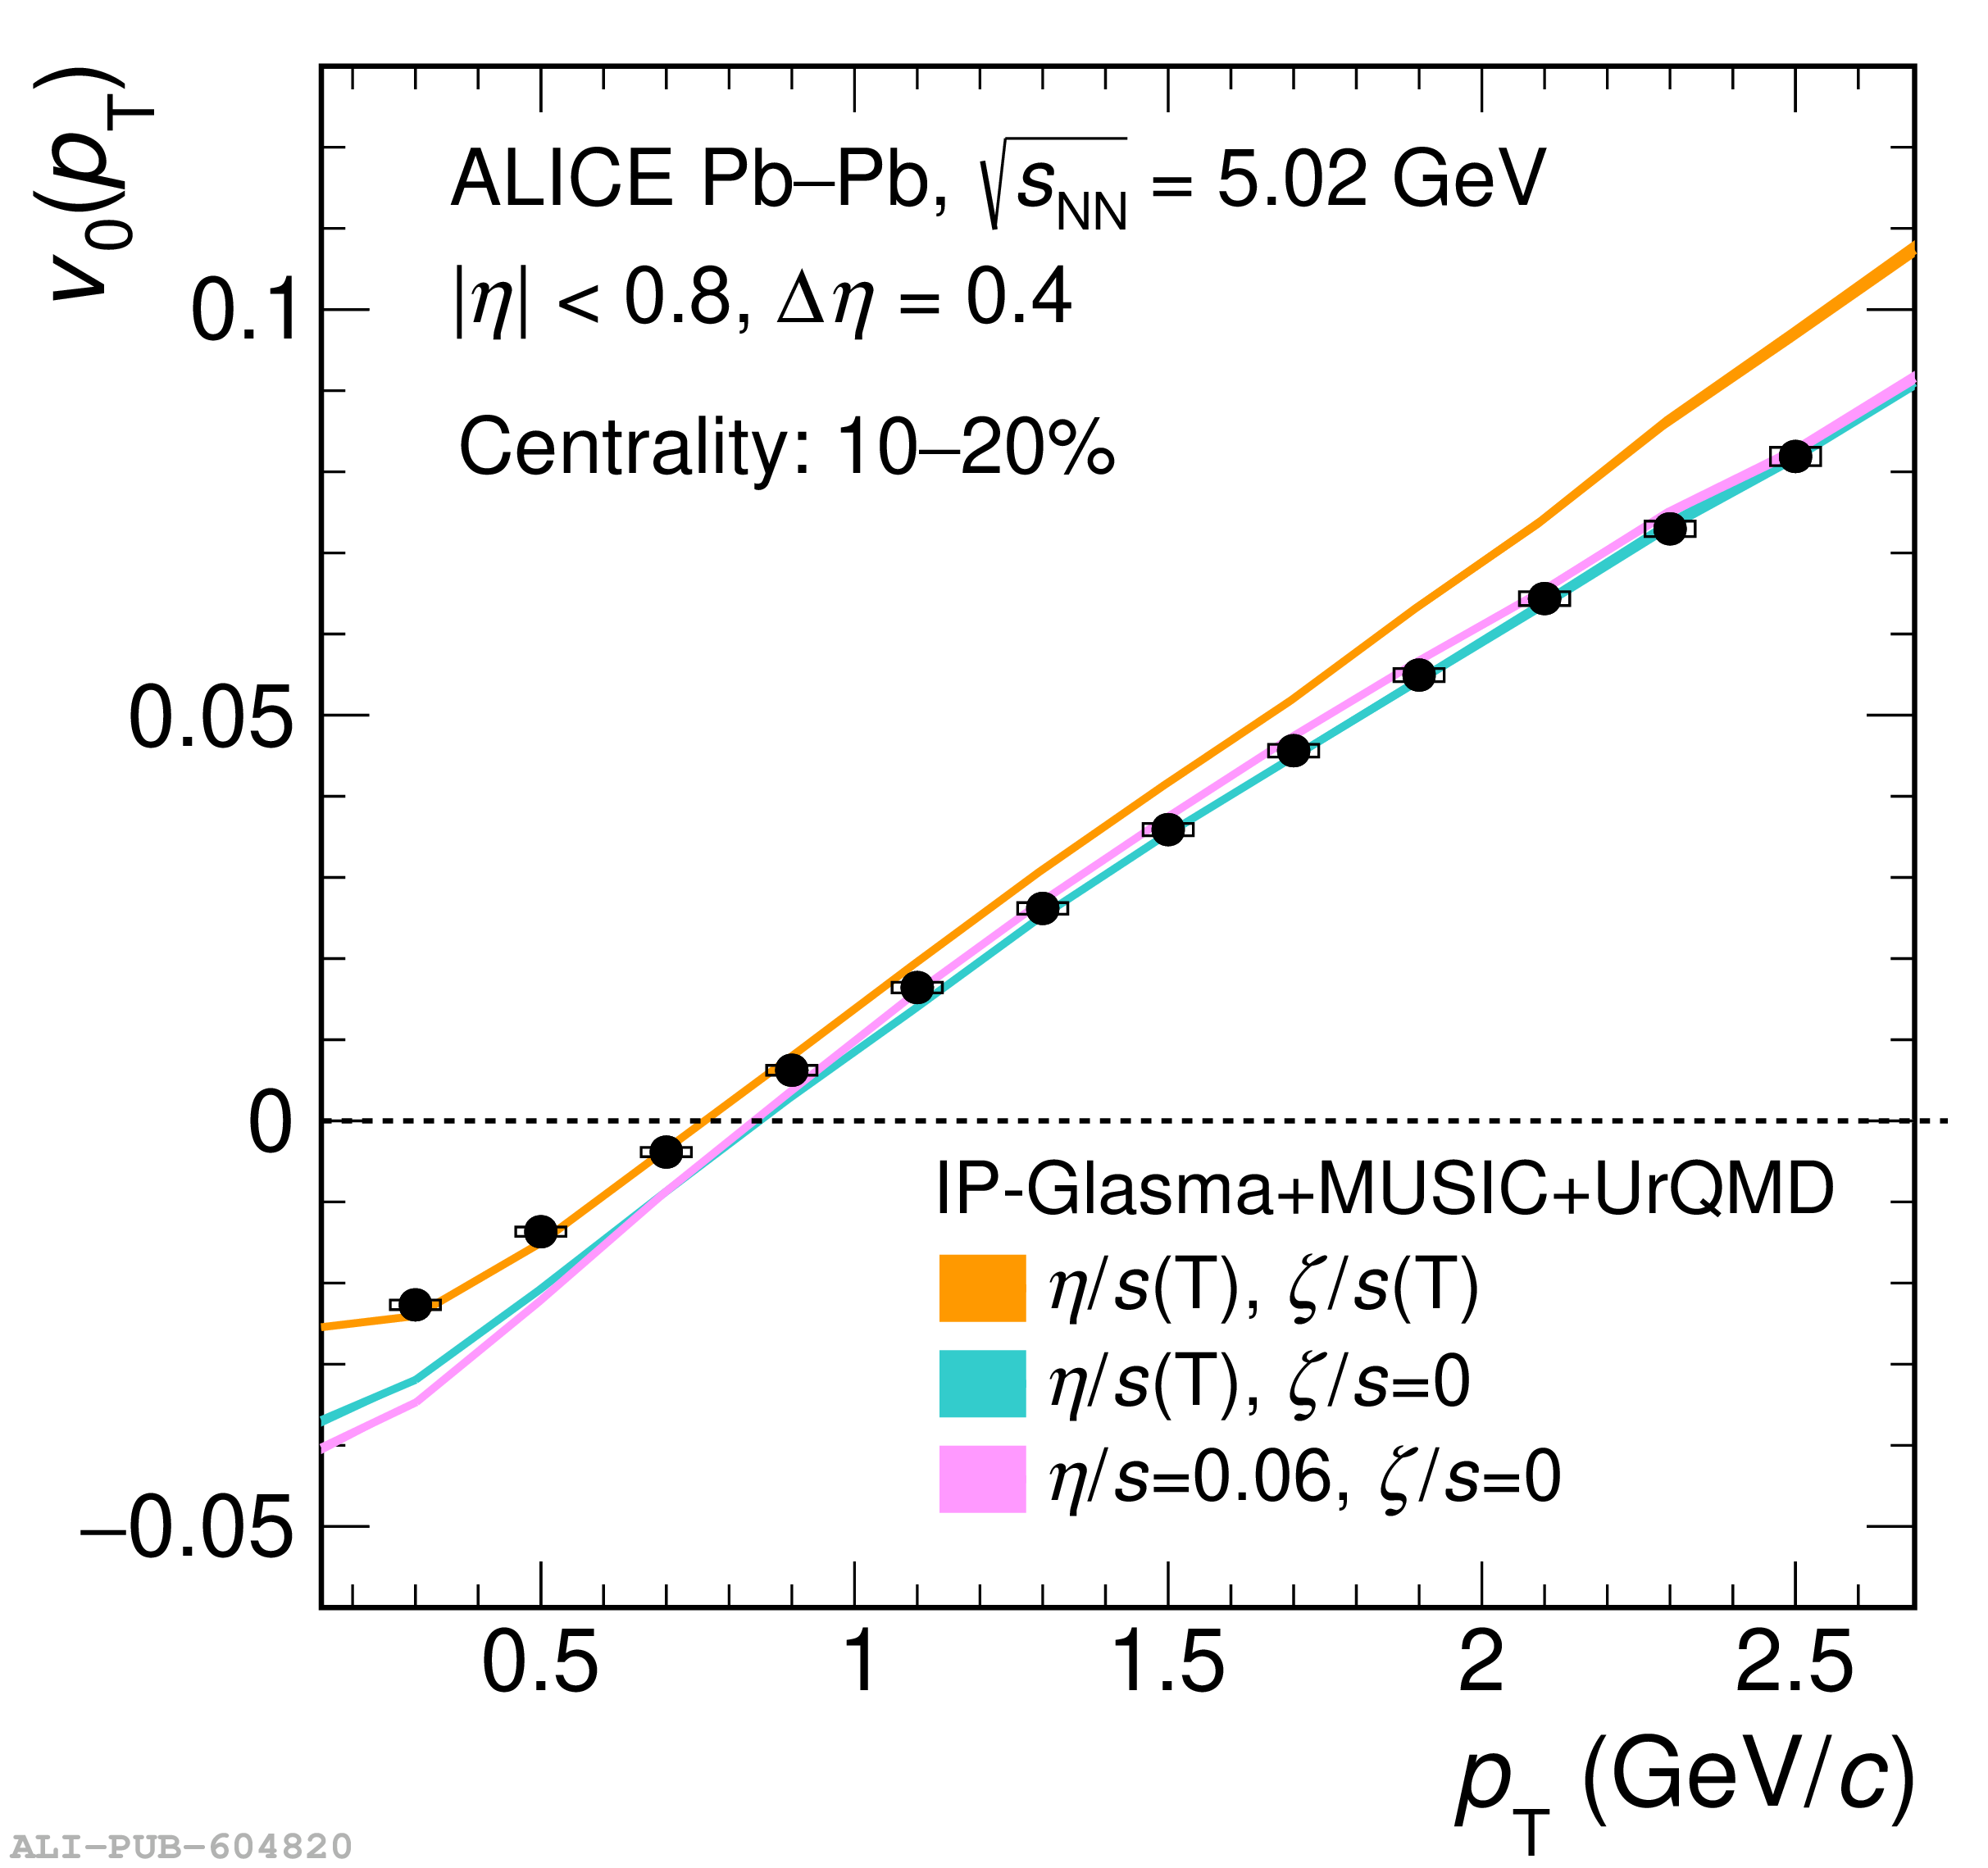 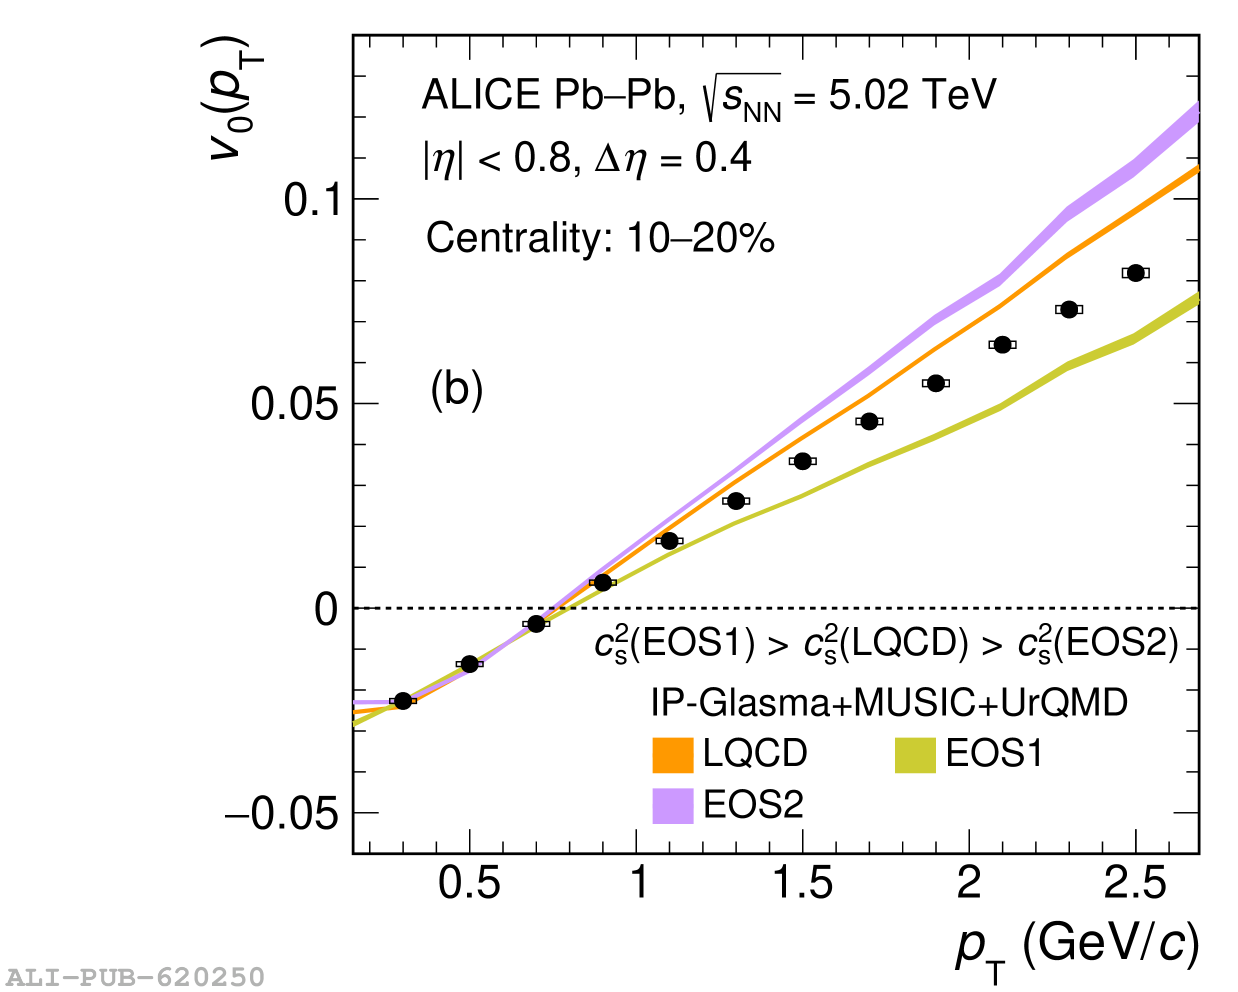  |

Figure A.2
$v_{0}(p_\mathrm{T})$ of inclusive charged particles shown as a function of $p_\mathrm{T}$ for centrality intervals 10$-$20\% (a), 30$-$40\% (b), and 60$-$70\% (c) for varying pseudorapidity gap ($\Delta\eta$) in Pb$-$Pb collisions at $\sqrt{s_\mathrm{NN}} = 5.02$ TeV. The error bars represent statistical uncertainties. The bottom panel presents the ratio relative to the results for $\Delta\eta = 0$. |    |
Figure A.3
HIJING model based calculations of $v_{0}(p_\mathrm{T})$ of inclusive charged particles as a function of $p_\mathrm{T}$ for centrality intervals 10$-$20\% (a), 30$-$40\% (b), and 60$-$70\% (c) in Pb$-$Pb collisions at $\sqrt{s_\mathrm{NN}} = 5.02$ TeV. The results at the generated and reconstructed level are shown, with lines connecting the central values and bands representing the statistical uncertainties. | 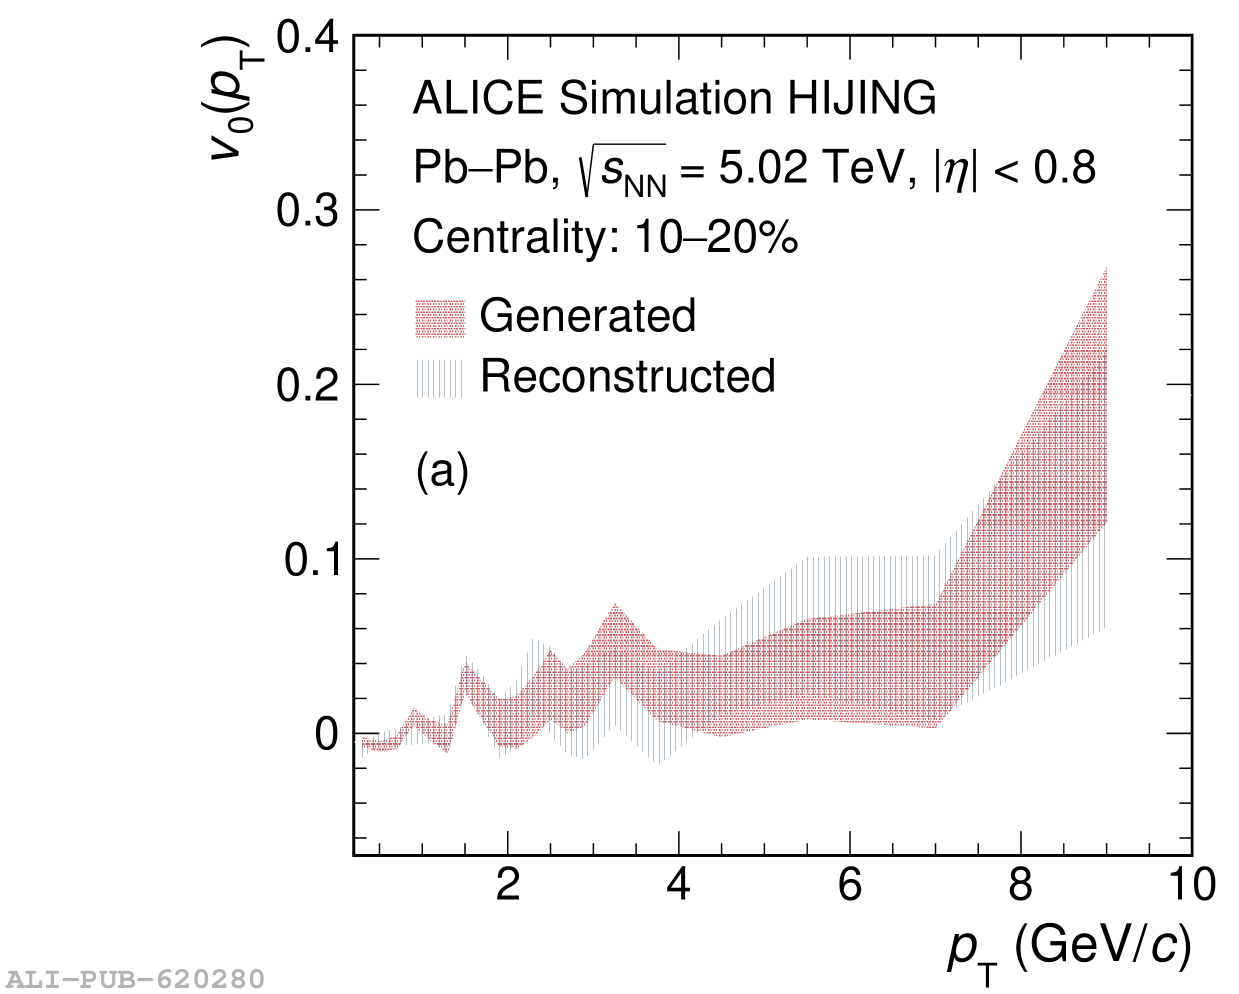 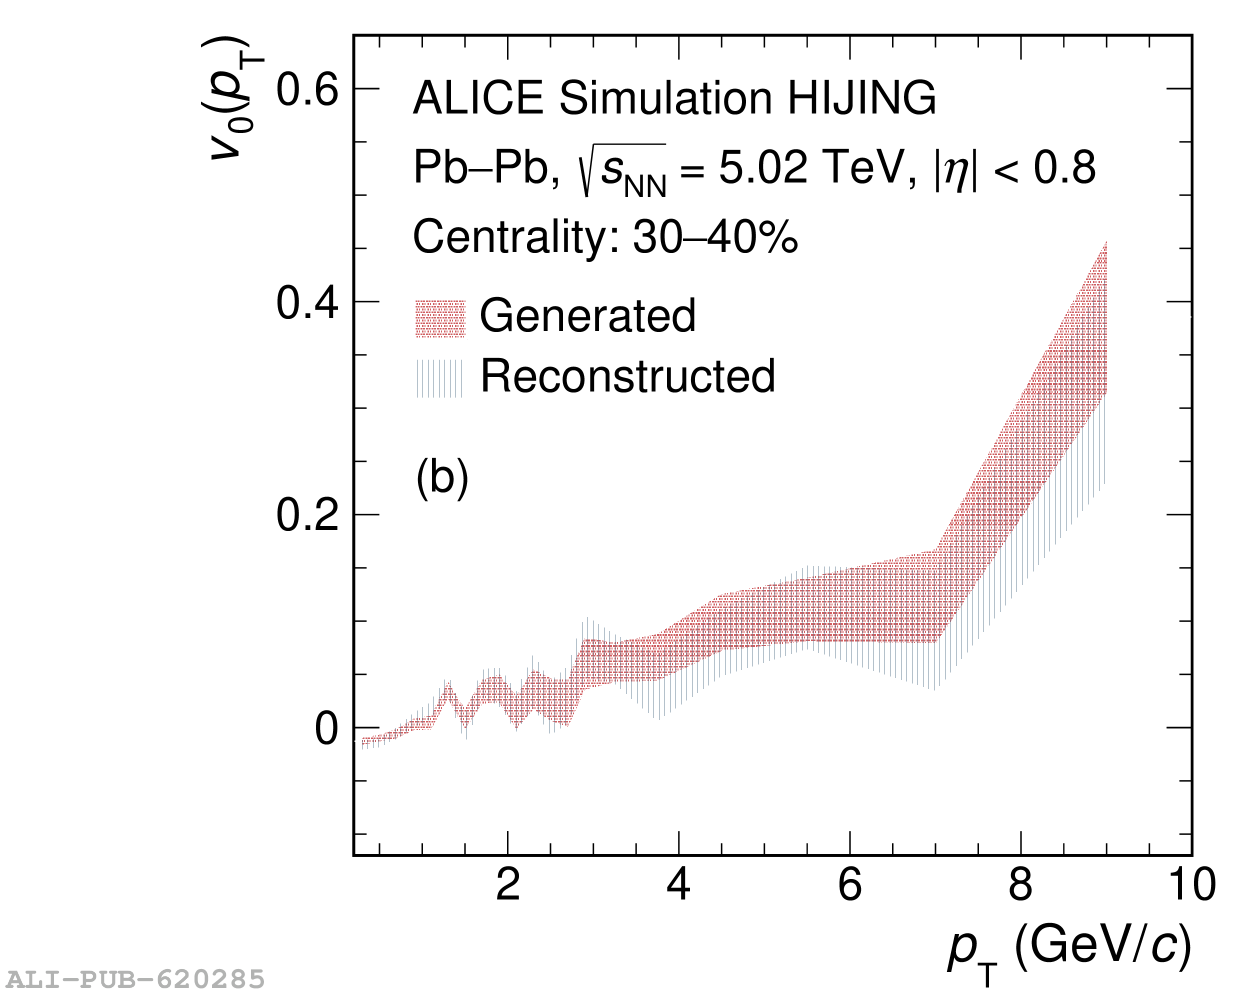 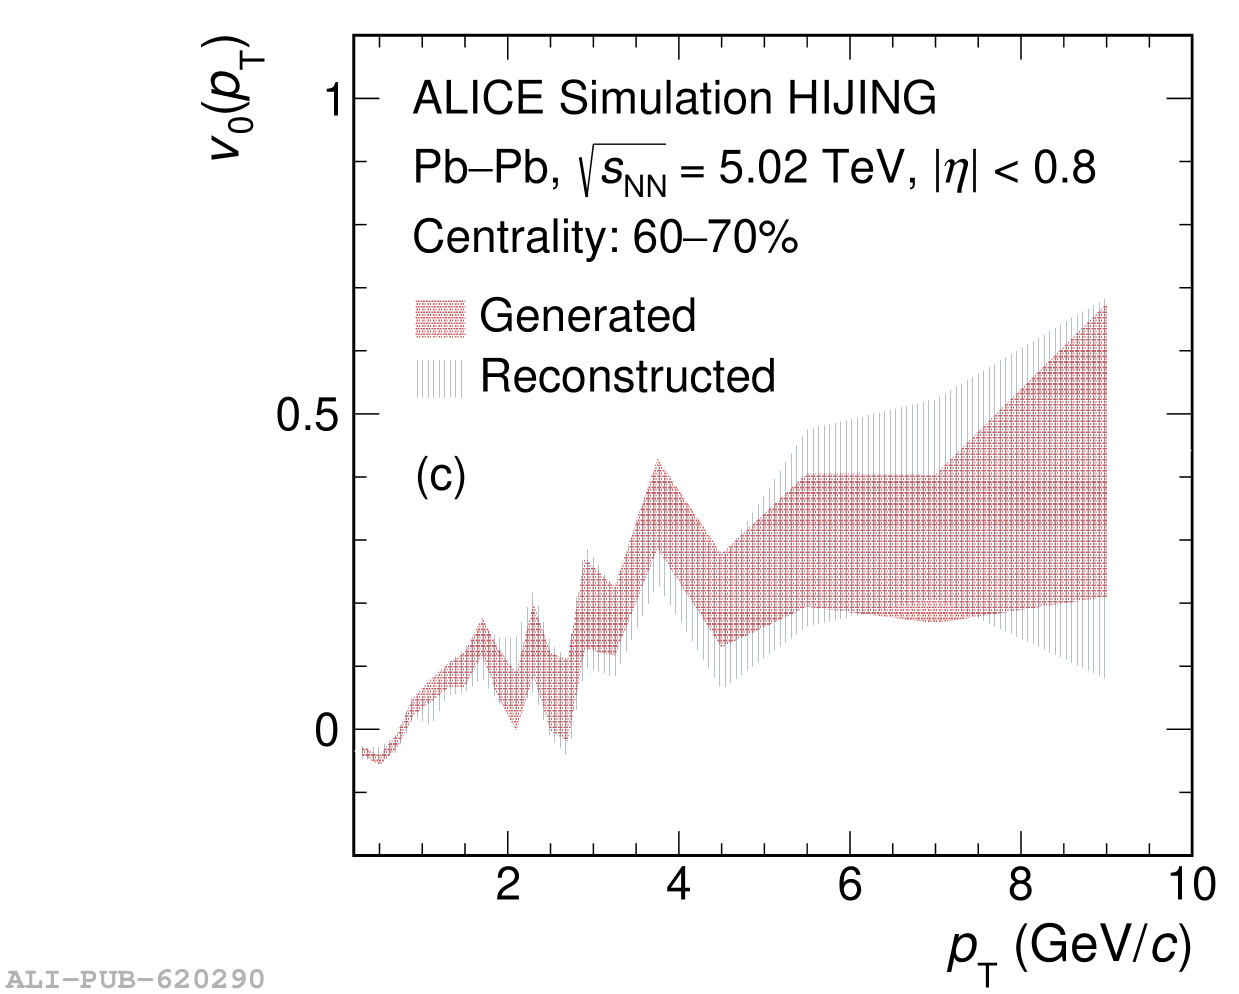 |
Figure A.4
$v_{0}(p_\mathrm{T})$ of inclusive charged particles shown as a function of $p_\mathrm{T}$ for centrality intervals 10$-$20\% (a), 30$-$40\% (b), and 60$-$70\% (c) for varying pseudorapidity gap ($\Delta\eta$) and azimuthal acceptance ($\varphi$) in Pb$-$Pb collisions at $\sqrt{s_\mathrm{NN}} = 5.02$ TeV. The statistical (systematic) uncertainties are represented by vertical bars (boxes). The bottom panel presents the ratio relative to the results for $\Delta\eta = 0.4, 0 \varphi 2\pi$. |    |
Figure A.5
$v_{0}(p_\mathrm{T})$ of pions ($\pi^{\pm}$), kaons ($\mathrm{K}^{\pm}$), and protons ($\mathrm{p}(\bar{\mathrm{p}})$) scaled by number of constituent quarks ($n_q$) shown as a function of transverse kinetic energy per constituent quark, $(m_\mathrm{T}-m_{0})/n_{q}$ in Pb$-$Pb collisions at $\sqrt{s_\mathrm{NN}} = 5.02$ TeV for centrality intervals 10$-$20\% (a), 30$-$40\% (b), and 60$-$70\% (c). The line represents a third-order polynomial function fitted to the pion data. | 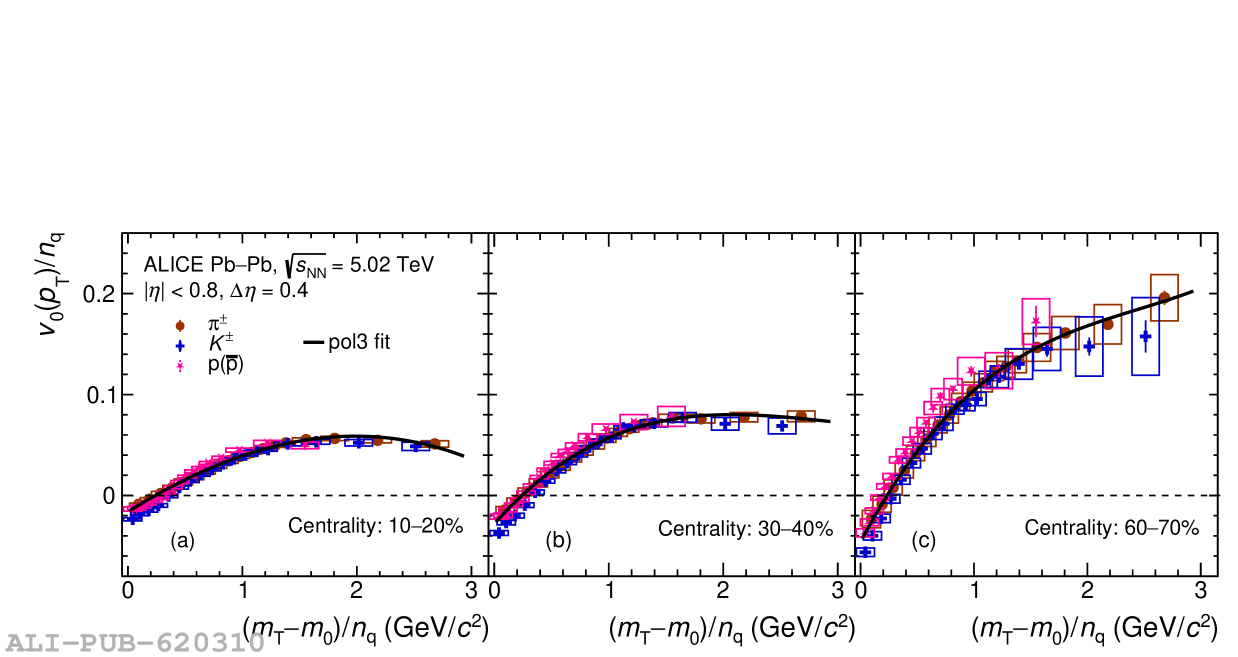 |