
Measurements of anisotropic flow provide some of the strongest constraints on the collective expansion and transport properties of the quark-gluon plasma produced in ultra-relativistic heavy-ion collisions. In this paper, correlations and fluctuations of the anisotropic flow coefficients $v_{2}$, $v_{3}$, and $v_{4}$ are measured in Pb-Pb and Xe-Xe collisions at $\sqrt{s_{\rm{NN}}} = 5.02$ and $5.44$ TeV, respectively, with the ALICE detector. The Event Shape Engineering technique, based on the reduced flow vector $q_{n}$, is used to study flow correlations for different initial-state geometries. A strong anticorrelation between $v_2$ and $v_3$ and a positive correlation between $v_2$ and $v_4$ are observed. A small anticorrelation is seen between $v_3$ and $v_4$. From the $v_2$-$v_4$ correlation, the linear and nonlinear components of $v_4$ are extracted and compared to those extracted using multiparticle correlations. The linear and nonlinear components of $v_{4}$ are also measured directly as a function of $q_2$ for the first time in Pb-Pb and Xe-Xe, revealing a strong coupling of the nonlinear term to the initial-state ellipticity $\varepsilon_2$, while the linear component shows little dependence on initial-state geometry. Additionally, the coupling coefficient $χ_{4,22}$, which measures the nonlinear contribution of $v_2^2$ to $v_4$, is extracted and shows little dependence on $q_2$, except in very central collisions. The effects of flow fluctuations for constrained initial-state geometries are studied for the first time using Event Shape Engineering with the ratio of $v_2\{2\}$ and $v_2\{4\}$; the results show that collisions with the lowest $q_2$ exhibit more significant $v_2$ fluctuations compared to the unbiased ratio.
Submitted to: PLB
e-Print: arXiv:2611.08473 | PDF | inSPIRE
CERN-EP-2026-296
Figure group
Figure 1
Charged-particle $v_2\{2\}$ for event-shape-selected and unbiased events as a function of centrality in Pb--Pb (left) and Xe--Xe (right) collisions. Events are classified according to $q_2$ measured in the V0C detector. Points corresponding to different $q_2$ values are slightly shifted horizontally within each centrality interval for better visibility. Error bars (boxes) indicate statistical (systematic) uncertainties. |   |
Figure 2
Charged-particle $v_3\{2\}$ for event-shape-selected and unbiased events as a function of centrality in Pb--Pb (left) and Xe--Xe (right) collisions. Events are classified according to $q_2$ measured in the V0C detector. Points corresponding to different $q_2$ values are slightly shifted horizontally within each centrality interval for better visibility. Error bars (boxes) indicate statistical (systematic) uncertainties. |   |
Figure 3
Charged-particle $v_4\{2\}$ for event-shape-selected and unbiased events as a function of centrality in Pb--Pb (left) and Xe--Xe (right) collisions. Events are classified according to $q_2$ measured in the V0C detector. Points corresponding to $q_2$ values are slightly shifted horizontally within each centrality interval for better visibility. Error bars (boxes) indicate statistical (systematic) uncertainties. |   |
Figure 4
Charged-particle $v_2\{2\}$ for event-shape-selected and unbiased events as a function of centrality in Pb--Pb (left) and Xe--Xe (right) collisions. Events are classified according to $q_3$ measured in the V0C detector. Points corresponding to $q_3$ values are slightly shifted horizontally within each centrality interval for better visibility. Error bars (boxes) indicate statistical (systematic) uncertainties. |   |
Figure 5
Charged-particle $v_3\{2\}$ for event-shape-selected and unbiased events as a function of centrality in Pb--Pb (left) and Xe--Xe (right) collisions. Events are classified according to $q_3$ measured in the V0C detector. Points corresponding to $q_3$ values are slightly shifted horizontally within each centrality interval for better visibility. Error bars (boxes) indicate statistical (systematic) uncertainties. |   |
Figure 6
Charged-particle $v_4\{2\}$ for event-shape-selected and unbiased events as a function of centrality in Pb--Pb (left) and Xe--Xe (right) collisions. Events are classified according to $q_3$ measured in the V0C detector. Points corresponding to $q_3$ values are slightly shifted horizontally within each centrality interval for better visibility. Error bars (boxes) indicate statistical (systematic) uncertainties. |   |
Figure 7
The correlation between $v_3\{2\}$ and $v_2\{2\}$ using $q_2^\mathrm{V0C}$ selection in Pb--Pb (left) and Xe--Xe (right) collisions. The open black points, connected by a black line for visibility, show the $q_2$-unbiased correlation from central to peripheral collisions. The $q_2$-differential correlations, with the lowest (highest) $v_2\{2\}$ value corresponding to 0–-10\% (90–-100\%) $q_2$, are shown by the full markers and linear fits in each centrality interval. Error bars (boxes) indicate statistical (systematic) uncertainties. |   |
Figure 8
The coefficients $v_3^0$ (left) and $k$ (right) from fits of Eq. \eqref{eq:v3v2} to the $v_2\{2\}$--$v_3\{2\}$ correlation shown in Fig. \ref{fig:v2v3cor} for Pb--Pb (solid red markers) and Xe--Xe (open red markers) collisions as a function of the collision centrality. Xe--Xe points are slightly shifted horizontally. Measurements from the ATLAS Collaboration in Ref. (black points) are shown for charged particles in the kinematic range $0.5 p_\mathrm{T} 2.0 \text{GeV}/c$ and $|\eta| 2.5$. Error bars (boxes) indicate statistical (systematic) uncertainties. | 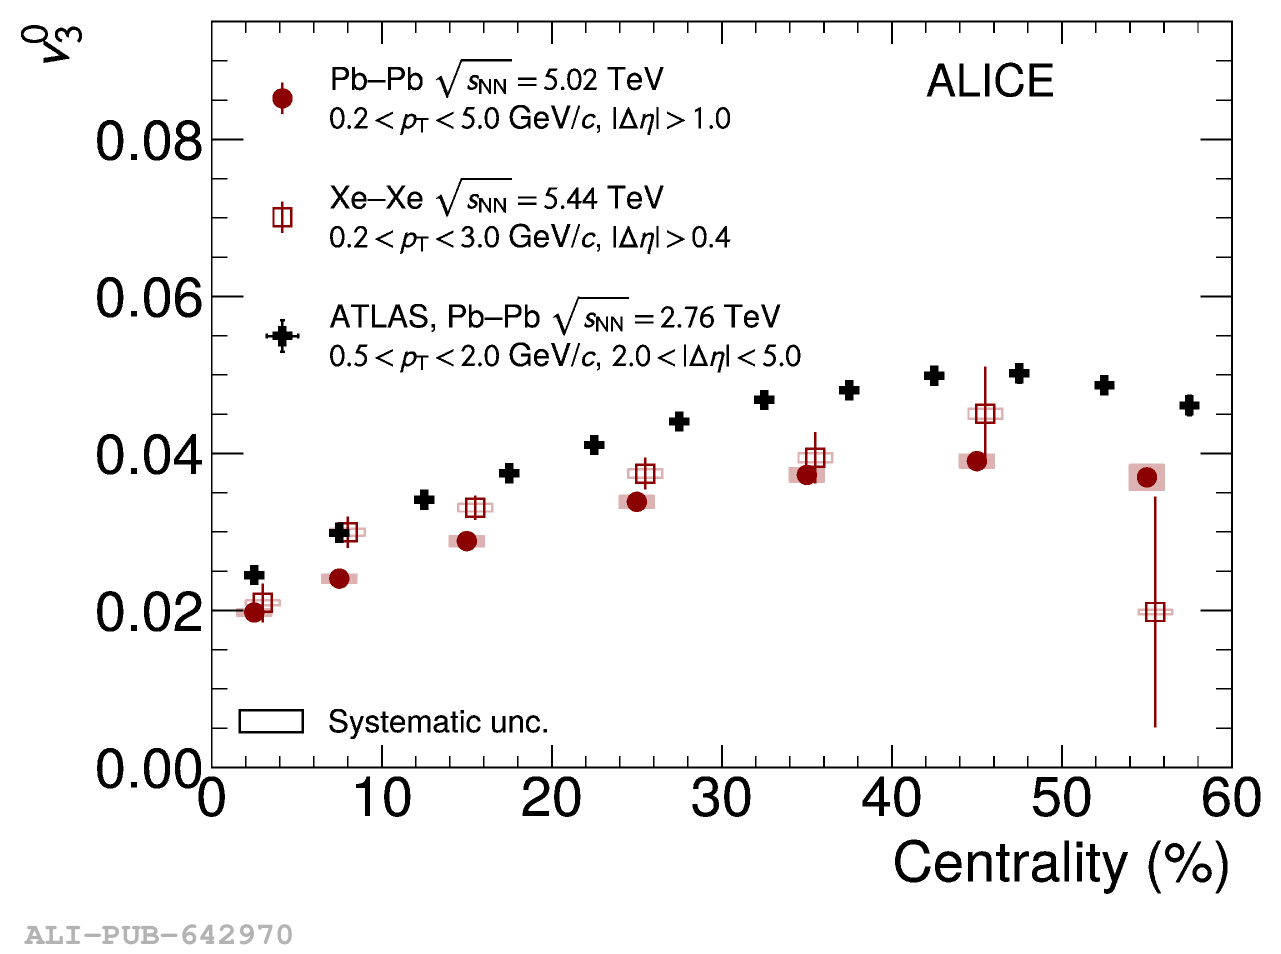 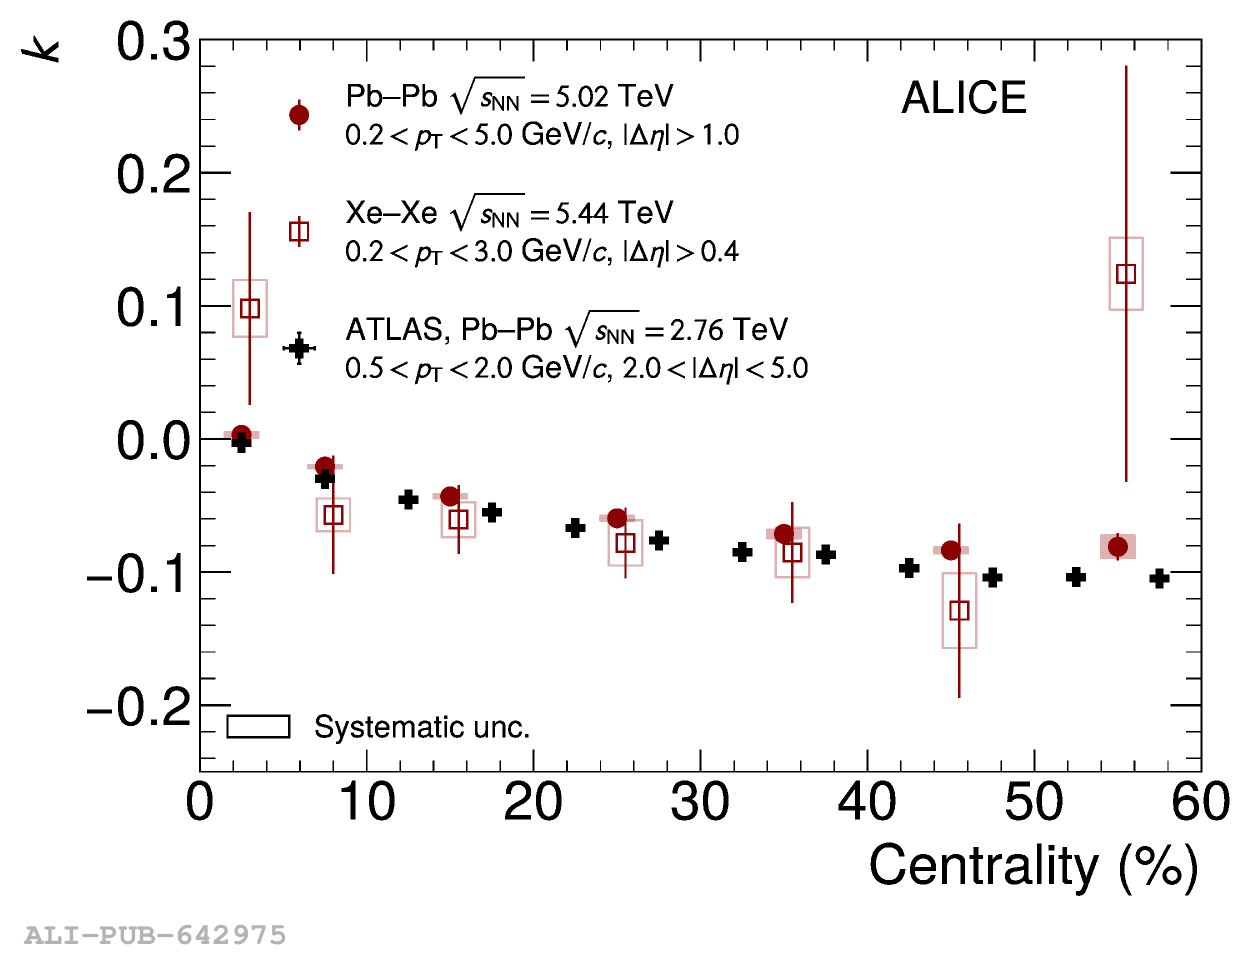 |
Figure 9
The correlation between $v_4\{2\}$ and $v_2\{2\}$ using $q_2^\mathrm{V0C}$ selection (left) and $v_4\{2\}$ and $v_3\{2\}$ using $q_3^\mathrm{V0C}$ selection (right) in Pb--Pb collisions. The open black points, connected by a black line for visibility, show the unbiased correlation. The $q_n$-differential correlations are shown by the full markers in each centrality interval. Error bars (boxes) indicate statistical (systematic) uncertainties. |   |
Figure 10
The coefficients $c_0$ (left), representing the linear contribution, and $c_1$ (right), quantifying the nonlinear dependence on $v_2^2$, from fits of Eq. \eqref{eq:v4fit} to the $v_2\{2\}$--$v_4\{2\}$ correlations shown in Fig. \ref{fig:v2v4cor} for Pb--Pb (solid red markers) and Xe--Xe (open red markers) collisions as a function of the collision centrality. Xe--Xe points are slightly shifted horizontally for better visibility. Measurements from the ATLAS Collaboration in Ref. (black points) are shown for charged particles in the kinematic range $0.5 p_\mathrm{T} 2.0 \text{GeV}/c$ and $|\eta| 2.5$. Error bars (boxes) indicate statistical (systematic) uncertainties. | 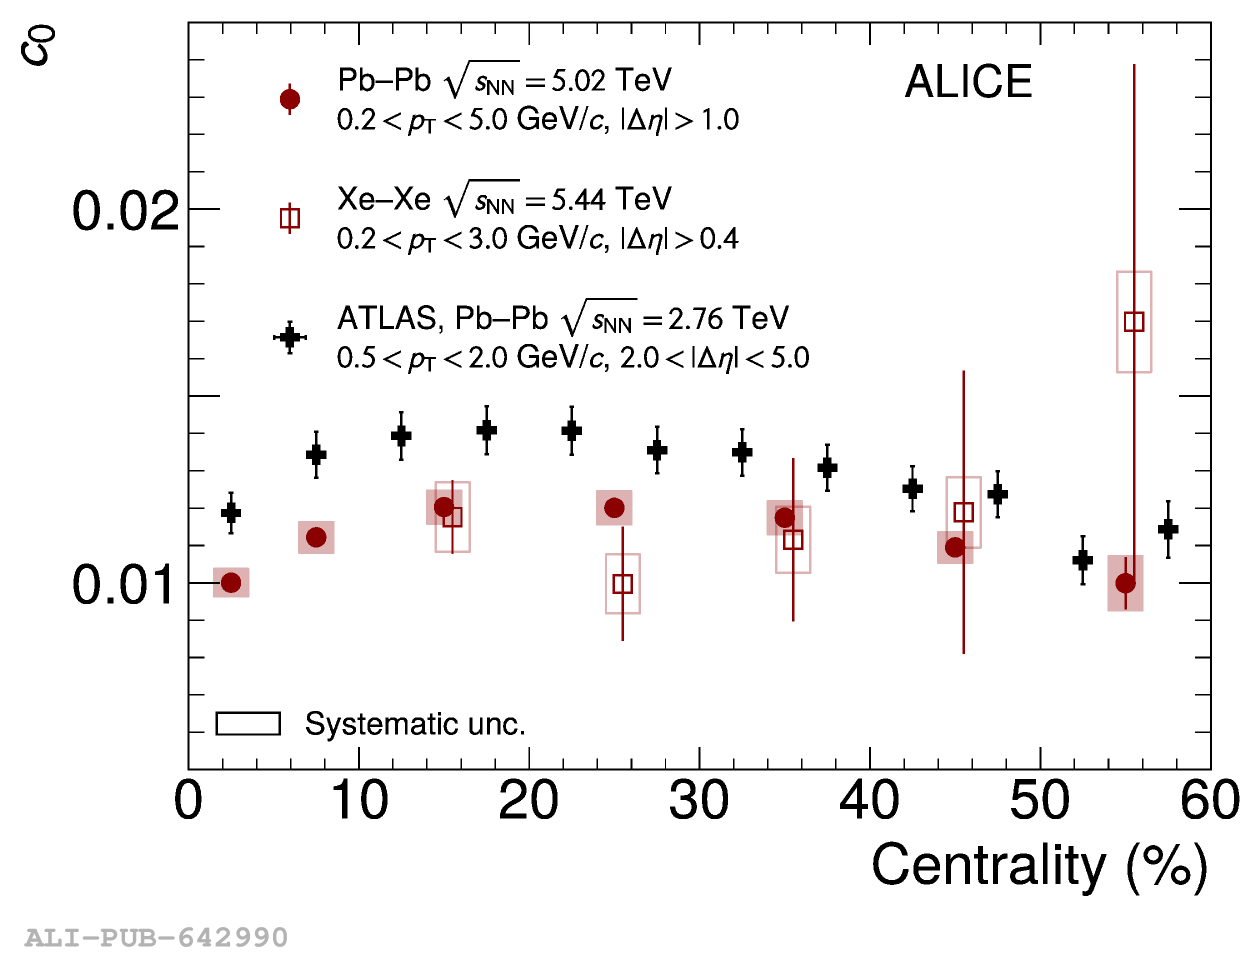 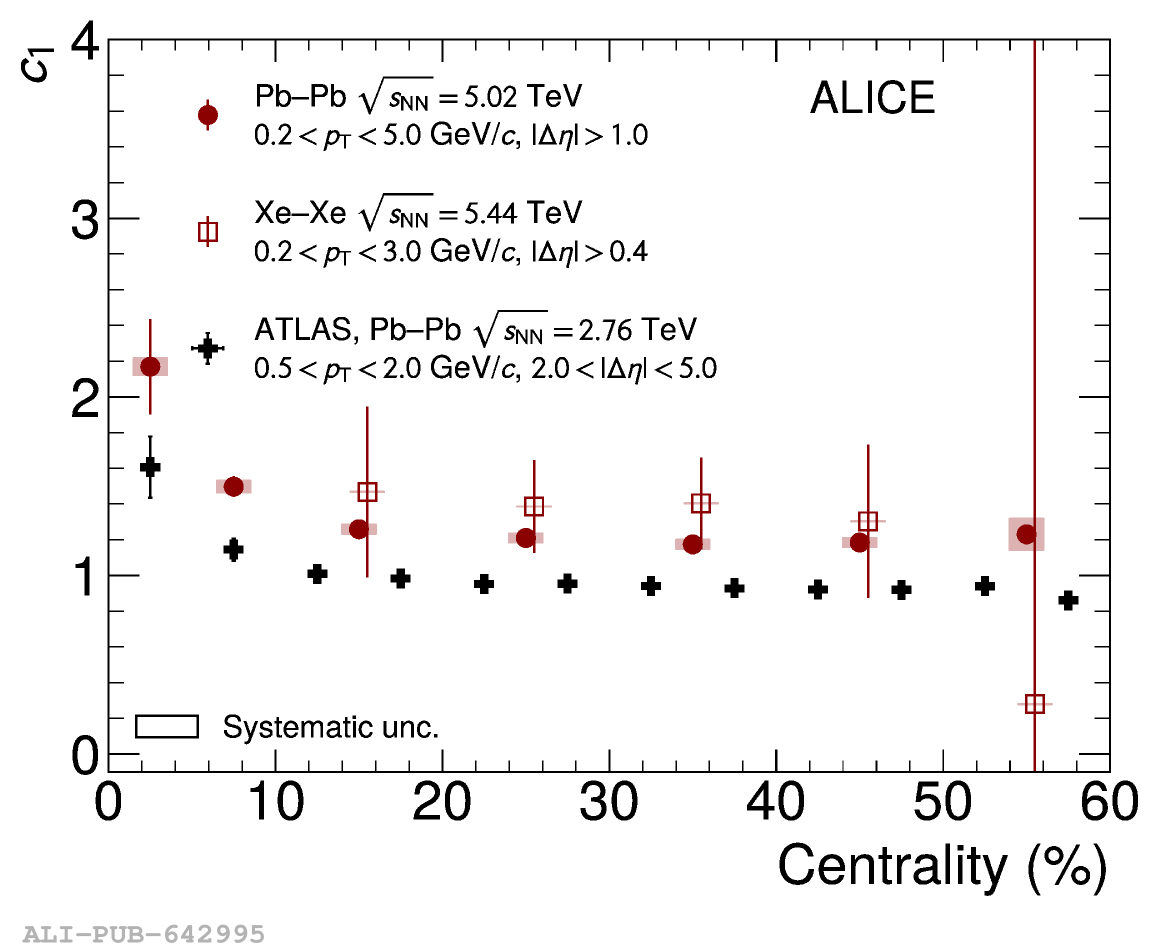 |
Figure 11
The contribution of the linear and nonlinear flow modes of $v_4$ extracted via multiparticle correlations (solid red and blue points) and using the ESE (open red and blue points), as well as the unbiased $v_4\{2,|\Delta\eta|>1.0\}$ (black points), as a function of centrality in Pb--Pb collisions. Error bars (boxes) indicate statistical (systematic) uncertainties. |  |


Figure 14
The linear (red) and nonlinear (black) flow modes of $v_4$ measured with multiparticle correlations as a function of the $q_2^\mathrm{V0C}$ percentile in 10--20\% (left) and 20--30\% (right) central Xe--Xe collisions. Error bars (boxes) indicate statistical (systematic) uncertainties. |   |
