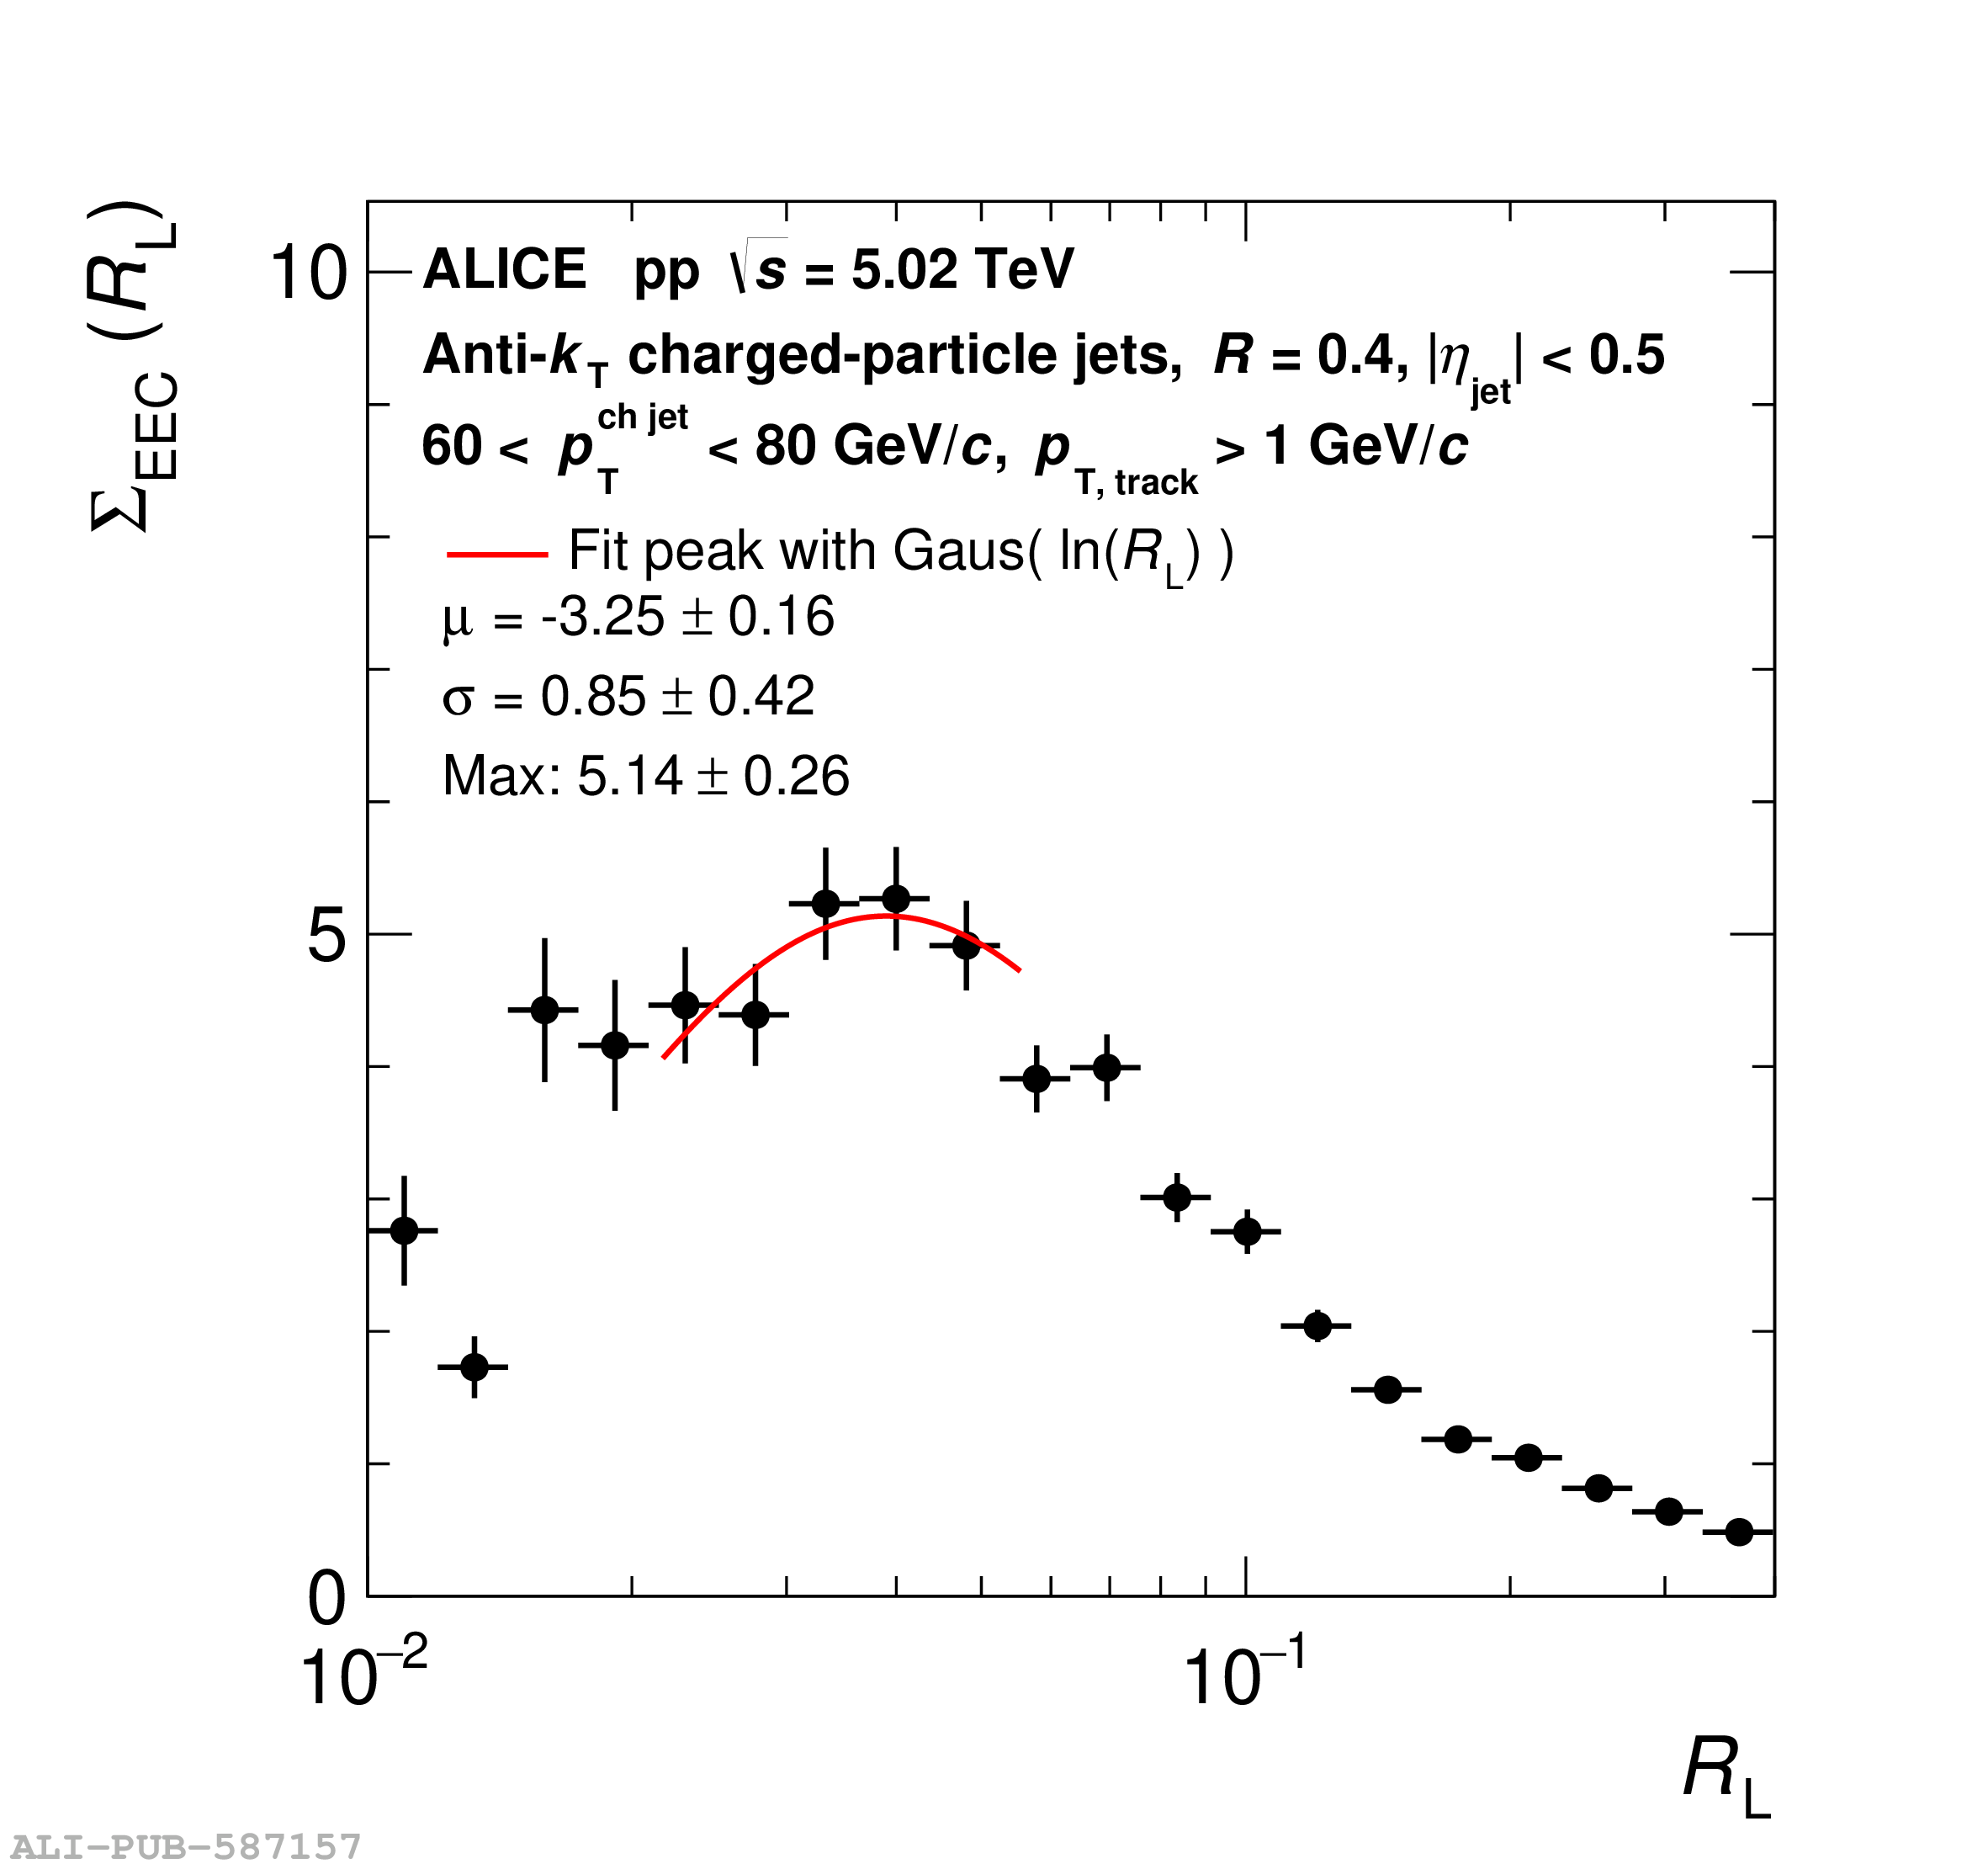
Related paper Exposing the parton-hadron transition within jets with energy-energy correlators in pp collisions at $\sqrt{\textit s}=5.02$ TeV Extraction of the peak position and height of the EEC distributions in different jet $\pT$ ranges. The fit function and fitting range used is shown by the red curve. [png] [pdf] [eps][png] [pdf] [eps][png] [pdf] [eps]