The ALICE Collaboration reports measurements of the large relative transverse momentum ($k_{\text{T}}$) component of jet substructure in pp and Pb$-$Pb collisions at center-of-mass energy per nucleon pair $\sqrt{s_{\text{NN}}}=5.02$ TeV. Enhancement in the yield of such large-$k_{\text{T}}$ emissions in head-on Pb$-$Pb collisions is predicted to arise from partonic scattering with quasi-particles of the quark-gluon plasma. The analysis utilizes charged-particle jets reconstructed by the anti-$k_{\text{T}}$ algorithm with resolution parameter $R=0.2$ in the transverse-momentum interval $60 <~ p_{\text{T,ch jet}} <~ 80$ GeV/$c$. The soft drop and dynamical grooming algorithms are used to identify high transverse momentum splittings in the jet shower. Comparison of measurements in Pb$-$Pb and pp collisions shows medium-induced narrowing, corresponding to yield suppression of high-$k_{\text{T}}$ splittings, in contrast to the expectation of yield enhancement due to quasi-particle scattering. The measurements are compared to theoretical model calculations incorporating jet modification due to jet-medium interactions ("jet quenching"), both with and without quasi-particle scattering effects. These measurements provide new insight into the underlying mechanisms and theoretical modeling of jet quenching.
Phys. Rev. Lett. 135, 031901 (2025)
HEP Data
e-Print: arXiv:2409.12837 | PDF | inSPIRE
CERN-EP-2024-238
Figure group
Figure 1
Unfolded $k_{\text{T,g}}$ spectra for splittings selected by dynamical grooming $a = 1.0$ (left) and soft drop $z_{\text{cut}} = 0.2$ (right) in pp and semicentral and central Pb−Pb collisions. The jets are measured with $R=0.2$ in the $60 < p_{\text{T,ch jet}} < 80$ GeV/$c$ interval. Statistical uncertainties are represented by bars, while systematic uncertainties are shown in shaded boxes. |  |
Figure 2
Ratio of $k_{\text{T,g}}$ distributions for data and model calculations to a smooth parametrization of the data, selected by dynamical grooming $a = 1.0$ (left) and soft drop $z_{\text{cut}} = 0.2$ (right). Data points are shown in black, with statistical (error bars) and systematic (grey boxes) uncertainties. The bands for the model calculations show statistical uncertainties. |  |
Figure 3
Ratio of the $k_{\text{T,g}}$ distributions measured in Pb−Pb and pp collisions for dynamical grooming $a = 1.0$ (left) and SD ($z_{\text{cut}} = 0.2$) (right), with comparison to model calculations. Statistical uncertainties are shown as error bars and systematic uncertainties are shown as grey shaded boxes for the measured ratios. The width of the colored bands corresponds to the statistical uncertainties in the model calculations. |  |
Figure A.1
Subleading subjet purity for soft drop $z_{\text{cut}} = 0.2$ and dynamical grooming $a = 1.0$ applied to jets found in semicentral (left) and central (right) Pb−Pb collisions. Closed markers correspond to the standard grooming algorithms, while open markers represent dynamical grooming $a = 1.0$ with a minimum $k^{\text{meas.}}_{\text{T,g}}$ requirement. Statistical uncertainties are represented by bars. | 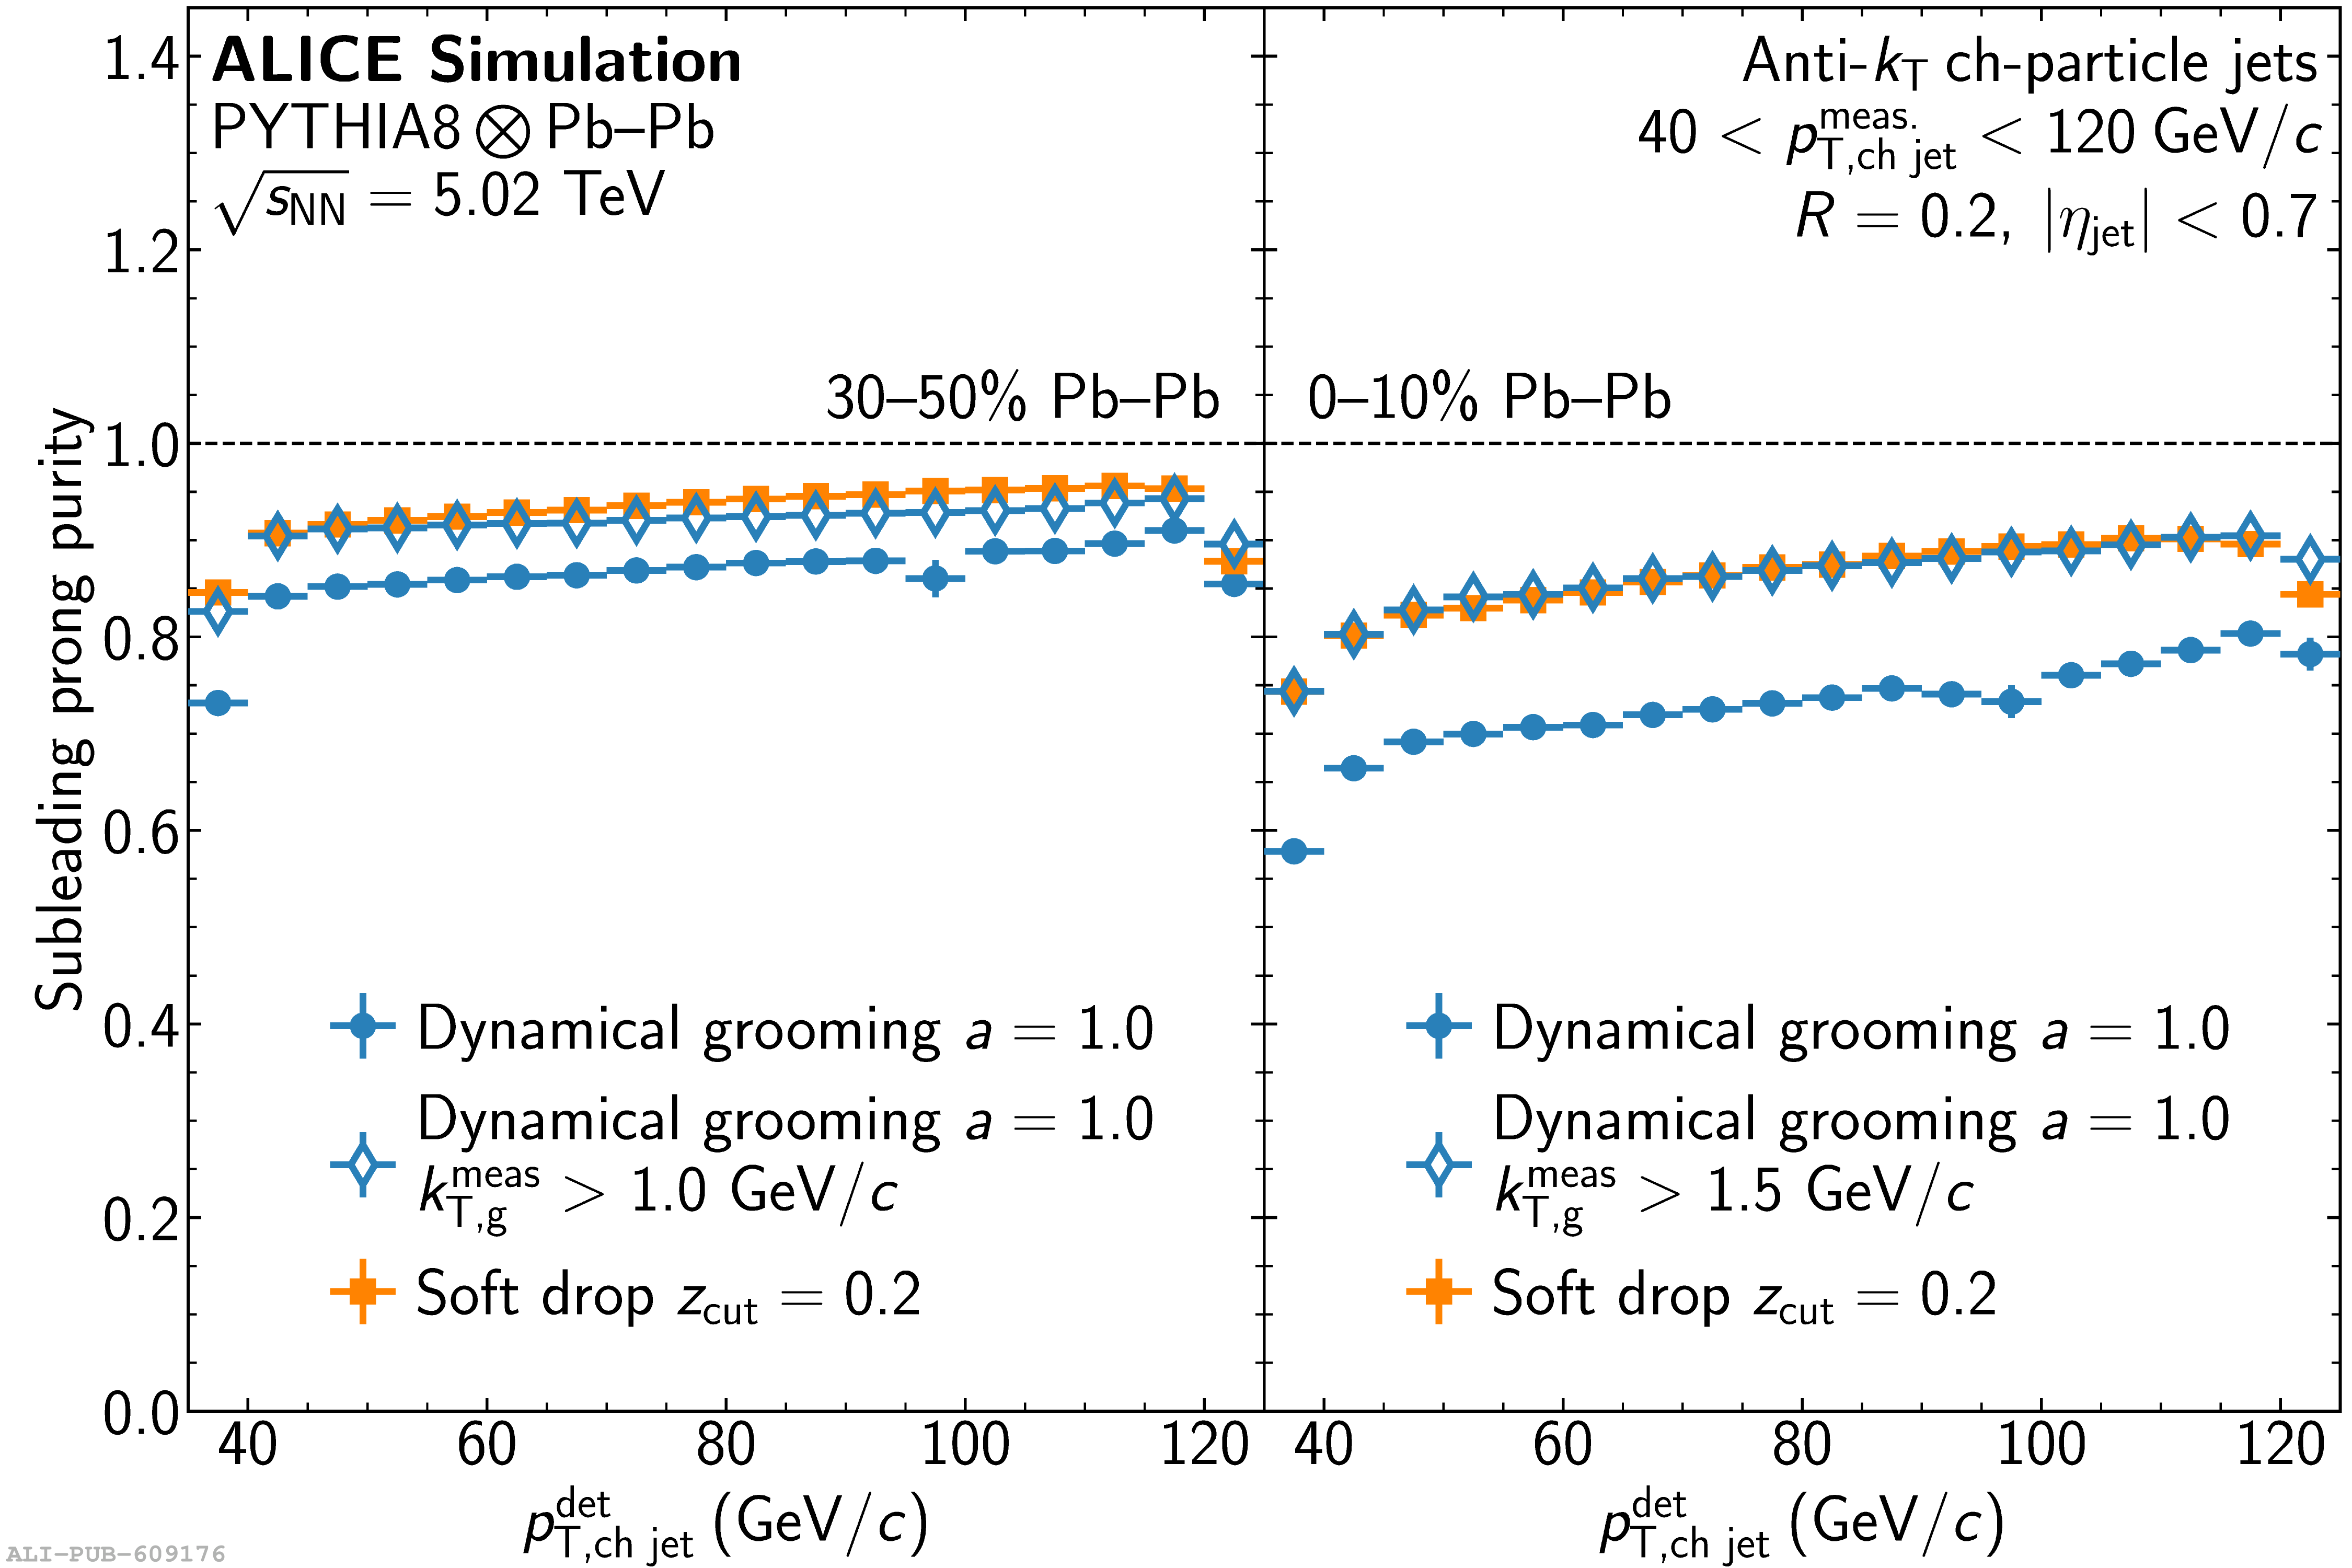 |