Upper panels: The measured and fully corrected $S_0^{p_{\rm T}=1}$ distributions. Lower panels: Ratio between model calculations and experimental data. These are presented for $N_{\rm tracklets}^{|\eta|< 0.8}$ I (top), I-III (middle) and V0M I (bottom). The roman numerals I (I-III) correspond the top 0--1\% (0--10\%) multiplicity for each respective estimator. The curves represent different model predictions, where the shaded area represents the statistical uncertainty of the models. The relative systematic uncertainty is shown as a gray area around unity in the lower panels. | 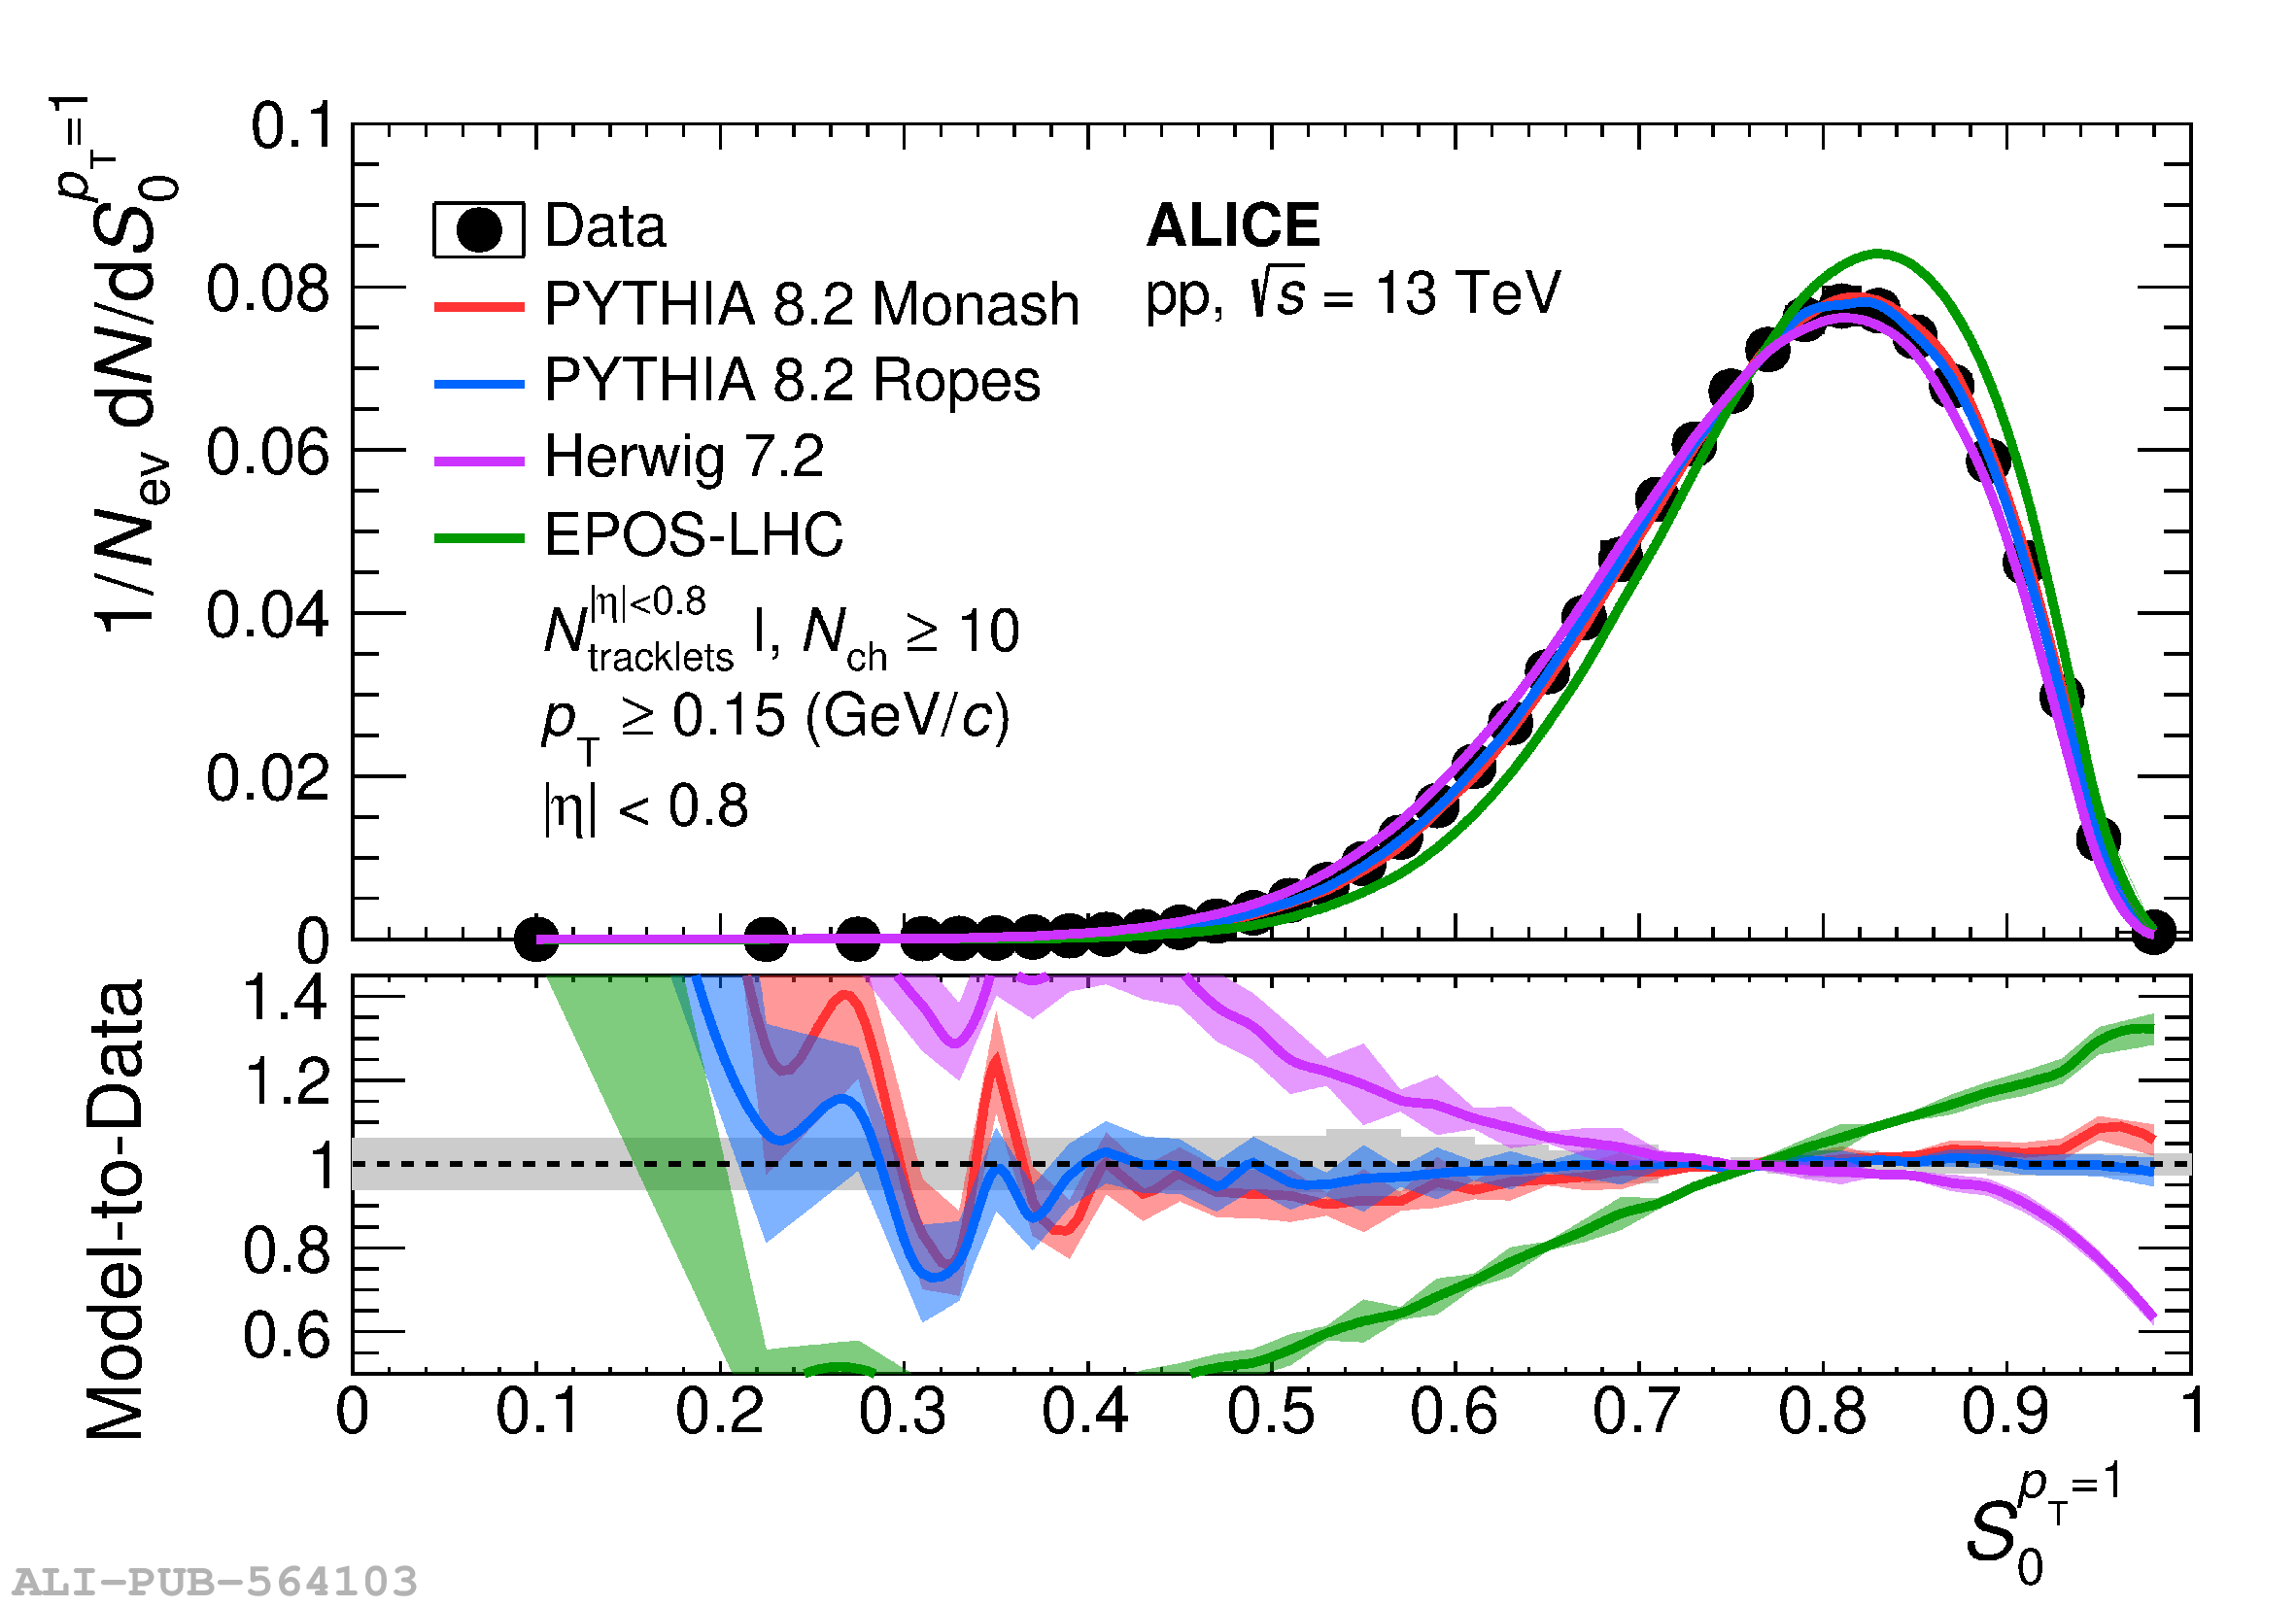 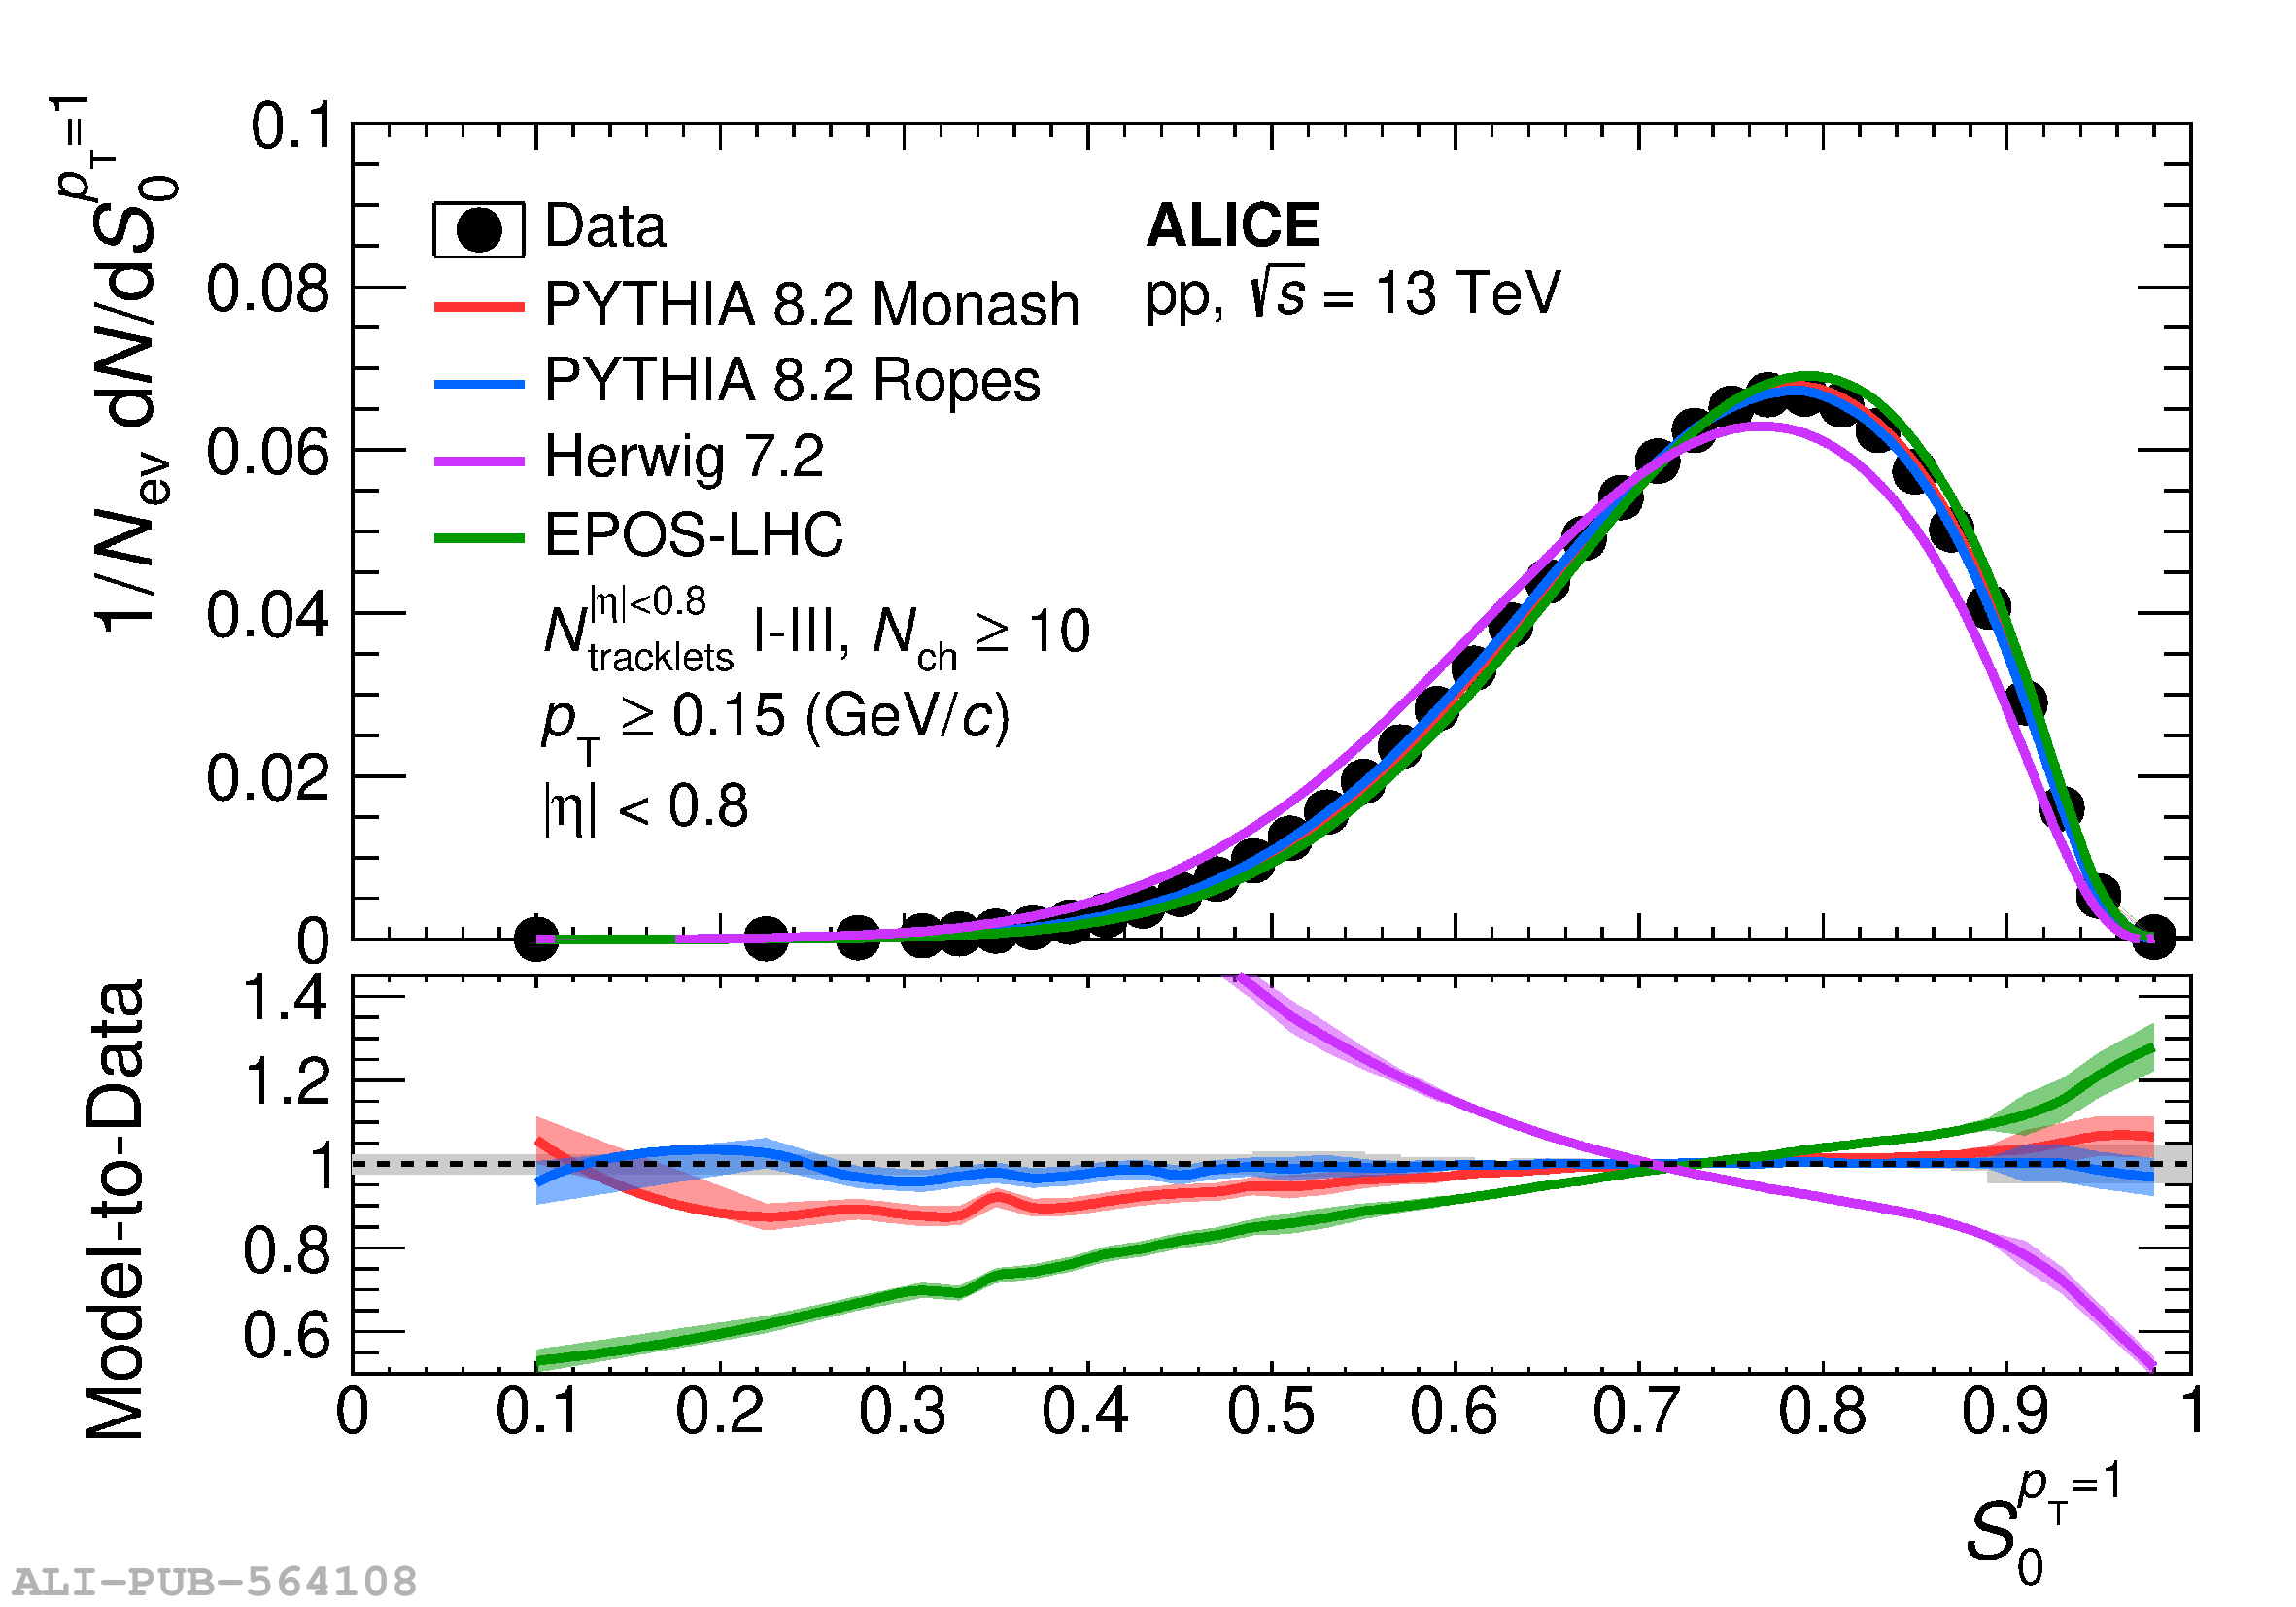 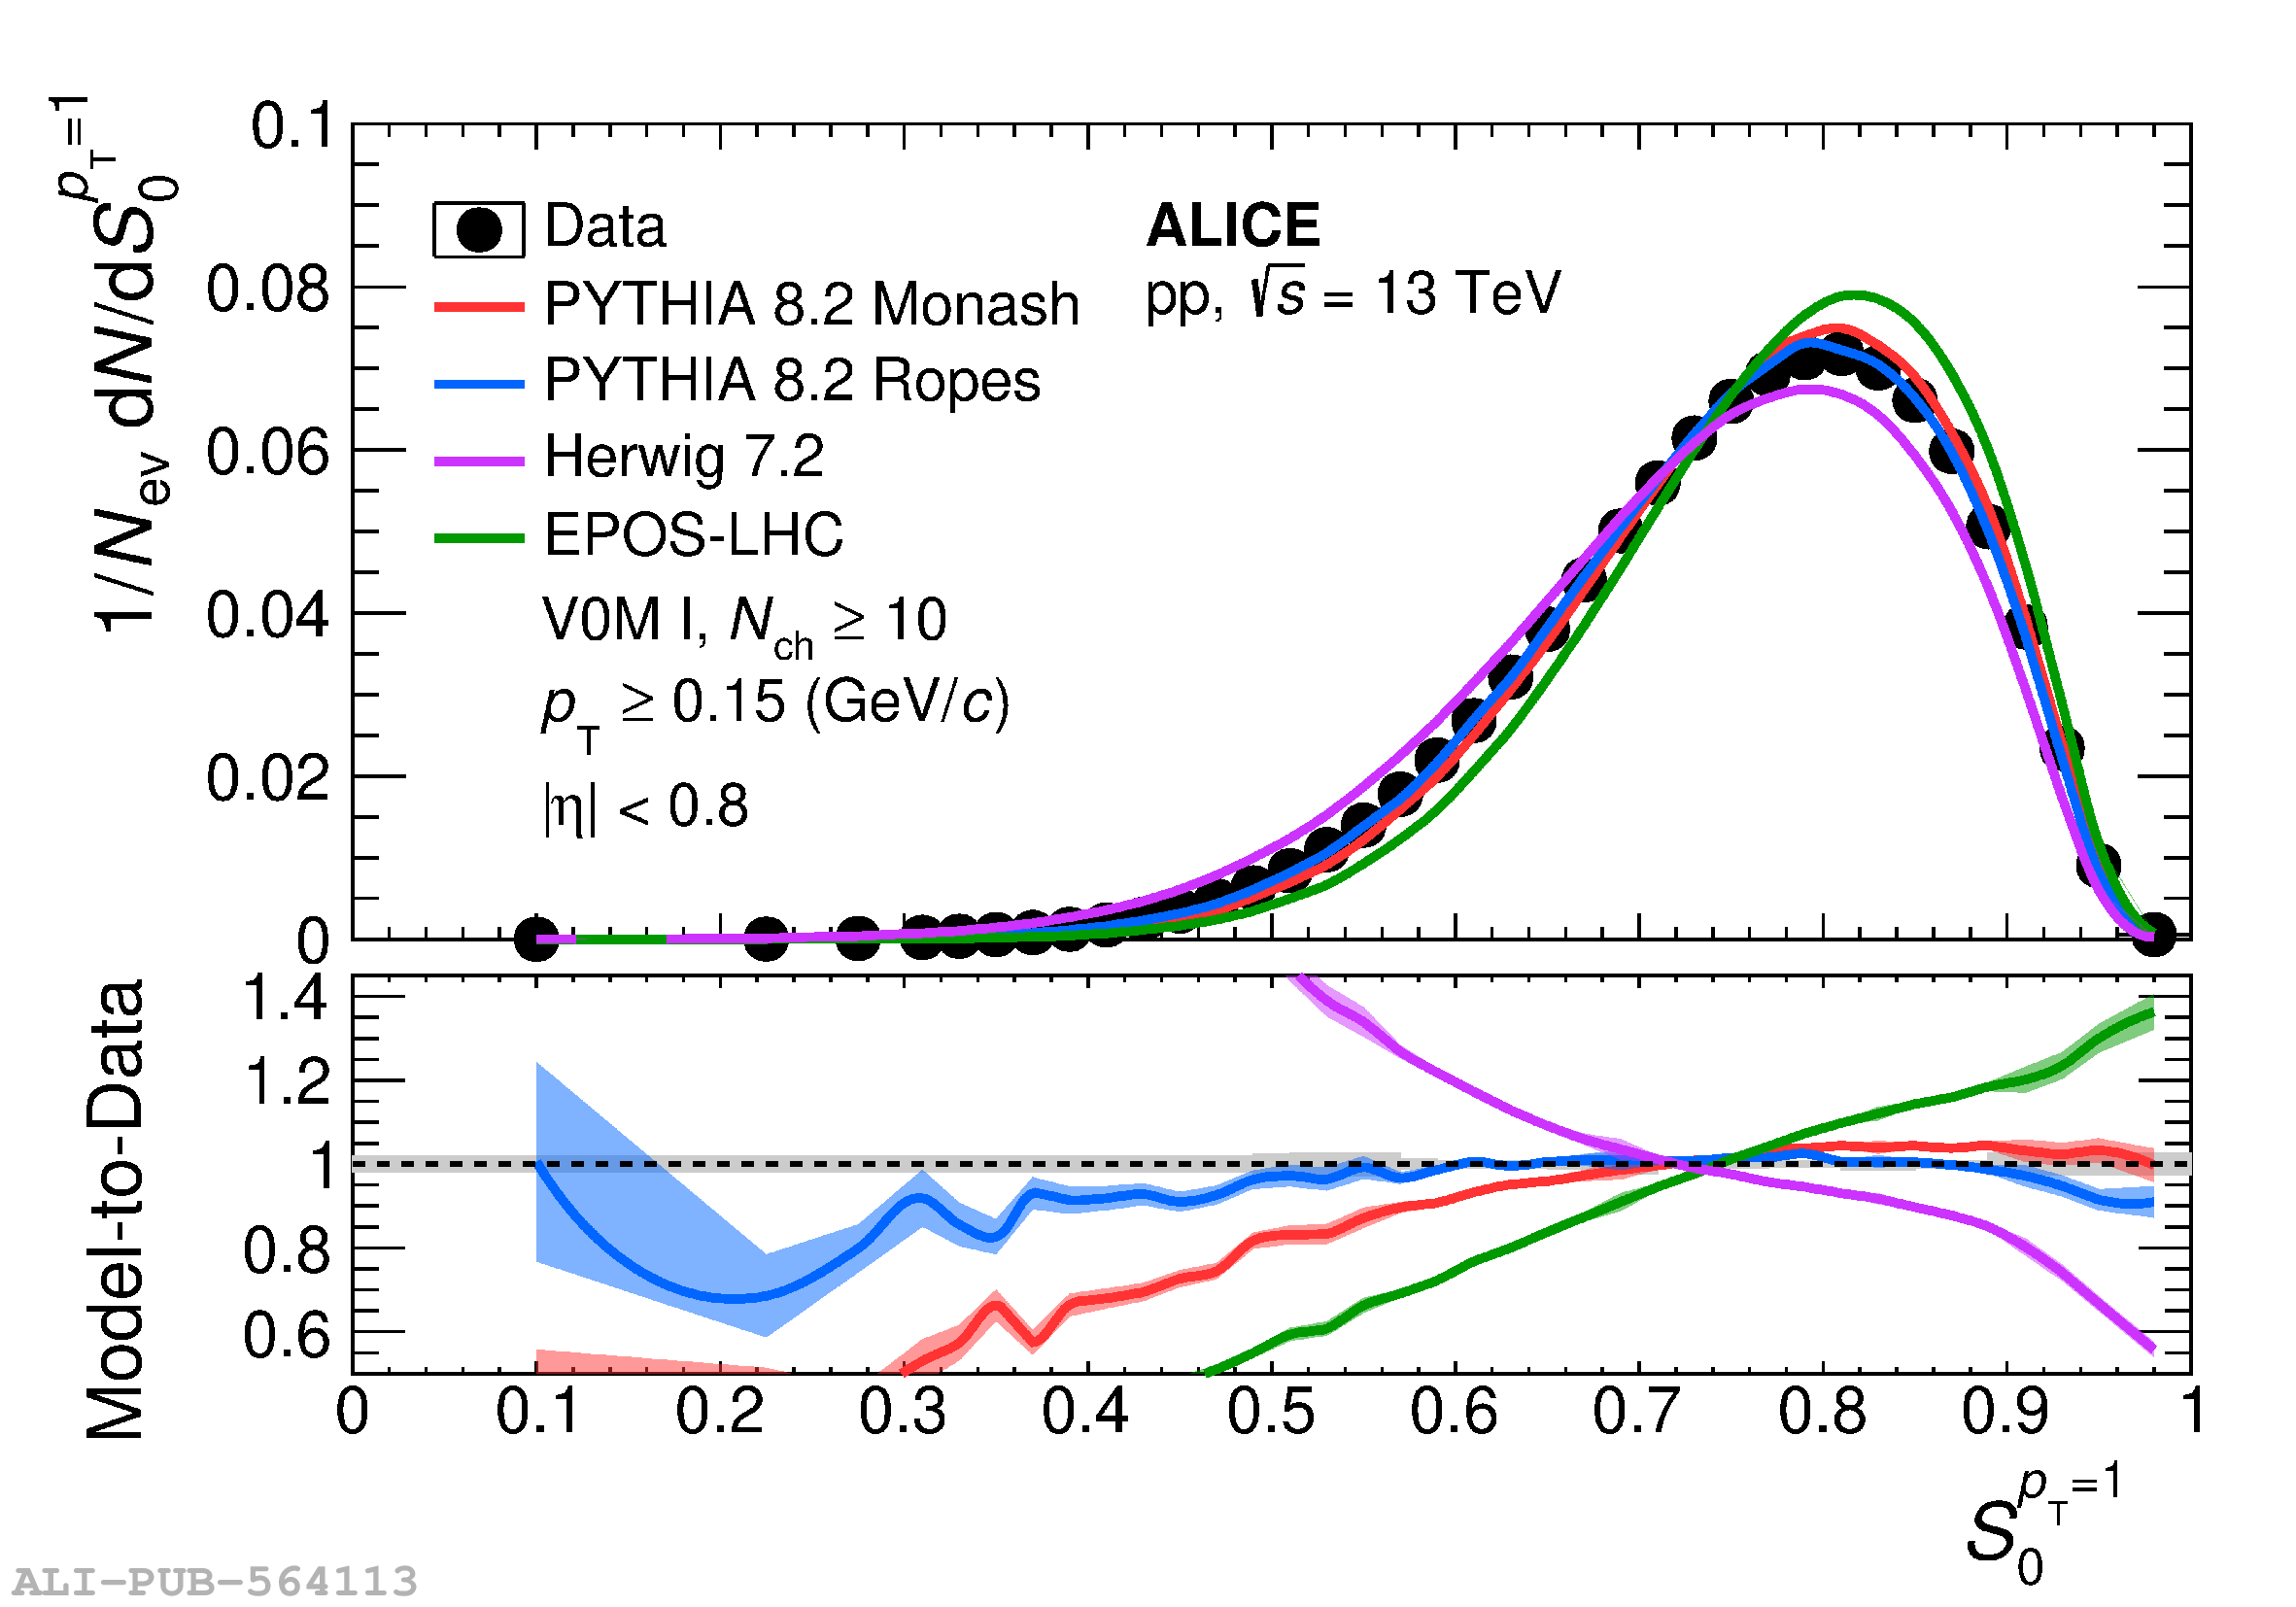 |