$\pt$-differential production cross sections for prompt D mesons in comparison with pQCD calculations: FONLL , GM-VFNS , and $k_{\mathrm{T}}$-factorisation . The uncertainty on the predictions is depicted as coloured boxes The ratios of the data to the theoretical predictions are shown in the lower part of each panel. The statistical (systematic) uncertainties are depicted as vertical bars (boxes). | 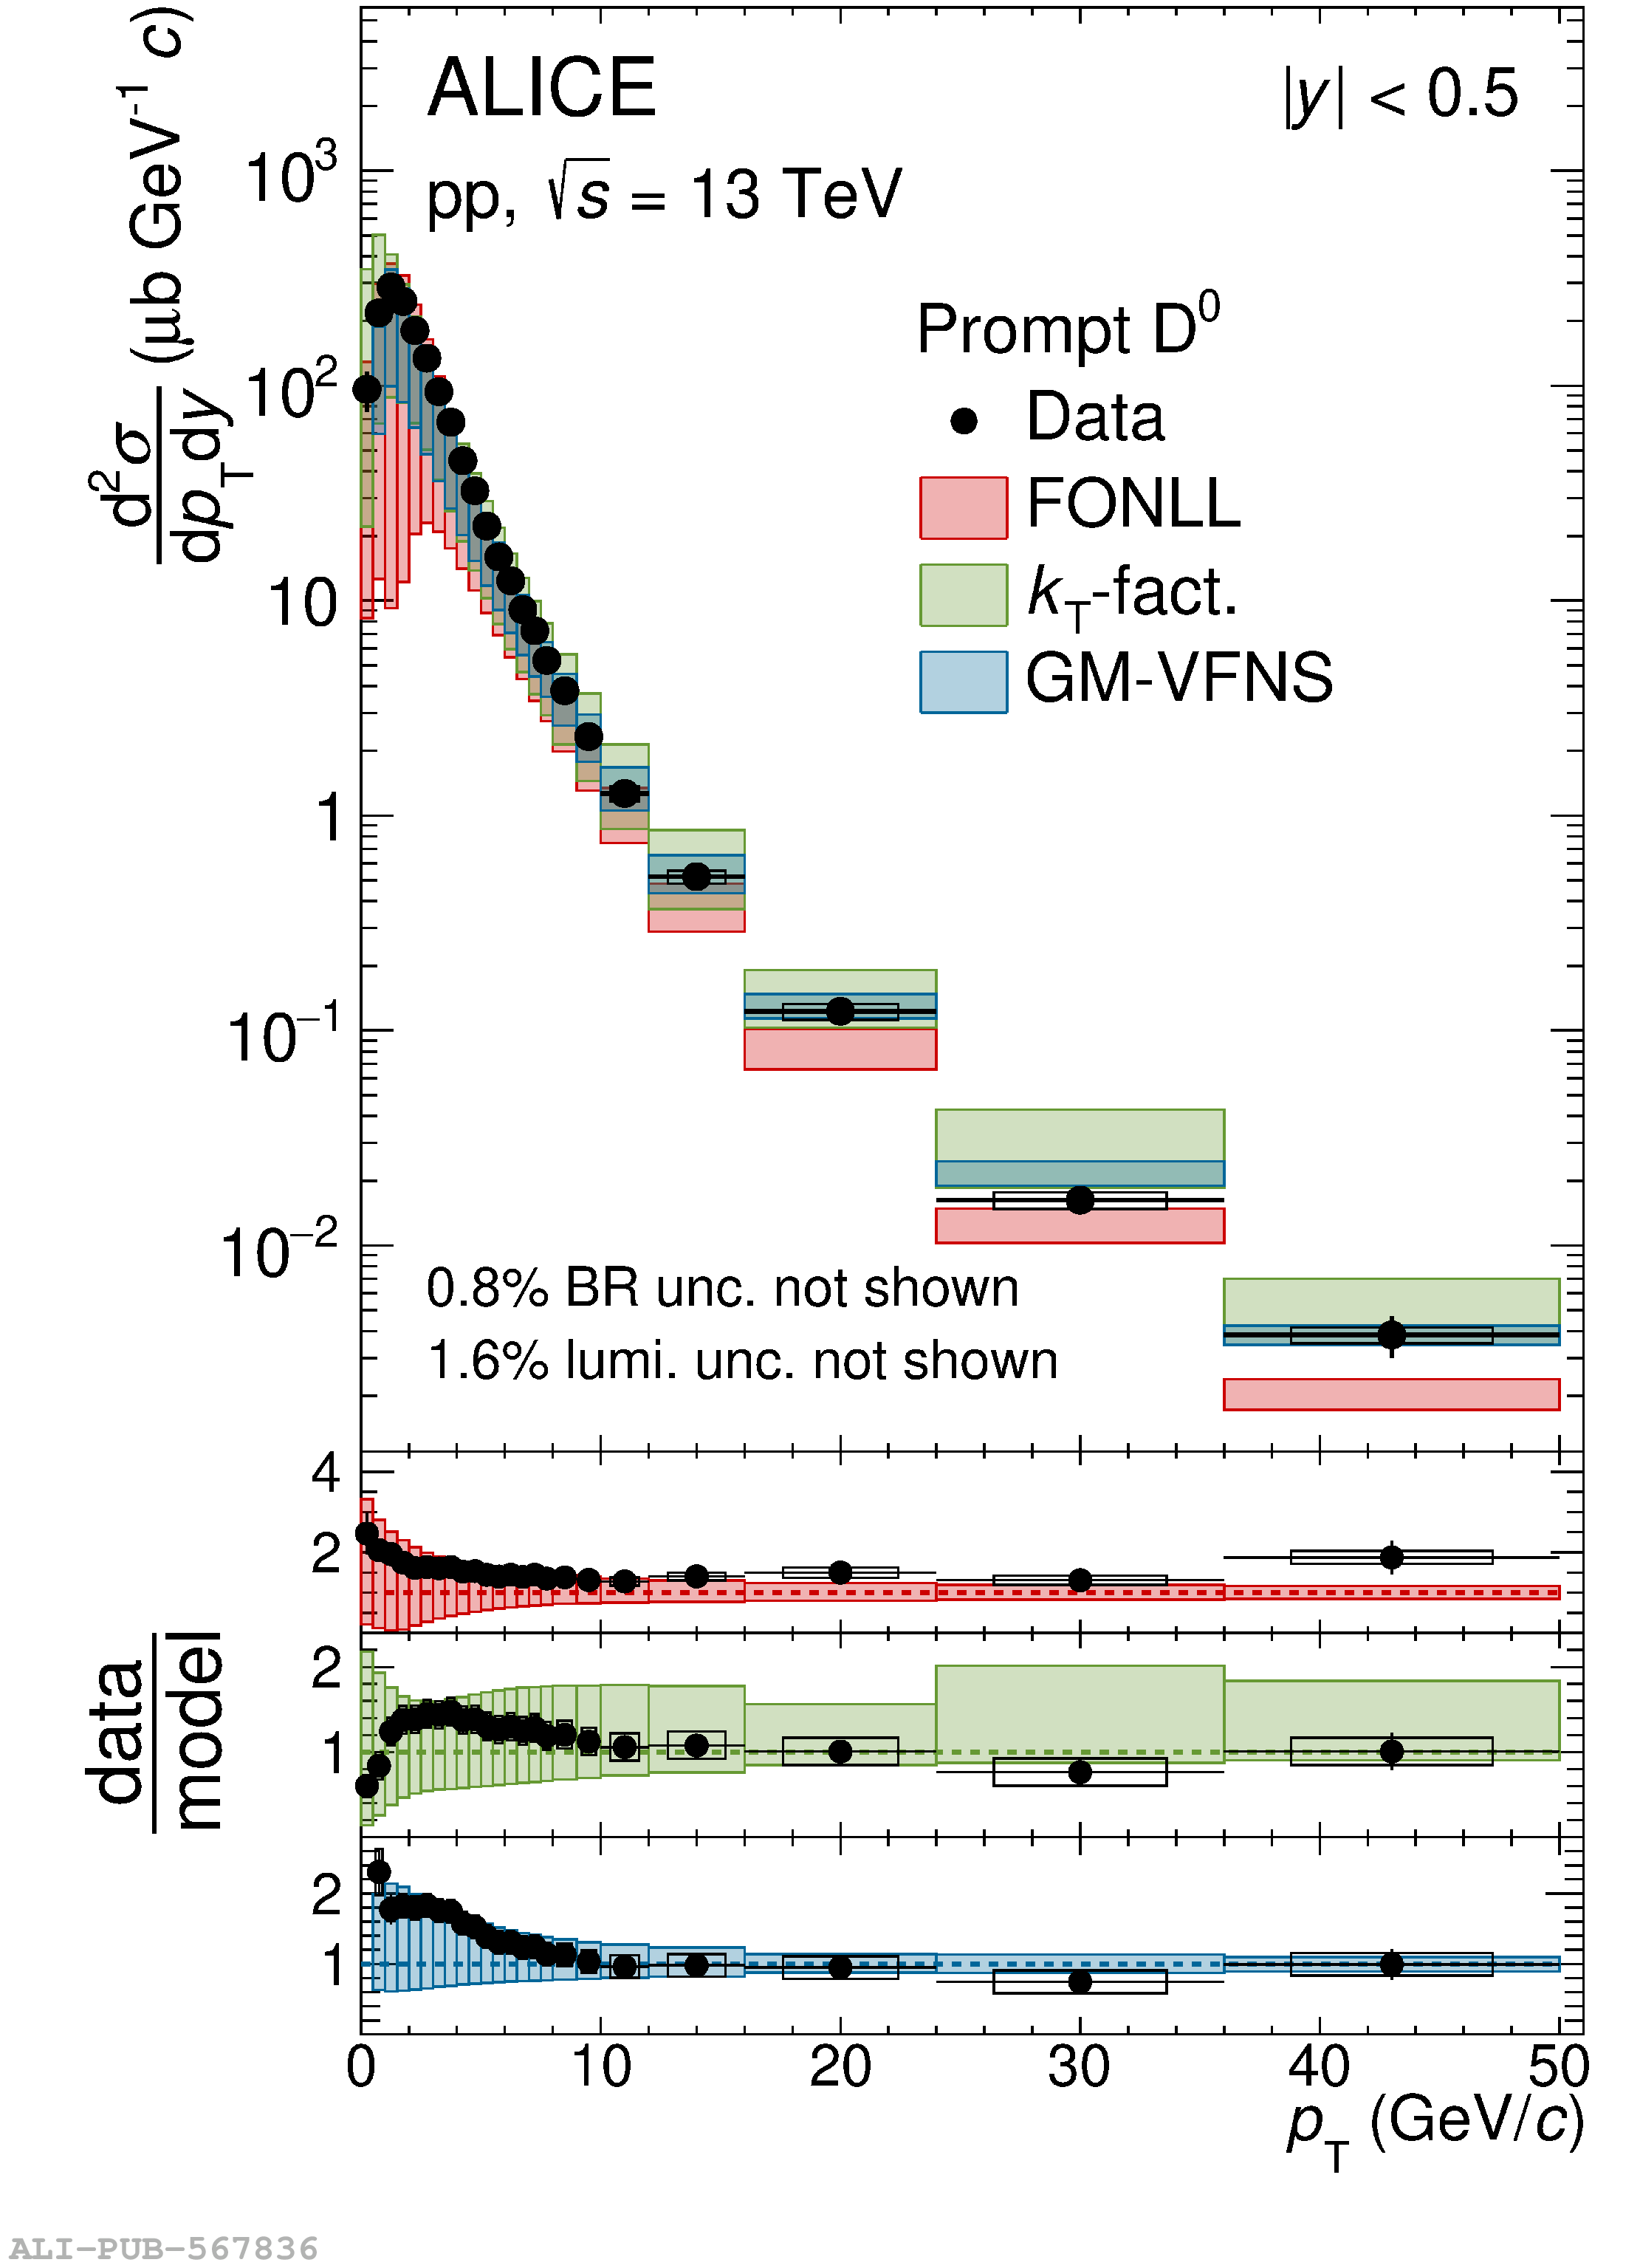 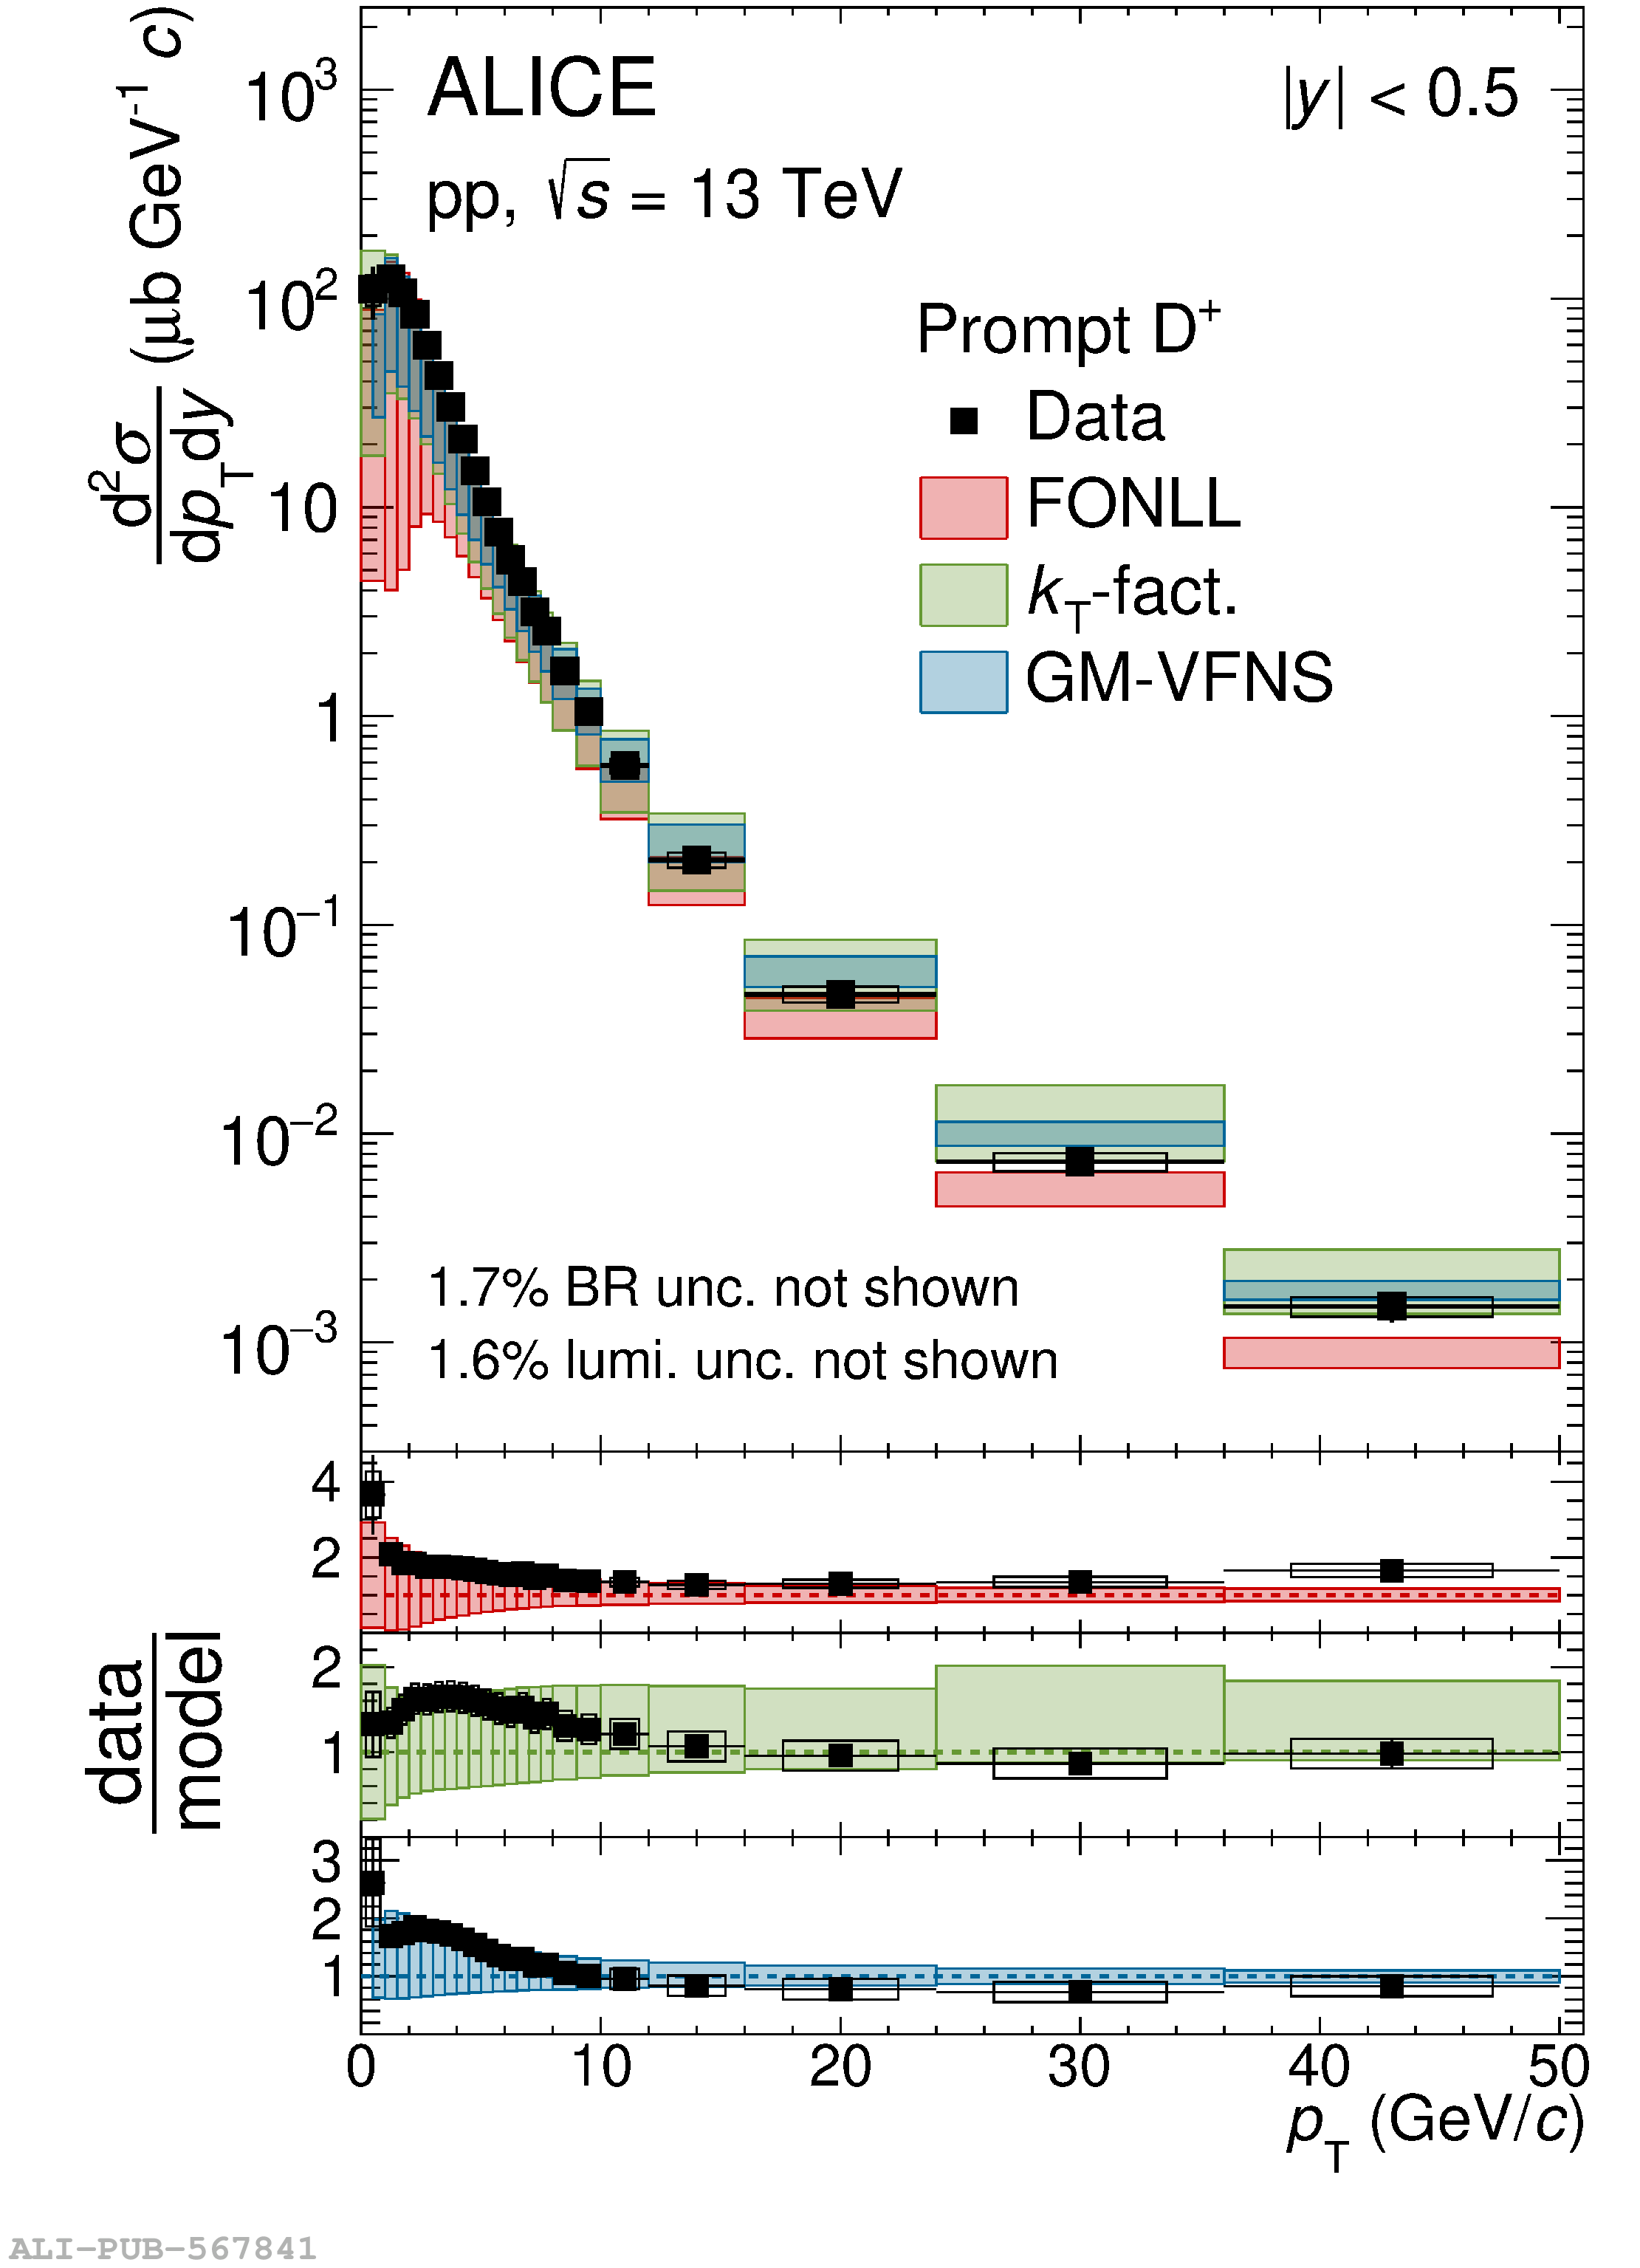 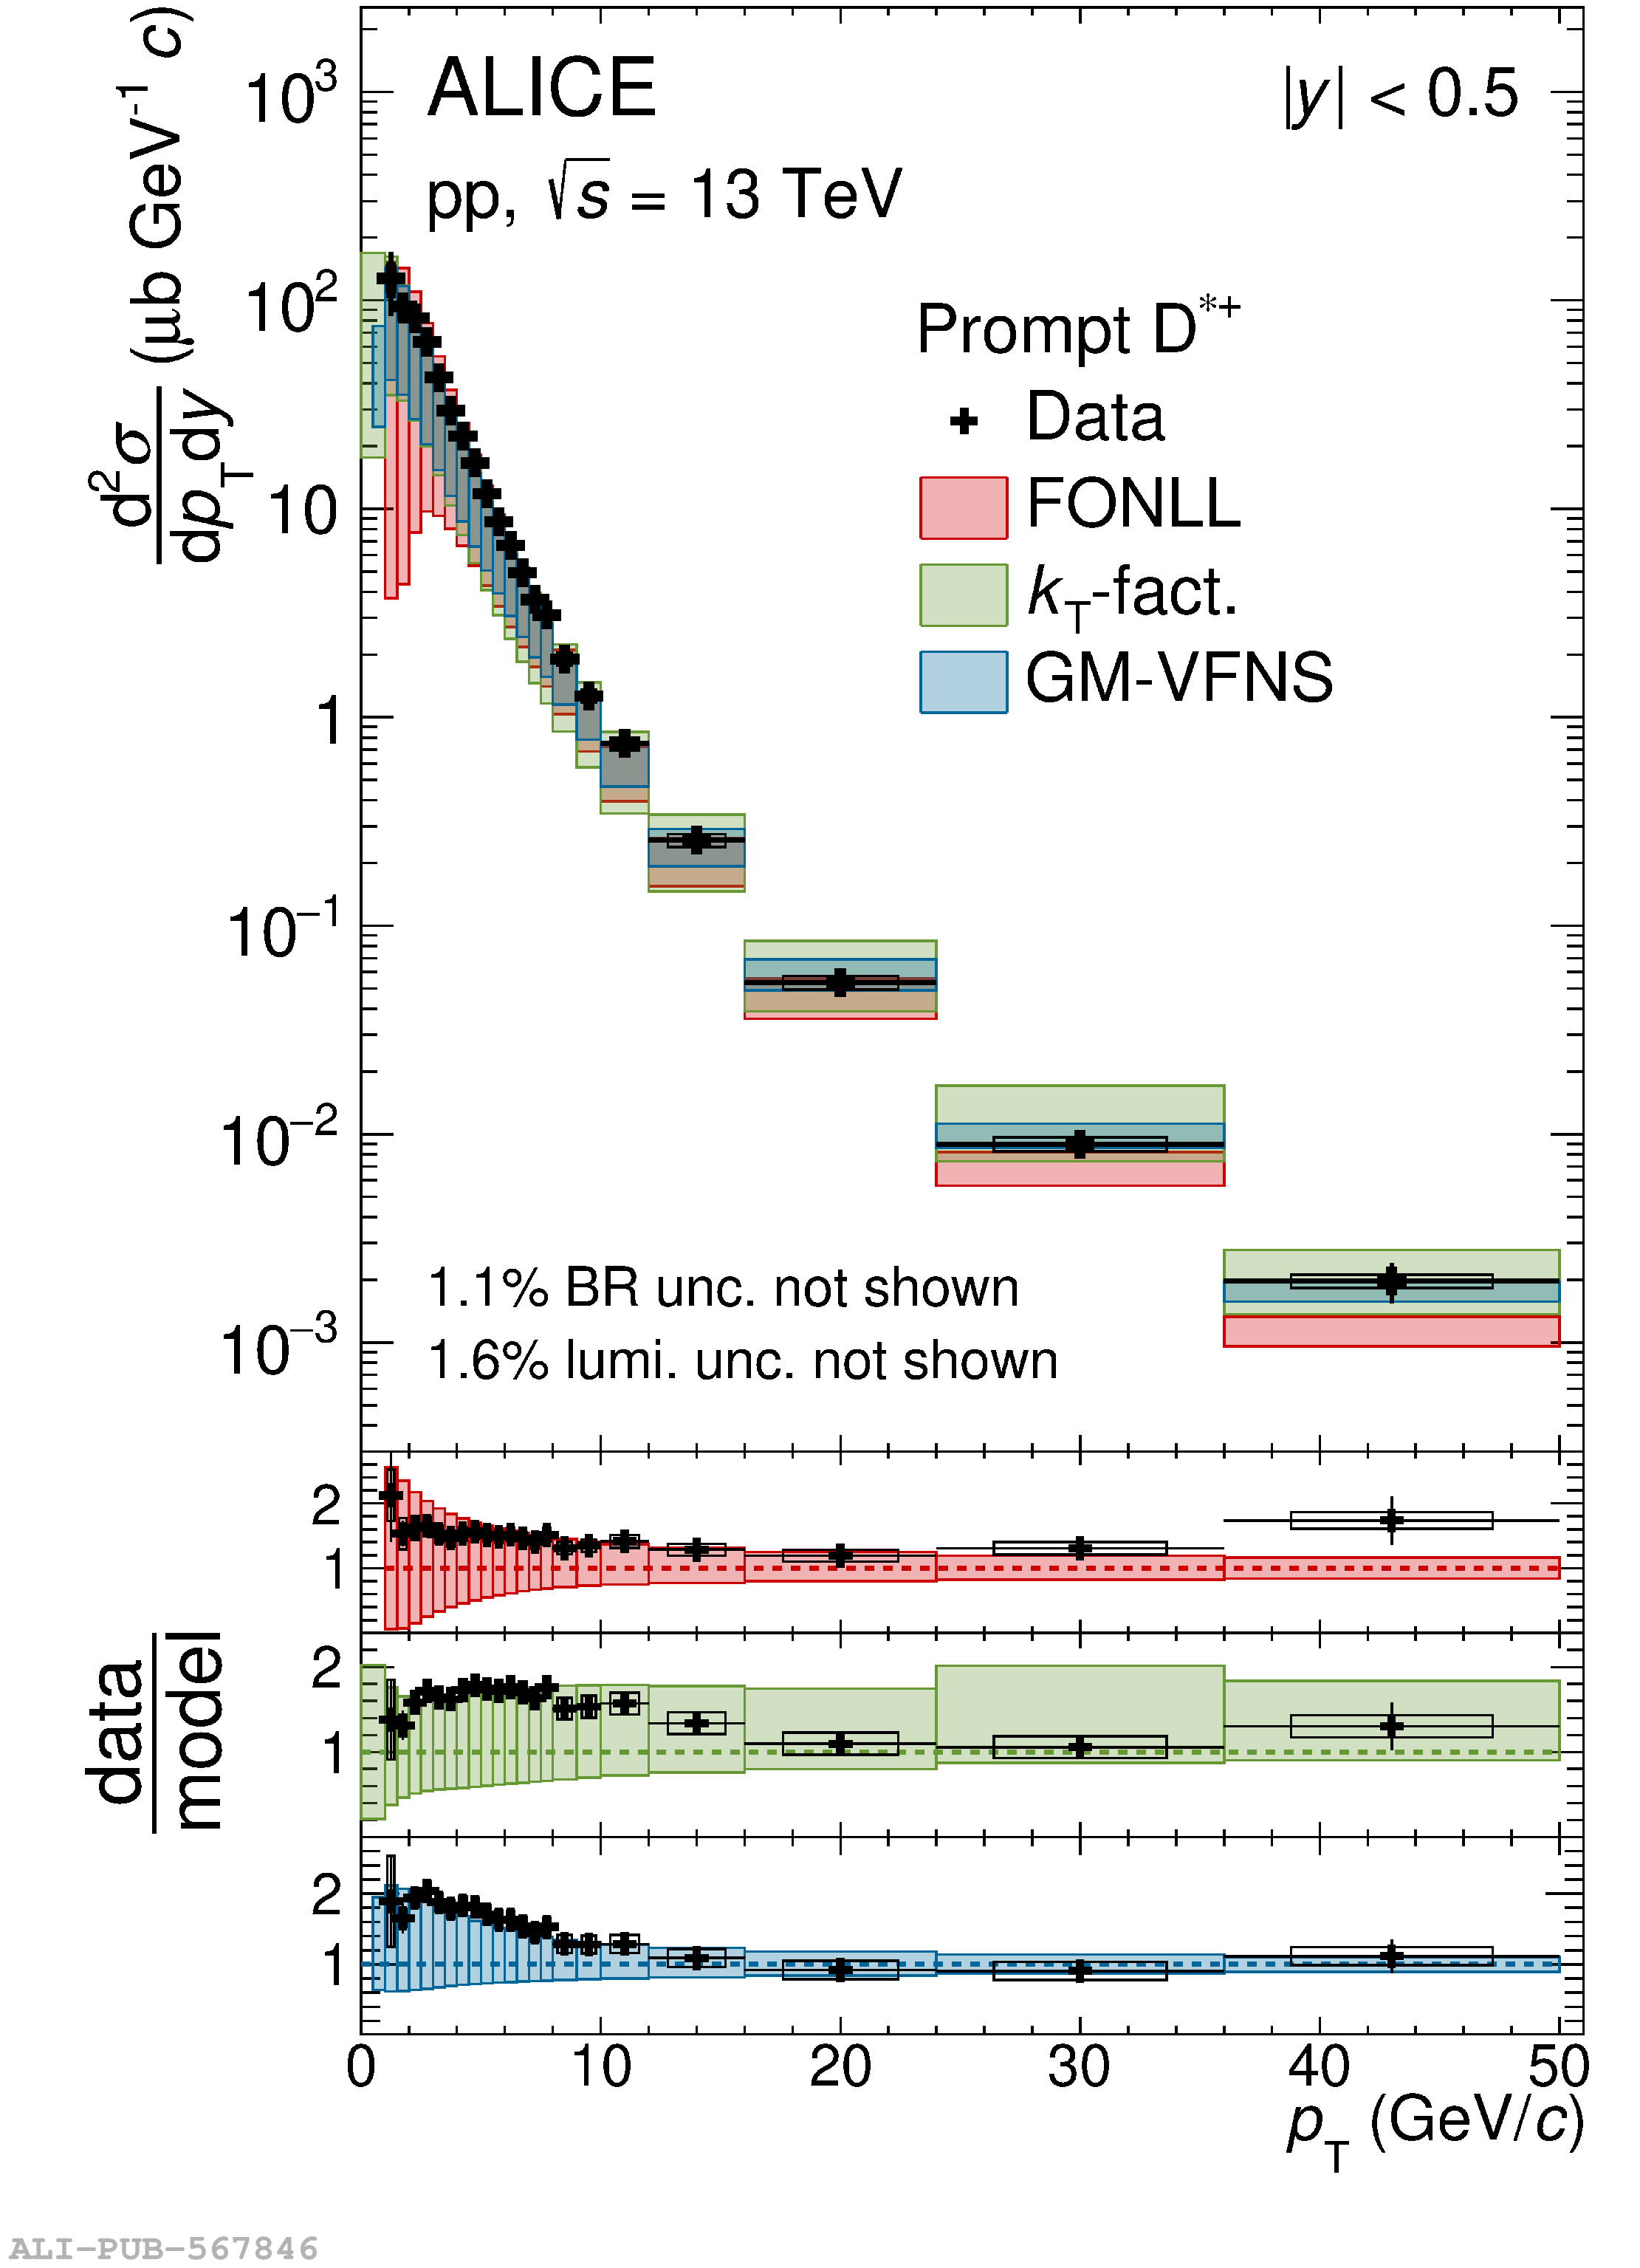 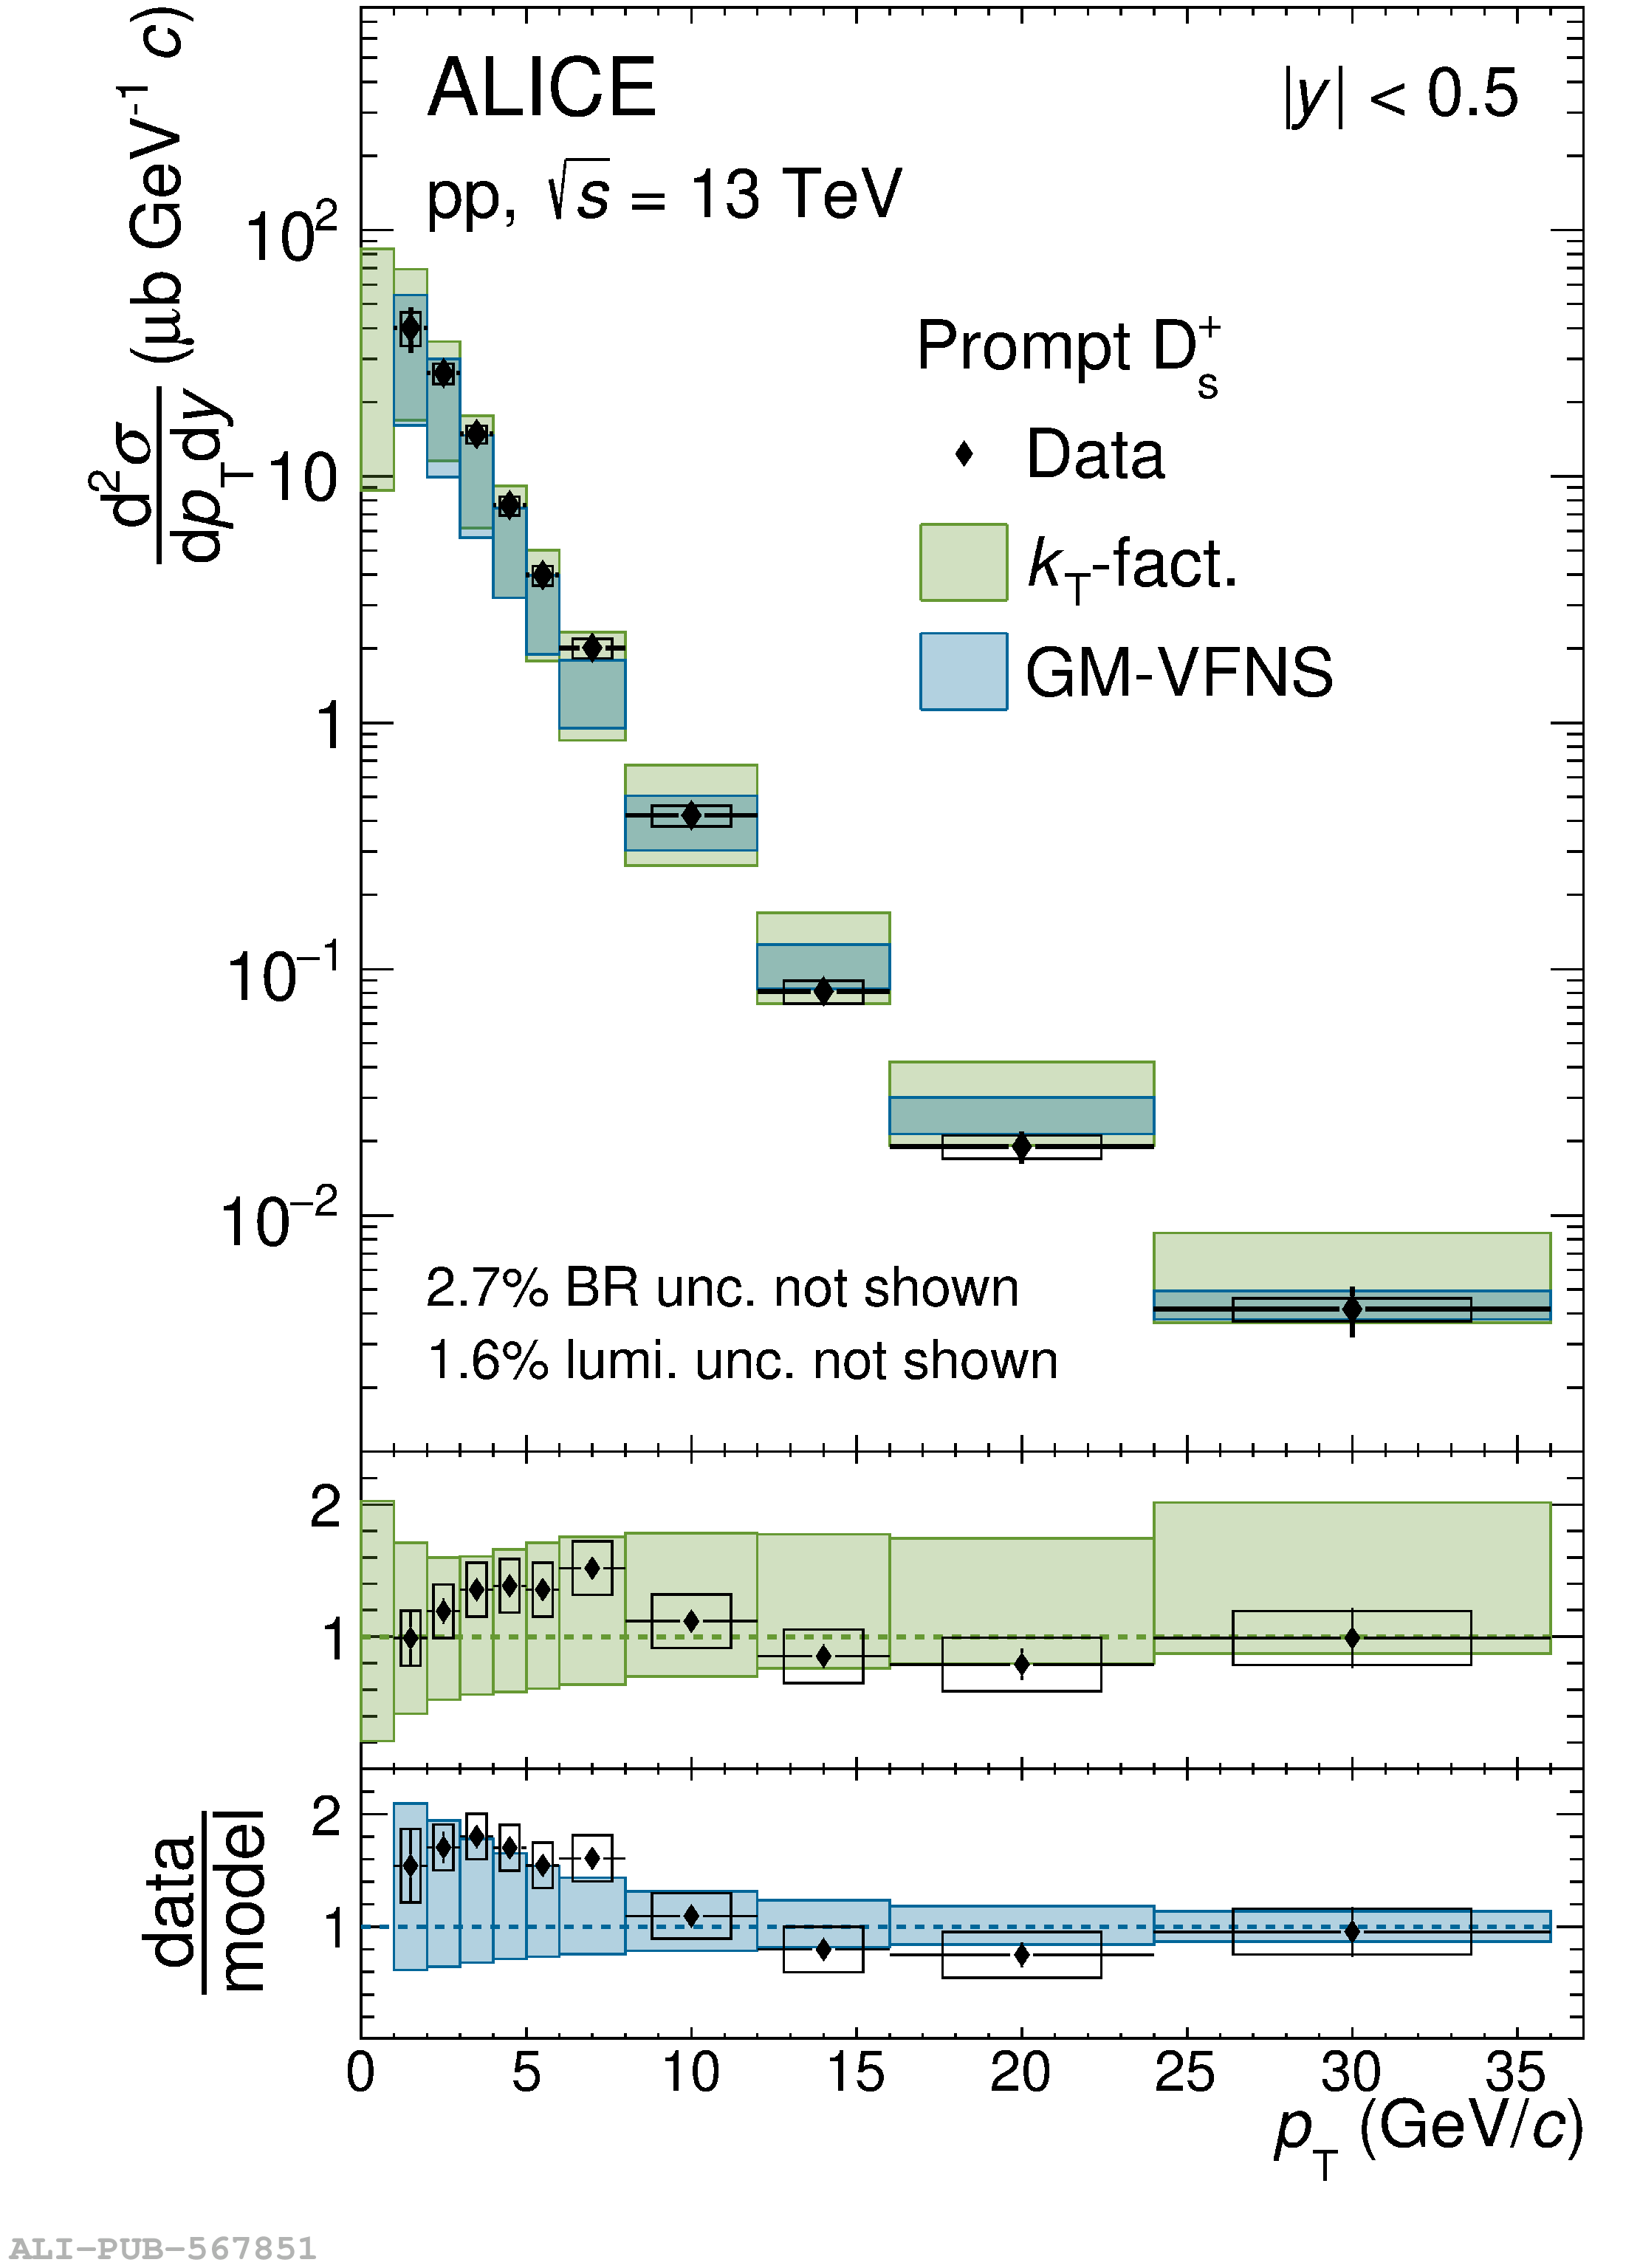 |