Invariant mass or mass-difference distributions of $\Dzero$-meson candidates (top-left), $\Dplus$-meson candidates (top-right), $\Dstar$-meson candidates (bottom-left), $\Ds$-meson candidates (bottom-right), and charge conjugates in $0< \pt < 0.5$ GeV$/c$, $0< \pt < 1$ GeV$/c$, $1.5< \pt < 2.0$ GeV$/c$, and $1< \pt < 2$ GeV$/c$, respectively. The blue solid lines show the total fit functions as described in the text and the red dashed lines represent the background. In the case of $\Dzero$, the combinatorial background estimated with the track-rotation technique was subtracted, the red-dashed line is the residual background, and the green line represents the contribution of the reflections. In the case of $\Ds$, the peak at lower invariant mass represents the reconstructed $\Dplus\rightarrow {\rm K^+ K^-} \pip$ signal. The values of the mean ($\mu$) and the peak width ($\sigma$) of the signal peak are reported together with the signal counts (S). The reported uncertainties are only the statistical uncertainties from the fit. | 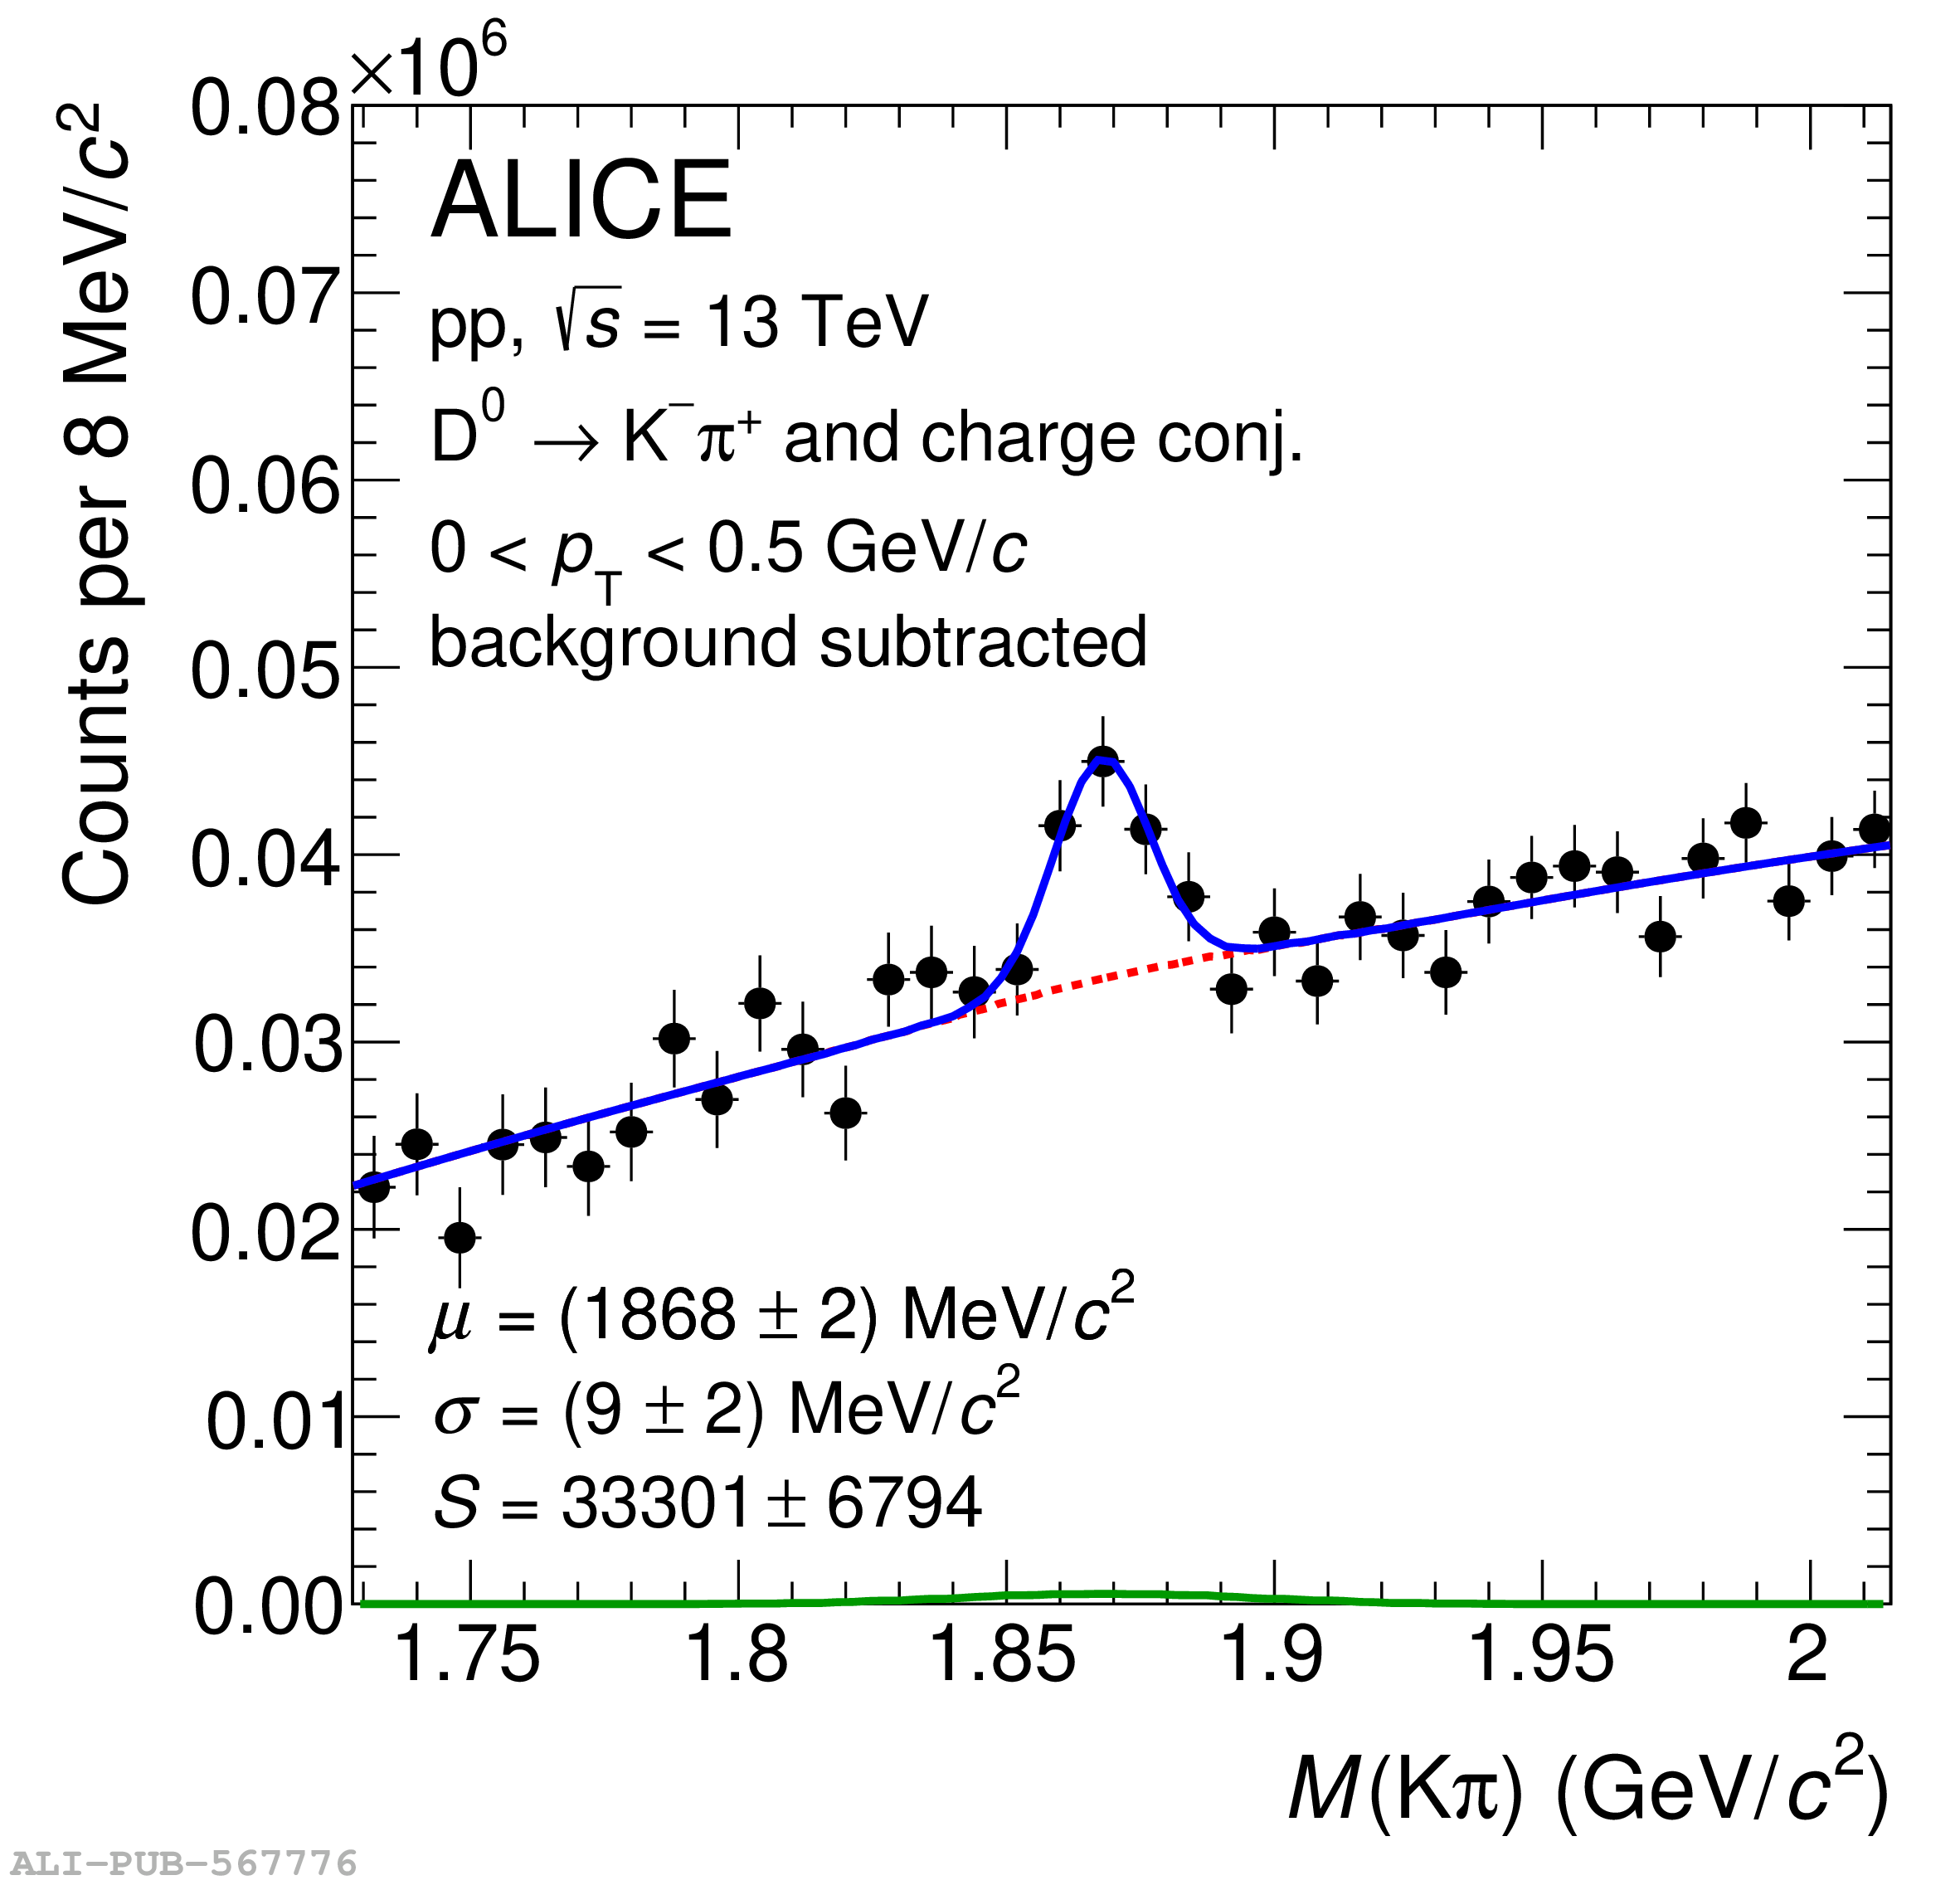 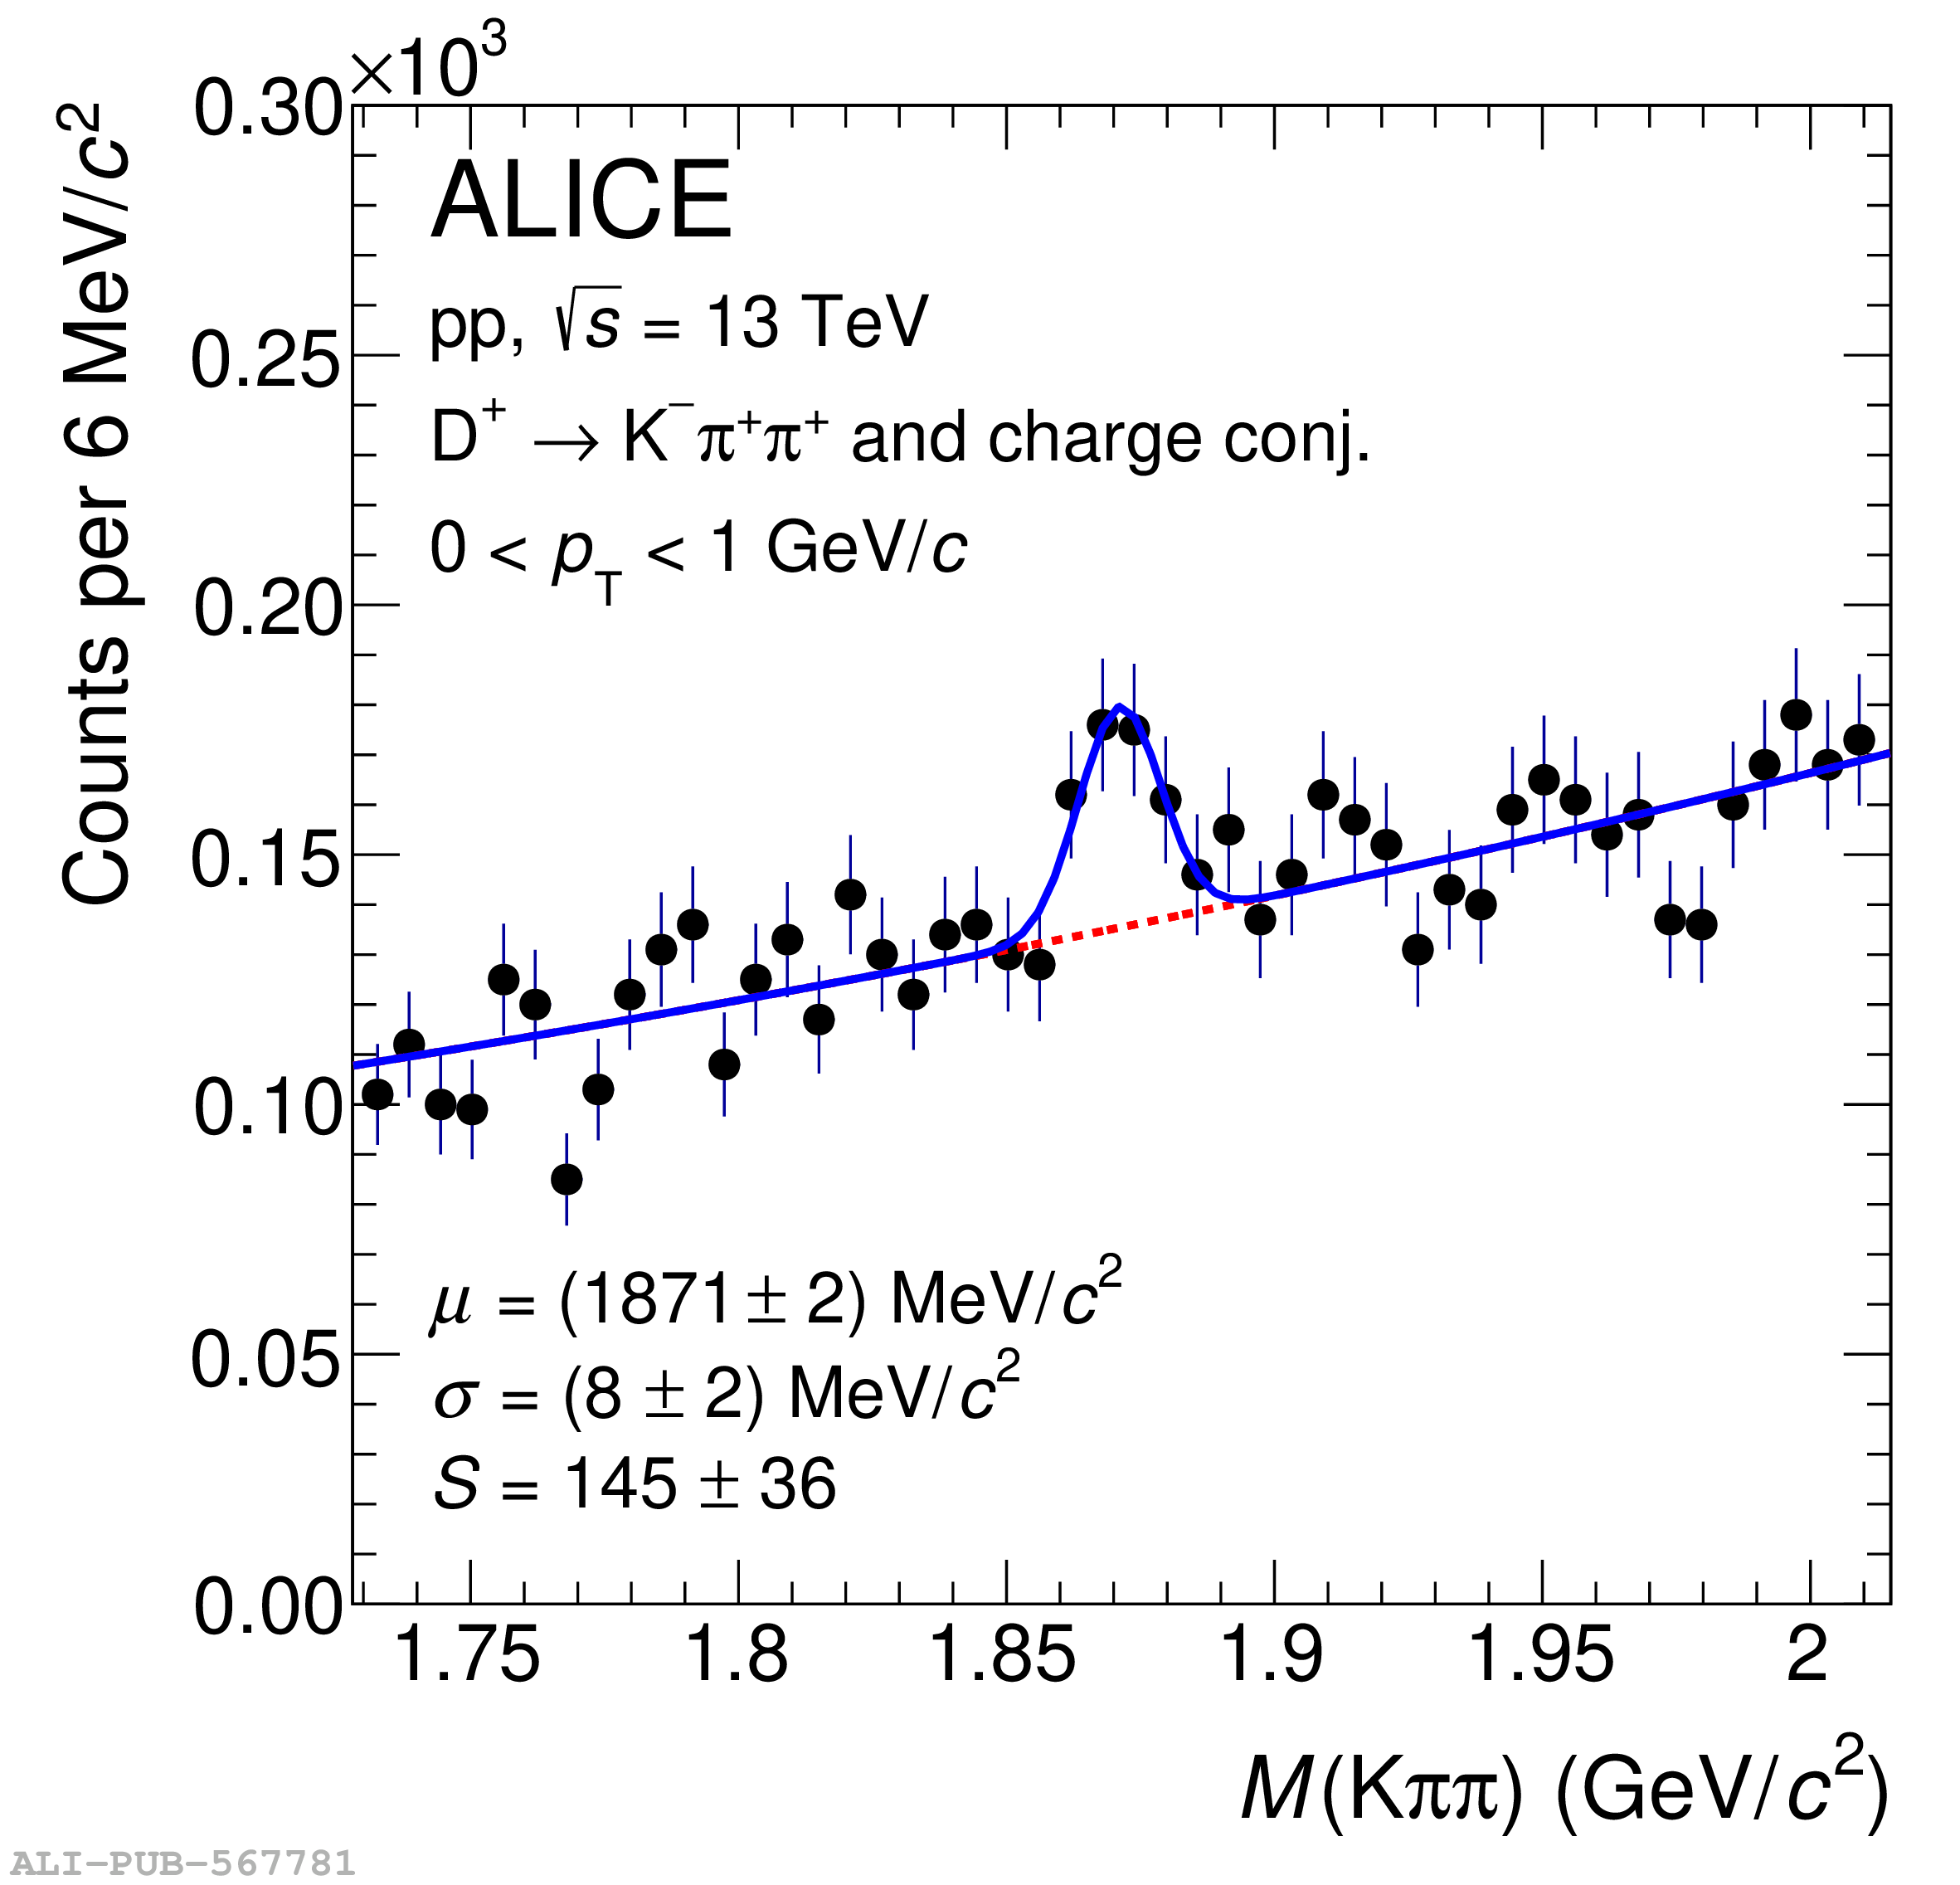 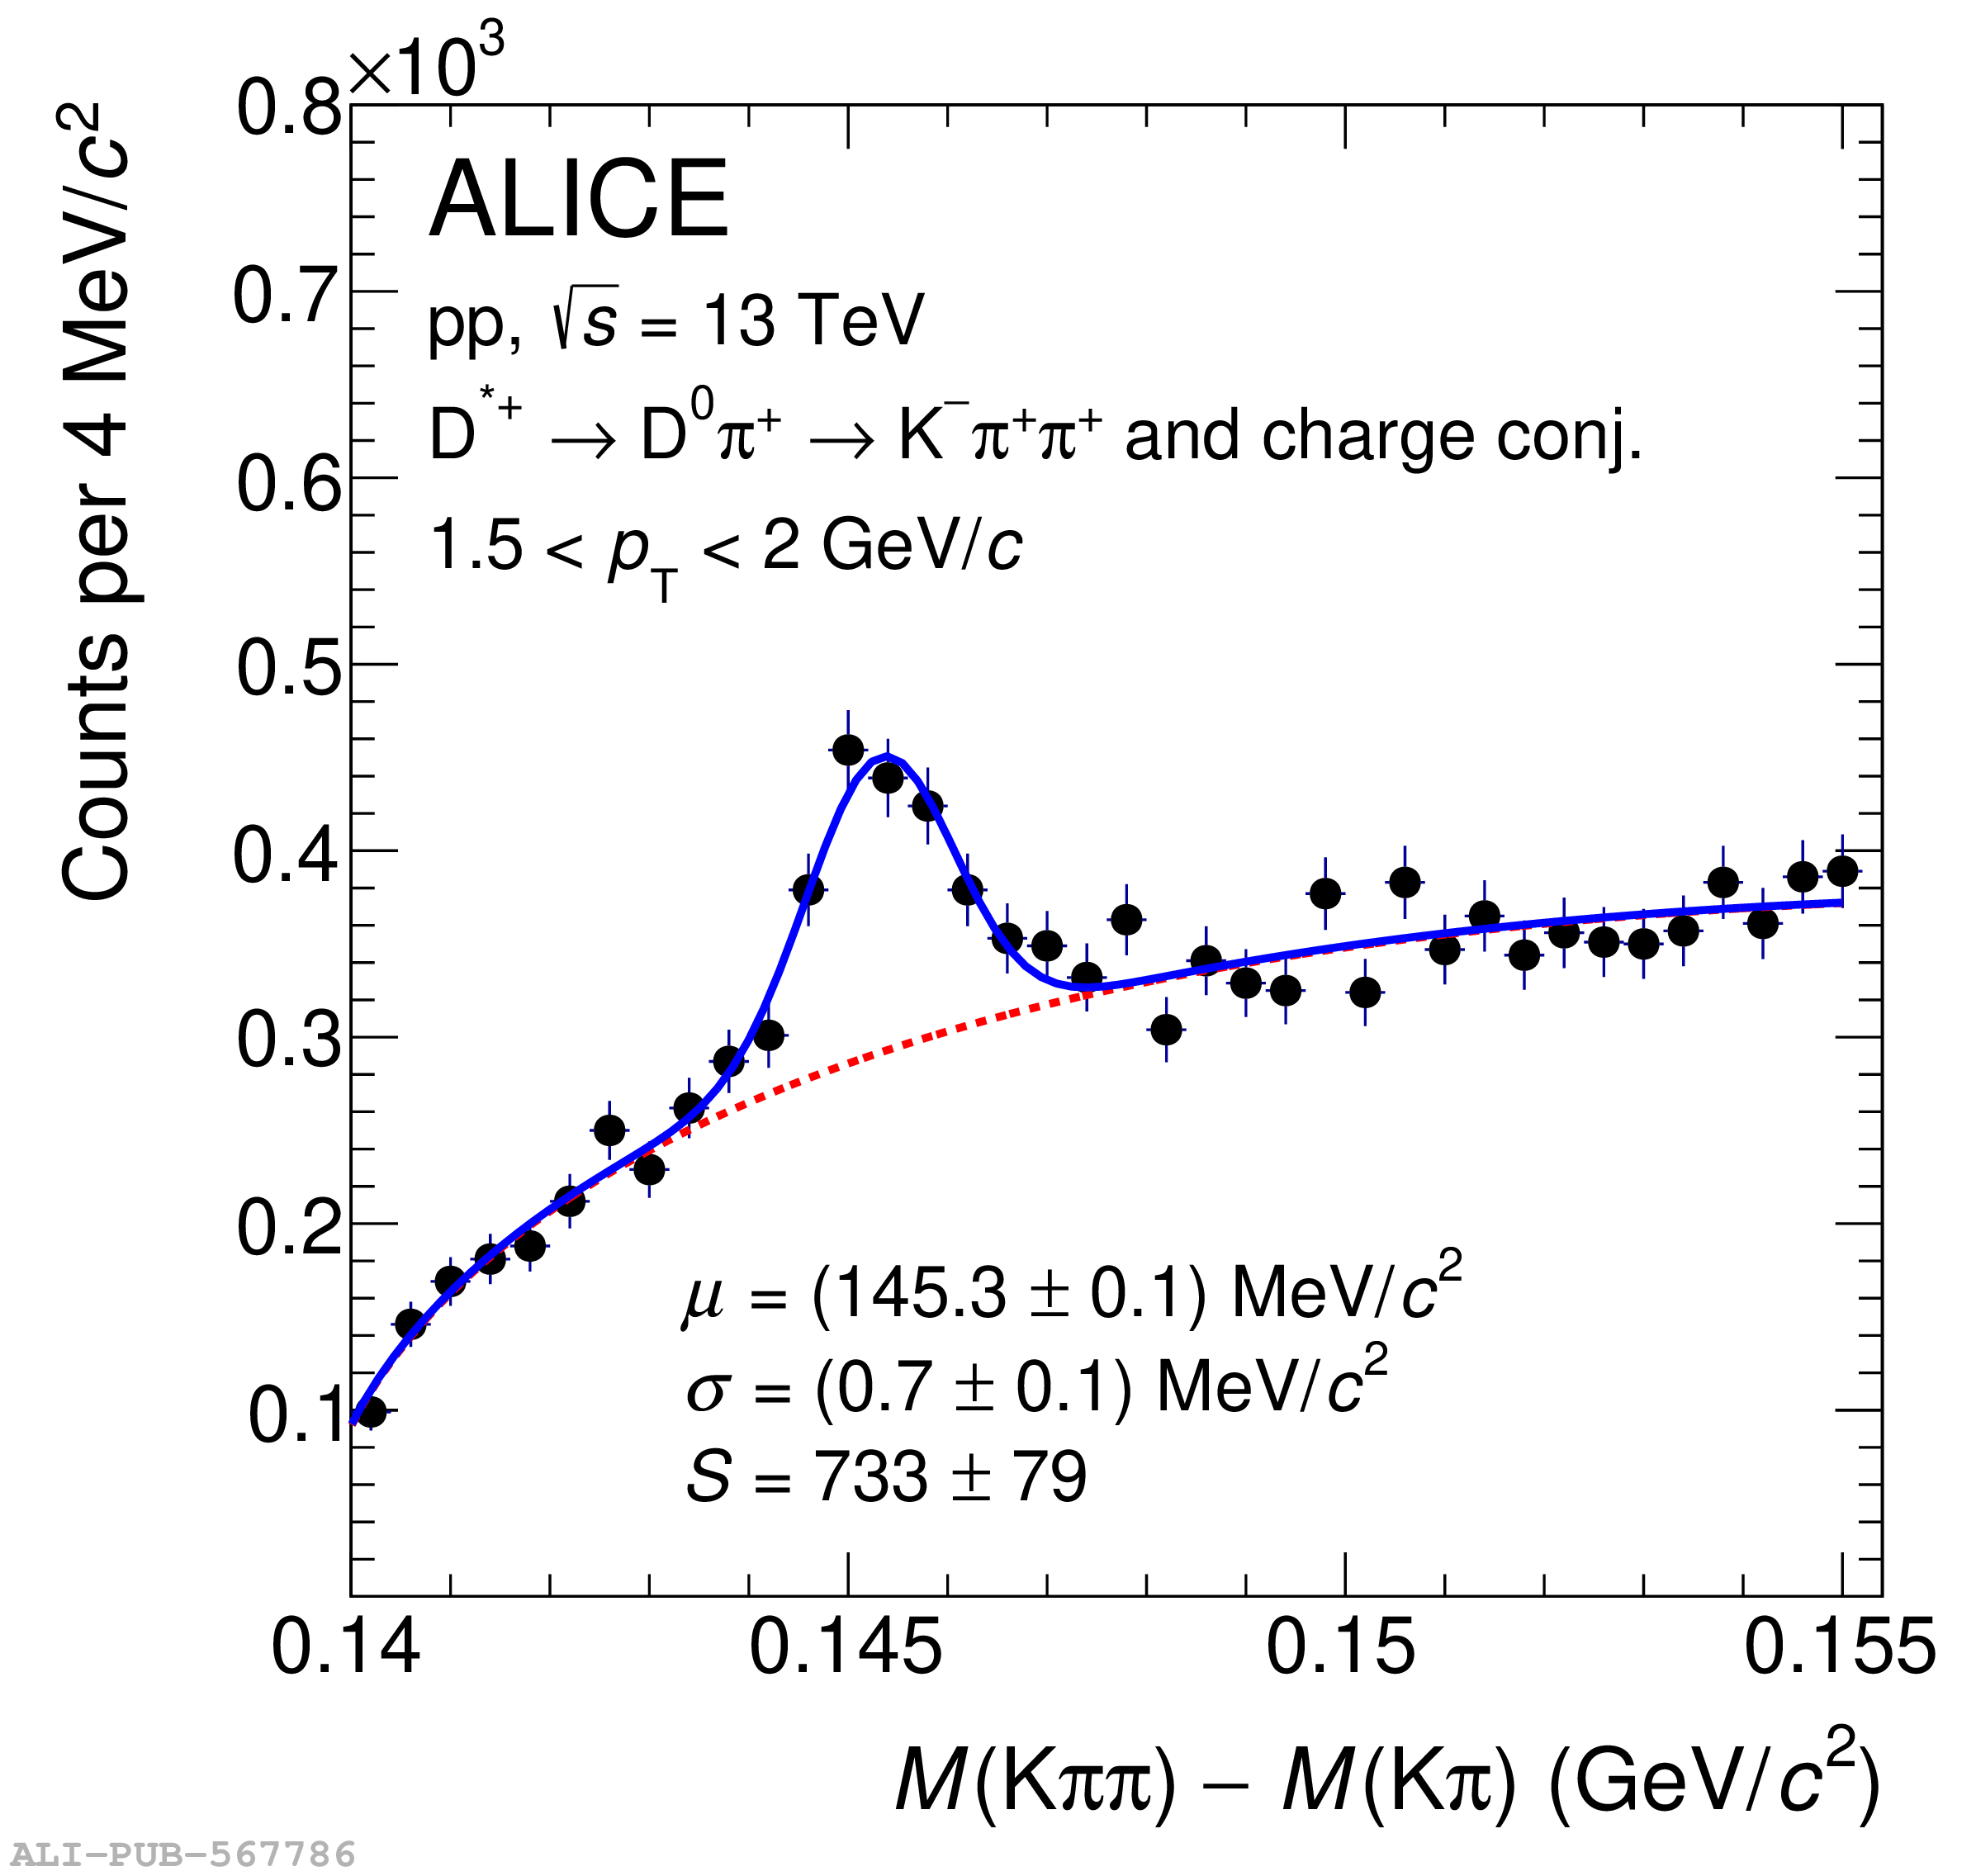 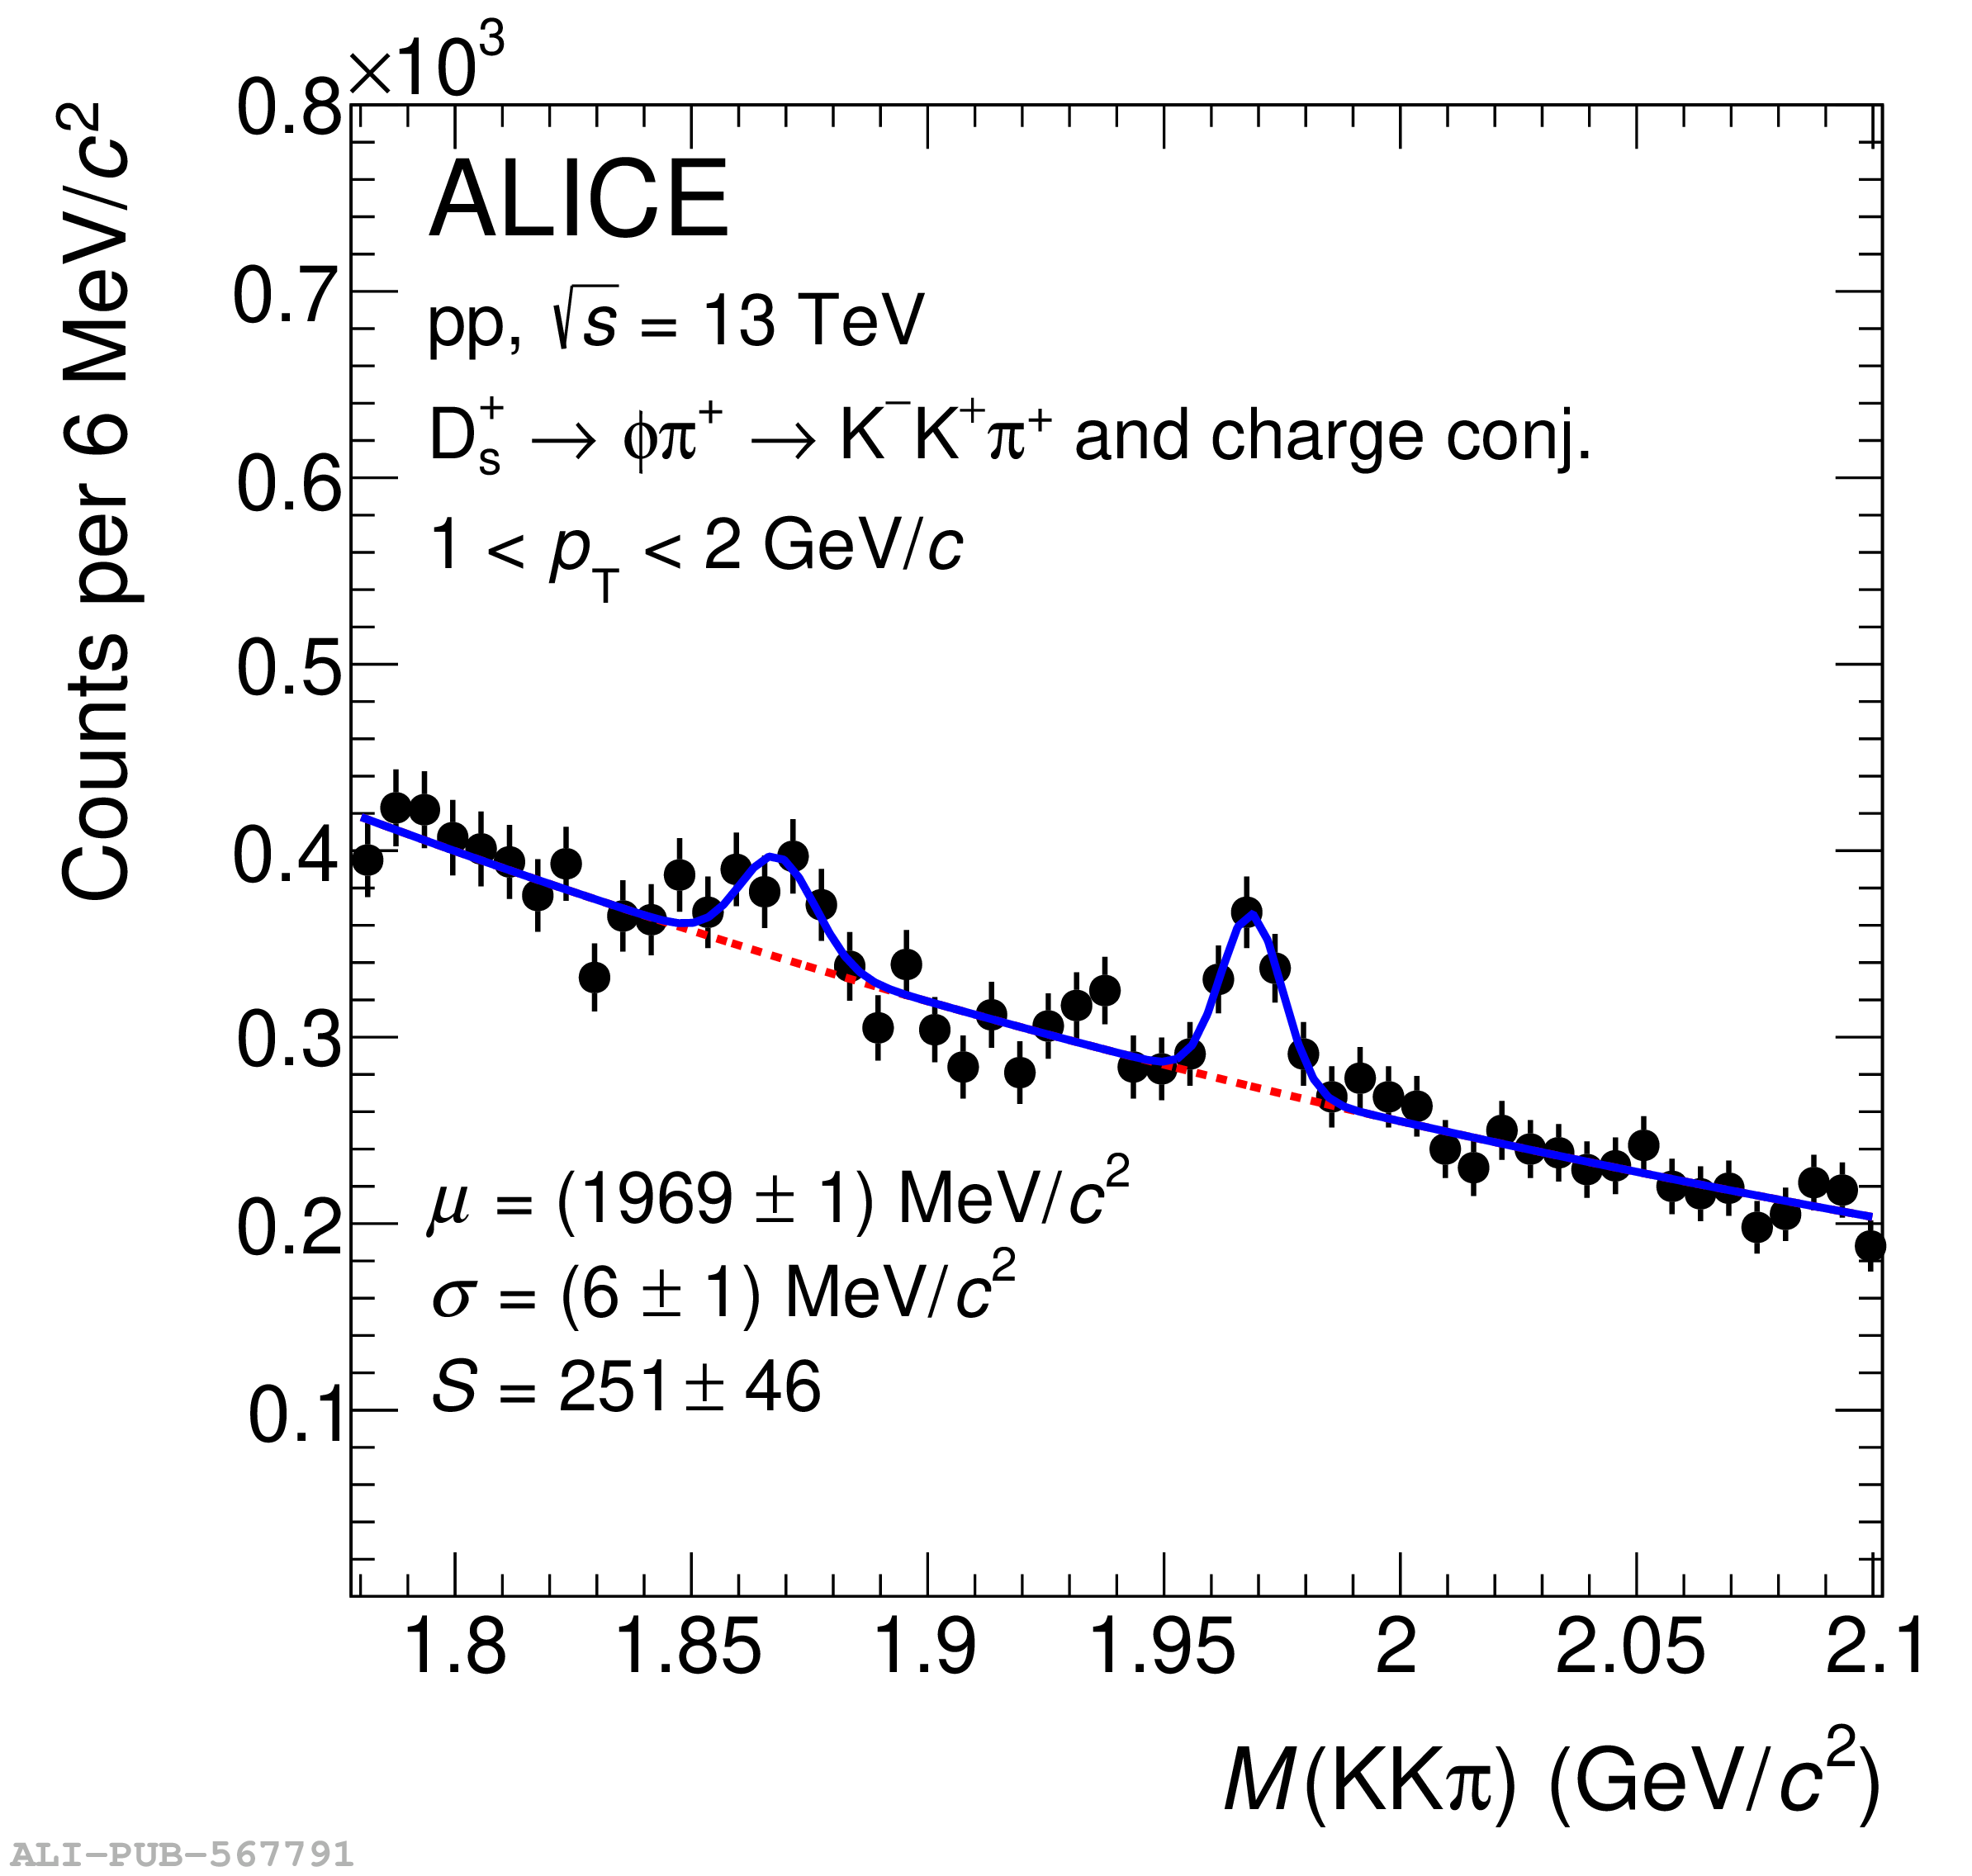 |