Cumulants for the p$-$p$-$K$^+$ (top panel) and p$-$p$-$K$^-$ (bottom panel) primary triplets. The error bars and the blue boxes on the data points represent the statistical and systematic uncertainties, respectively. The $n_\sigma$ deviations from zero in each bin are shown in the bottom panels, adding in quadrature the statistical and systematic uncertainties of the data. | 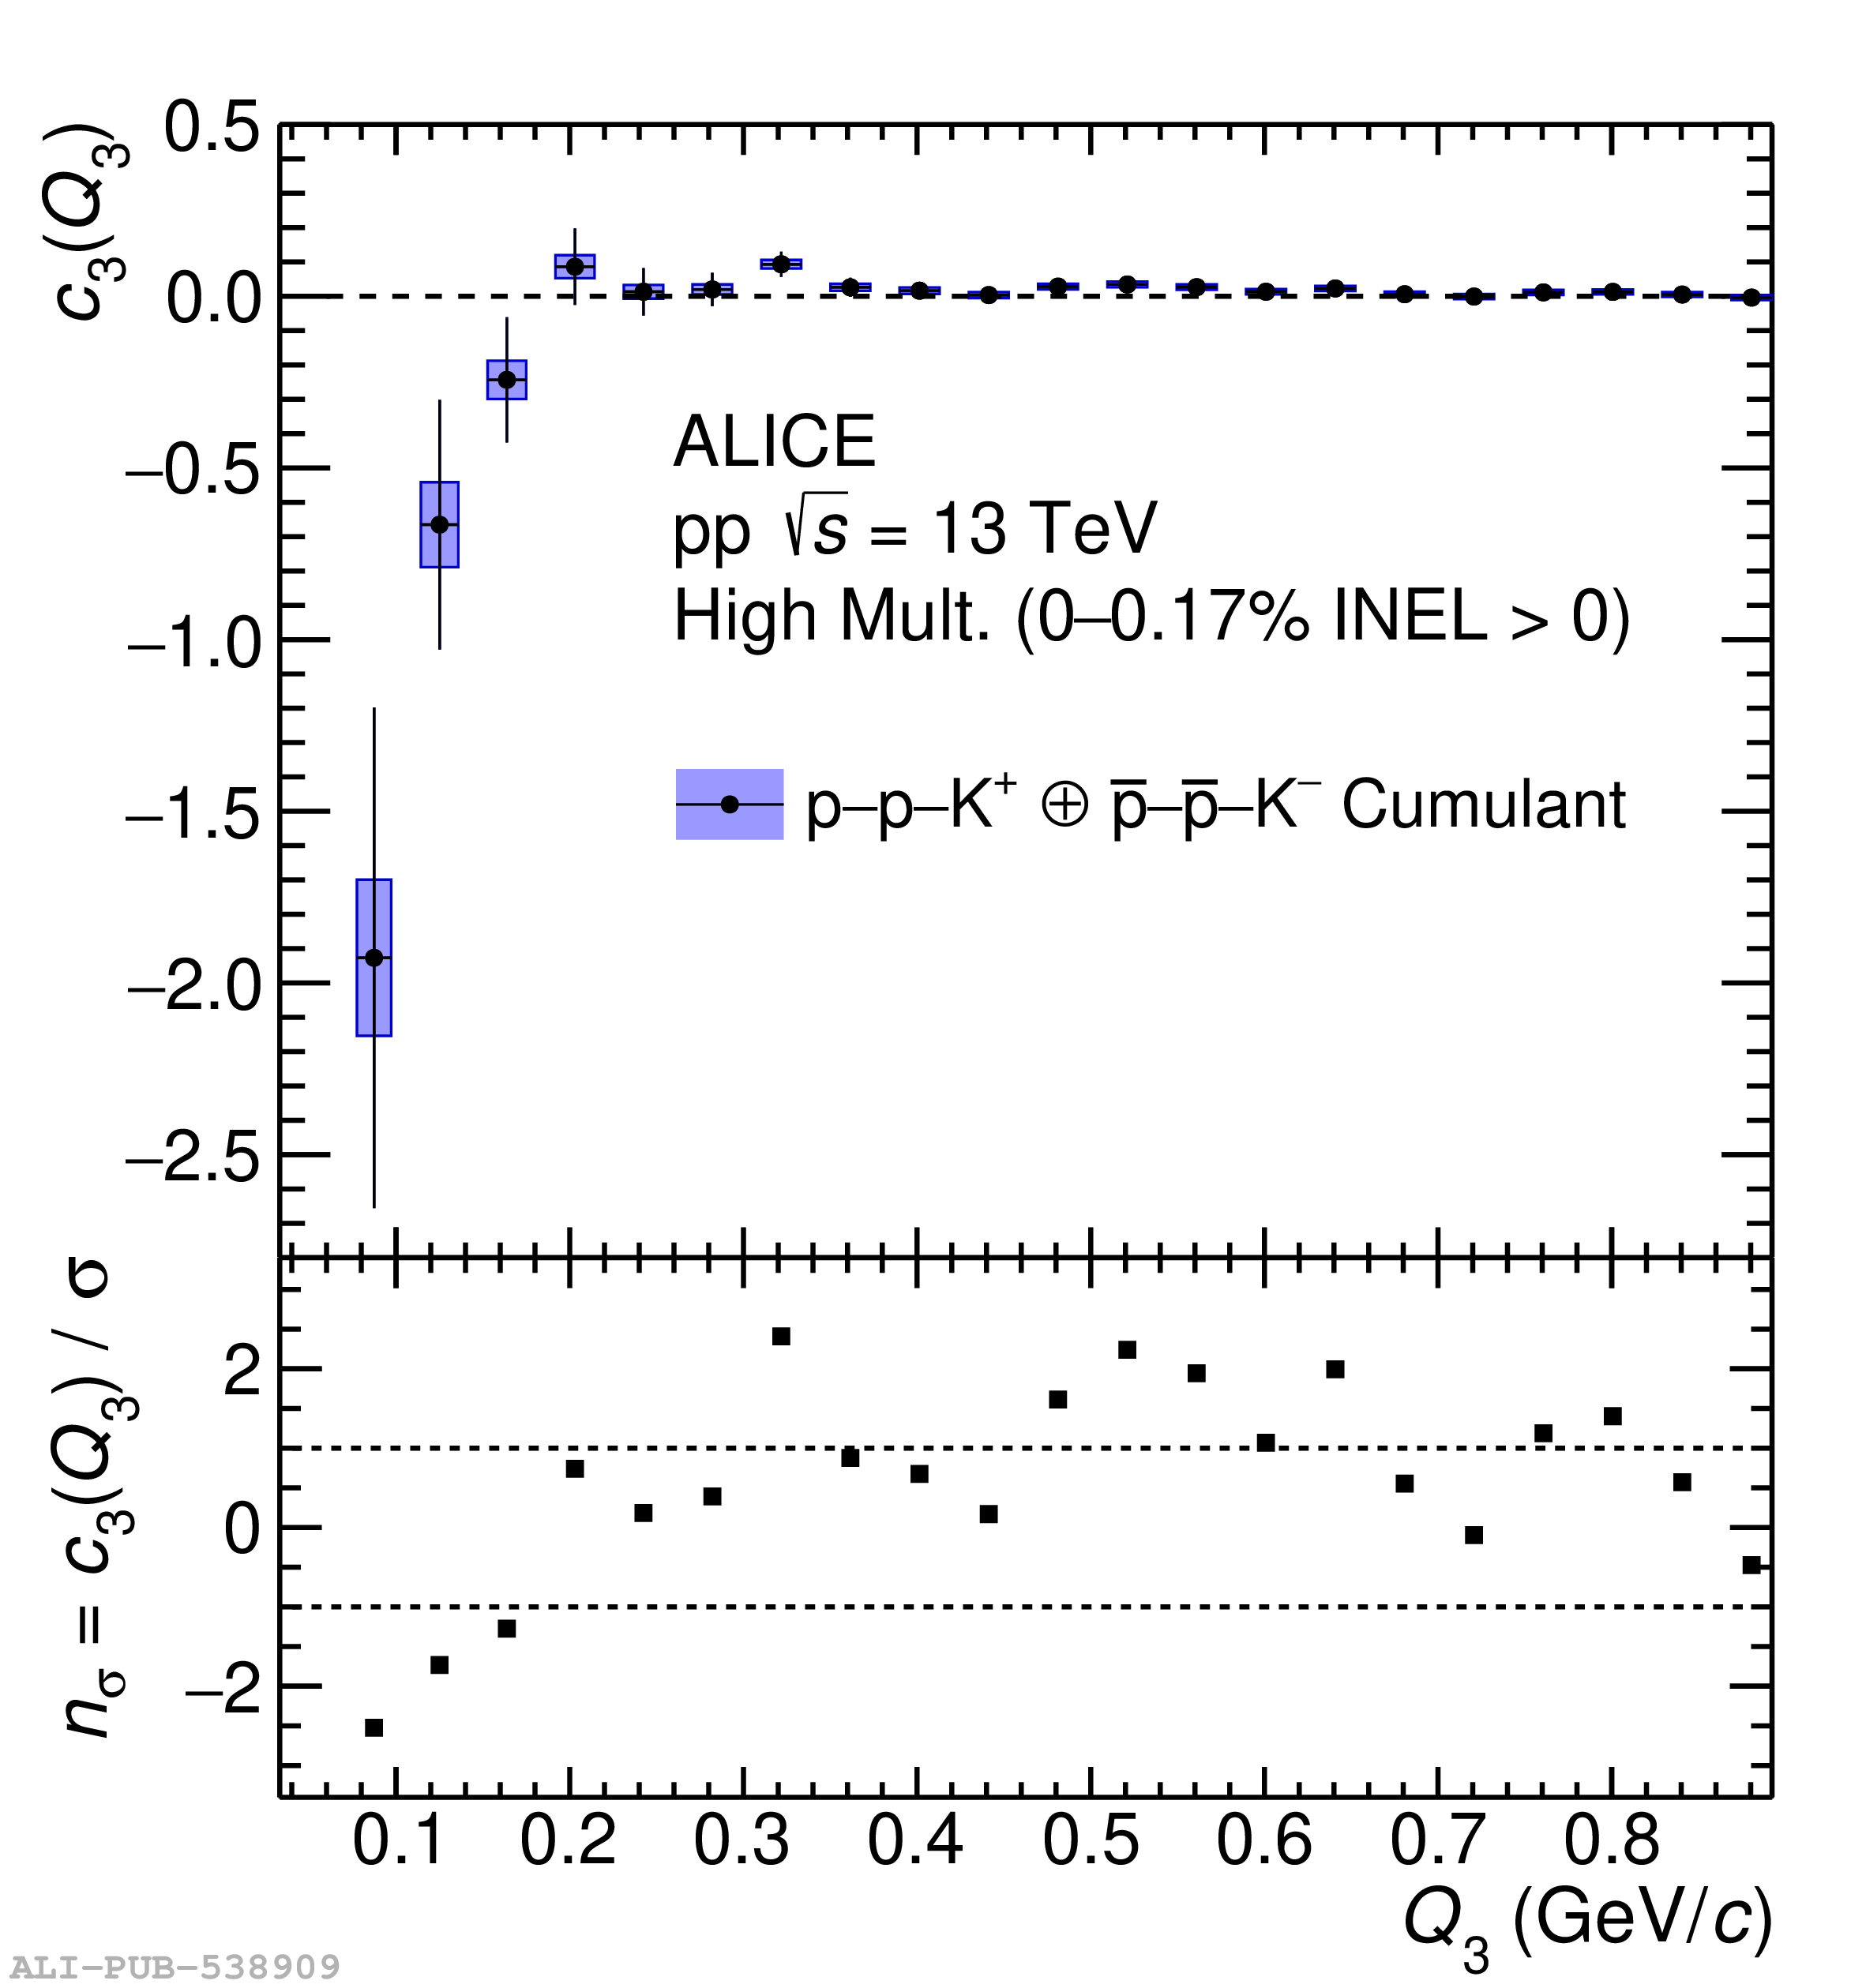 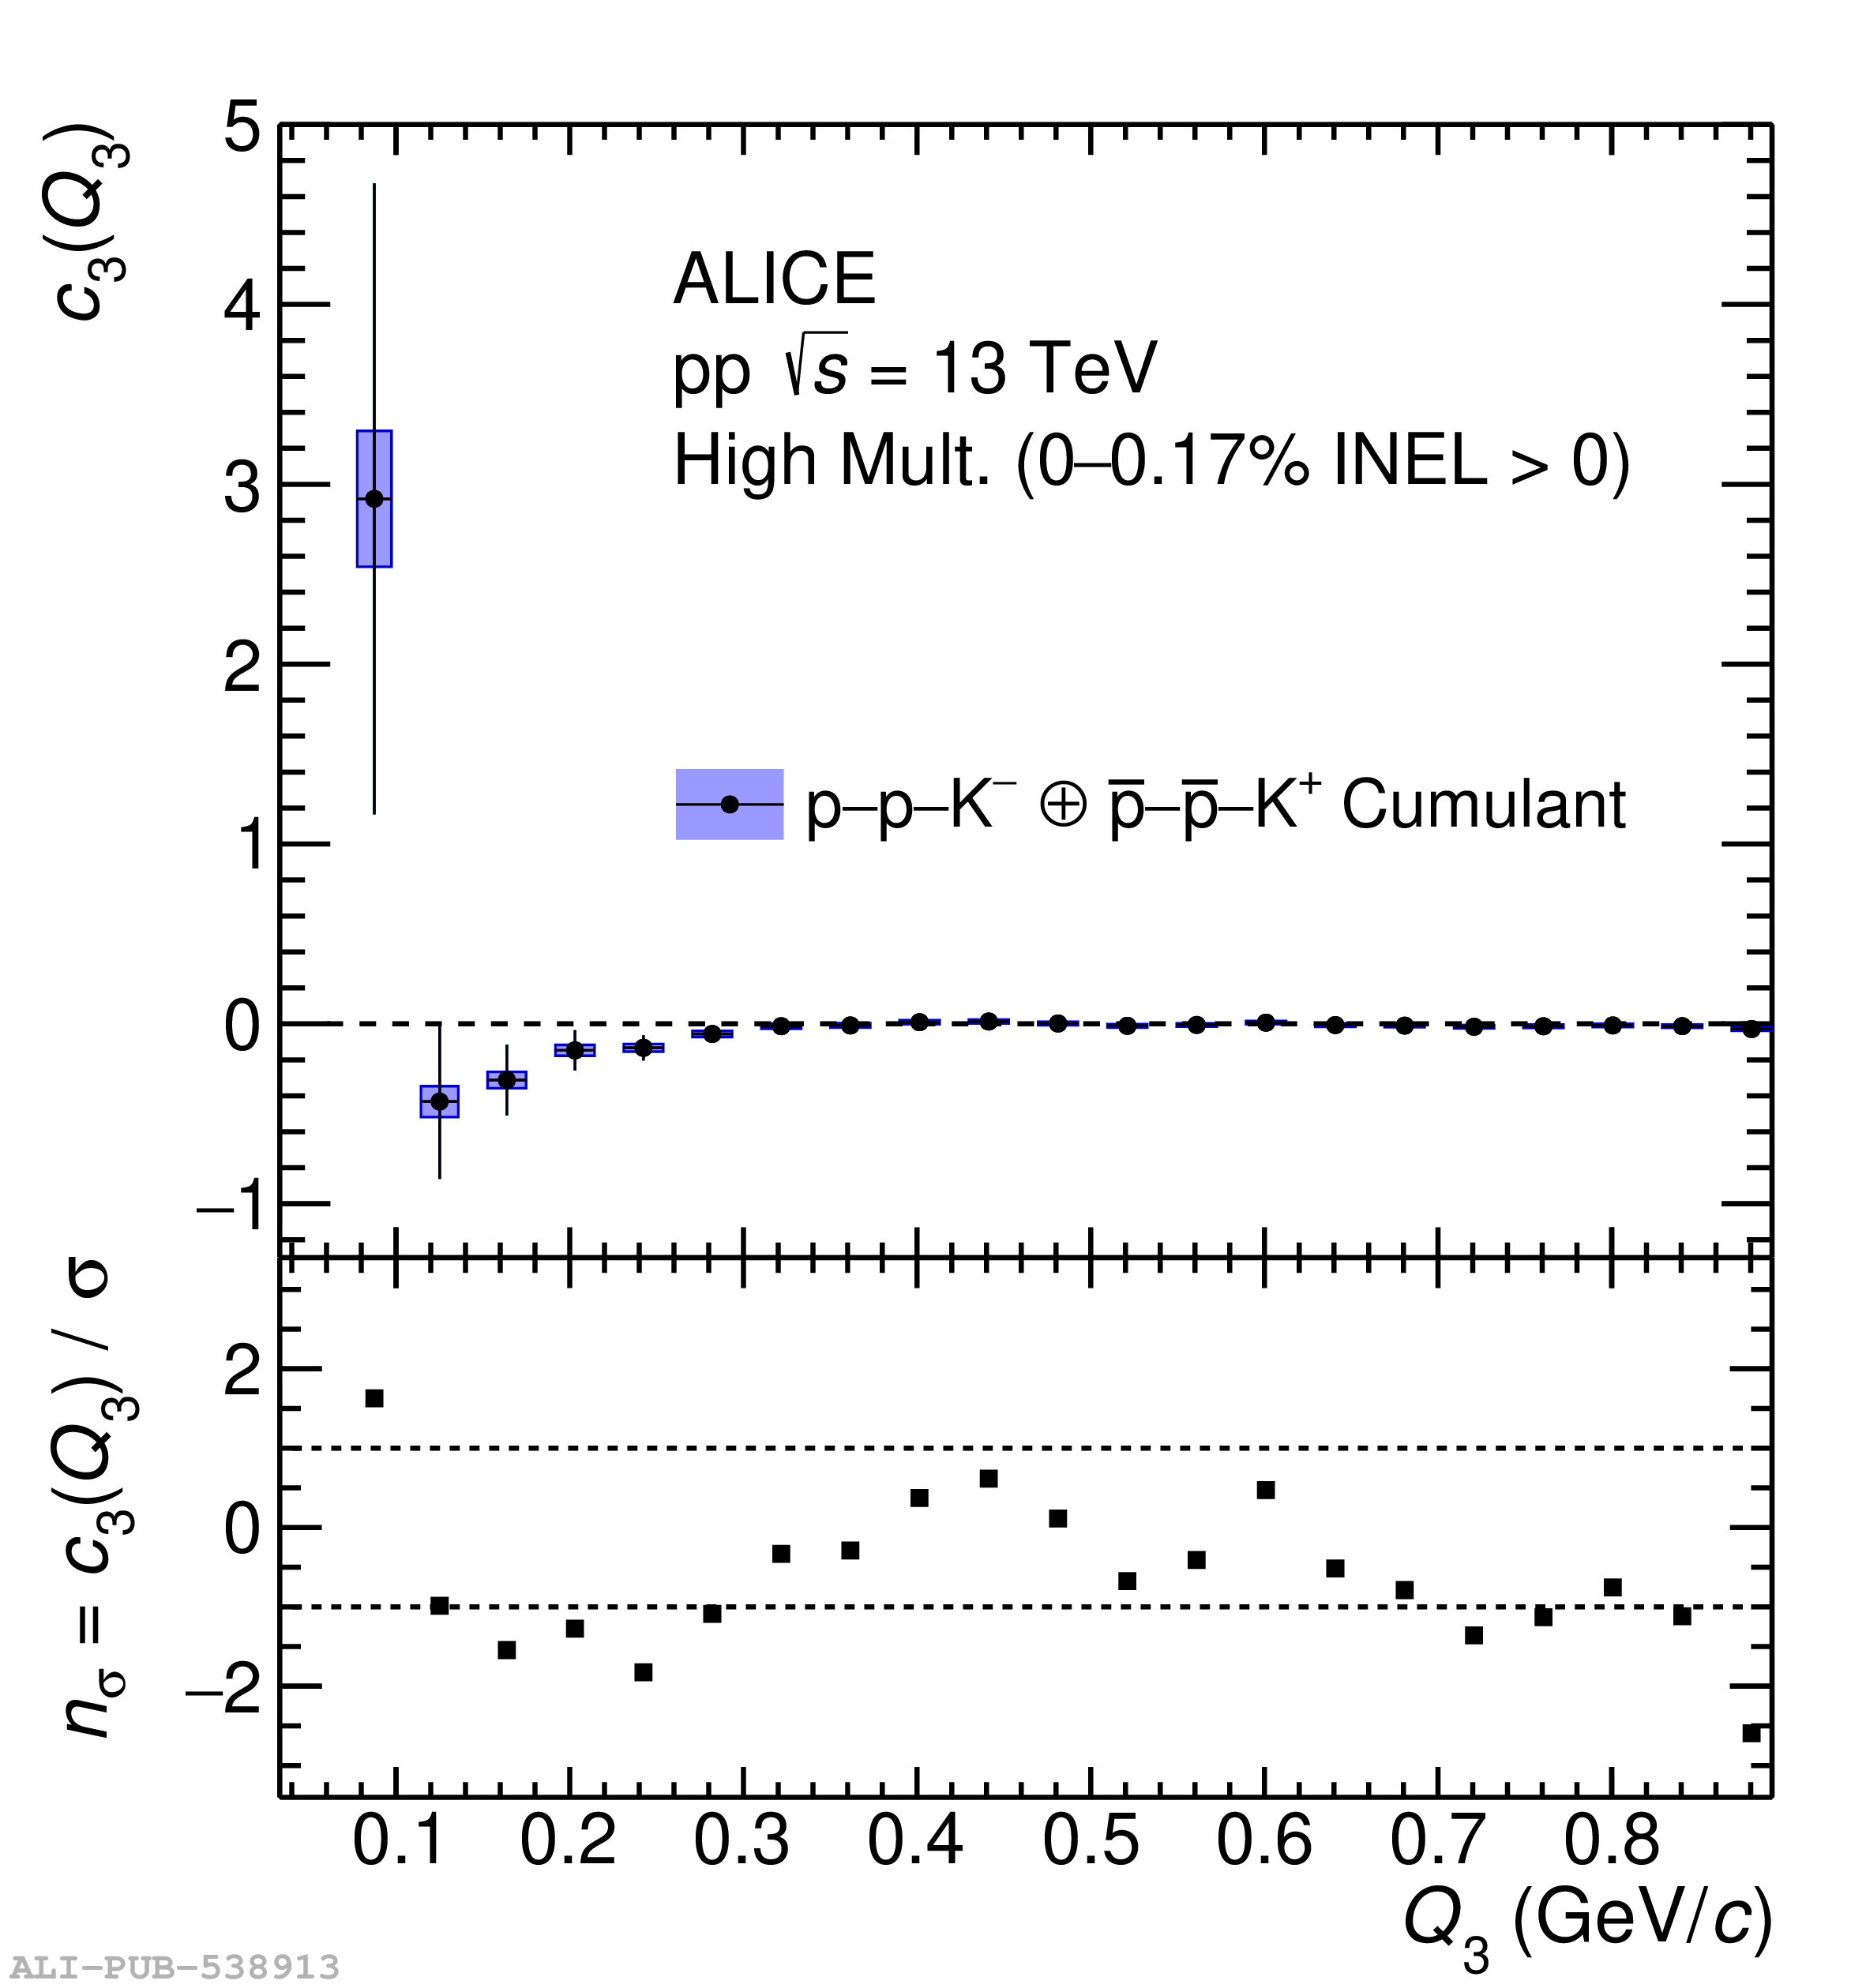 |