Correlation functions (data points) for p$-$p$-$K$^+$ (top panel) and p$-$p$-$K$^-$ (bottom panel) compared to the lower-order contributions evaluated using the projector method (grey bands). Statistical and systematic uncertainties are represented by error bars and green boxes, respectively. The band widths represent the combined statistical and systematic uncertainties propagated from the two-particle correlation functions used as input to the projector method. | 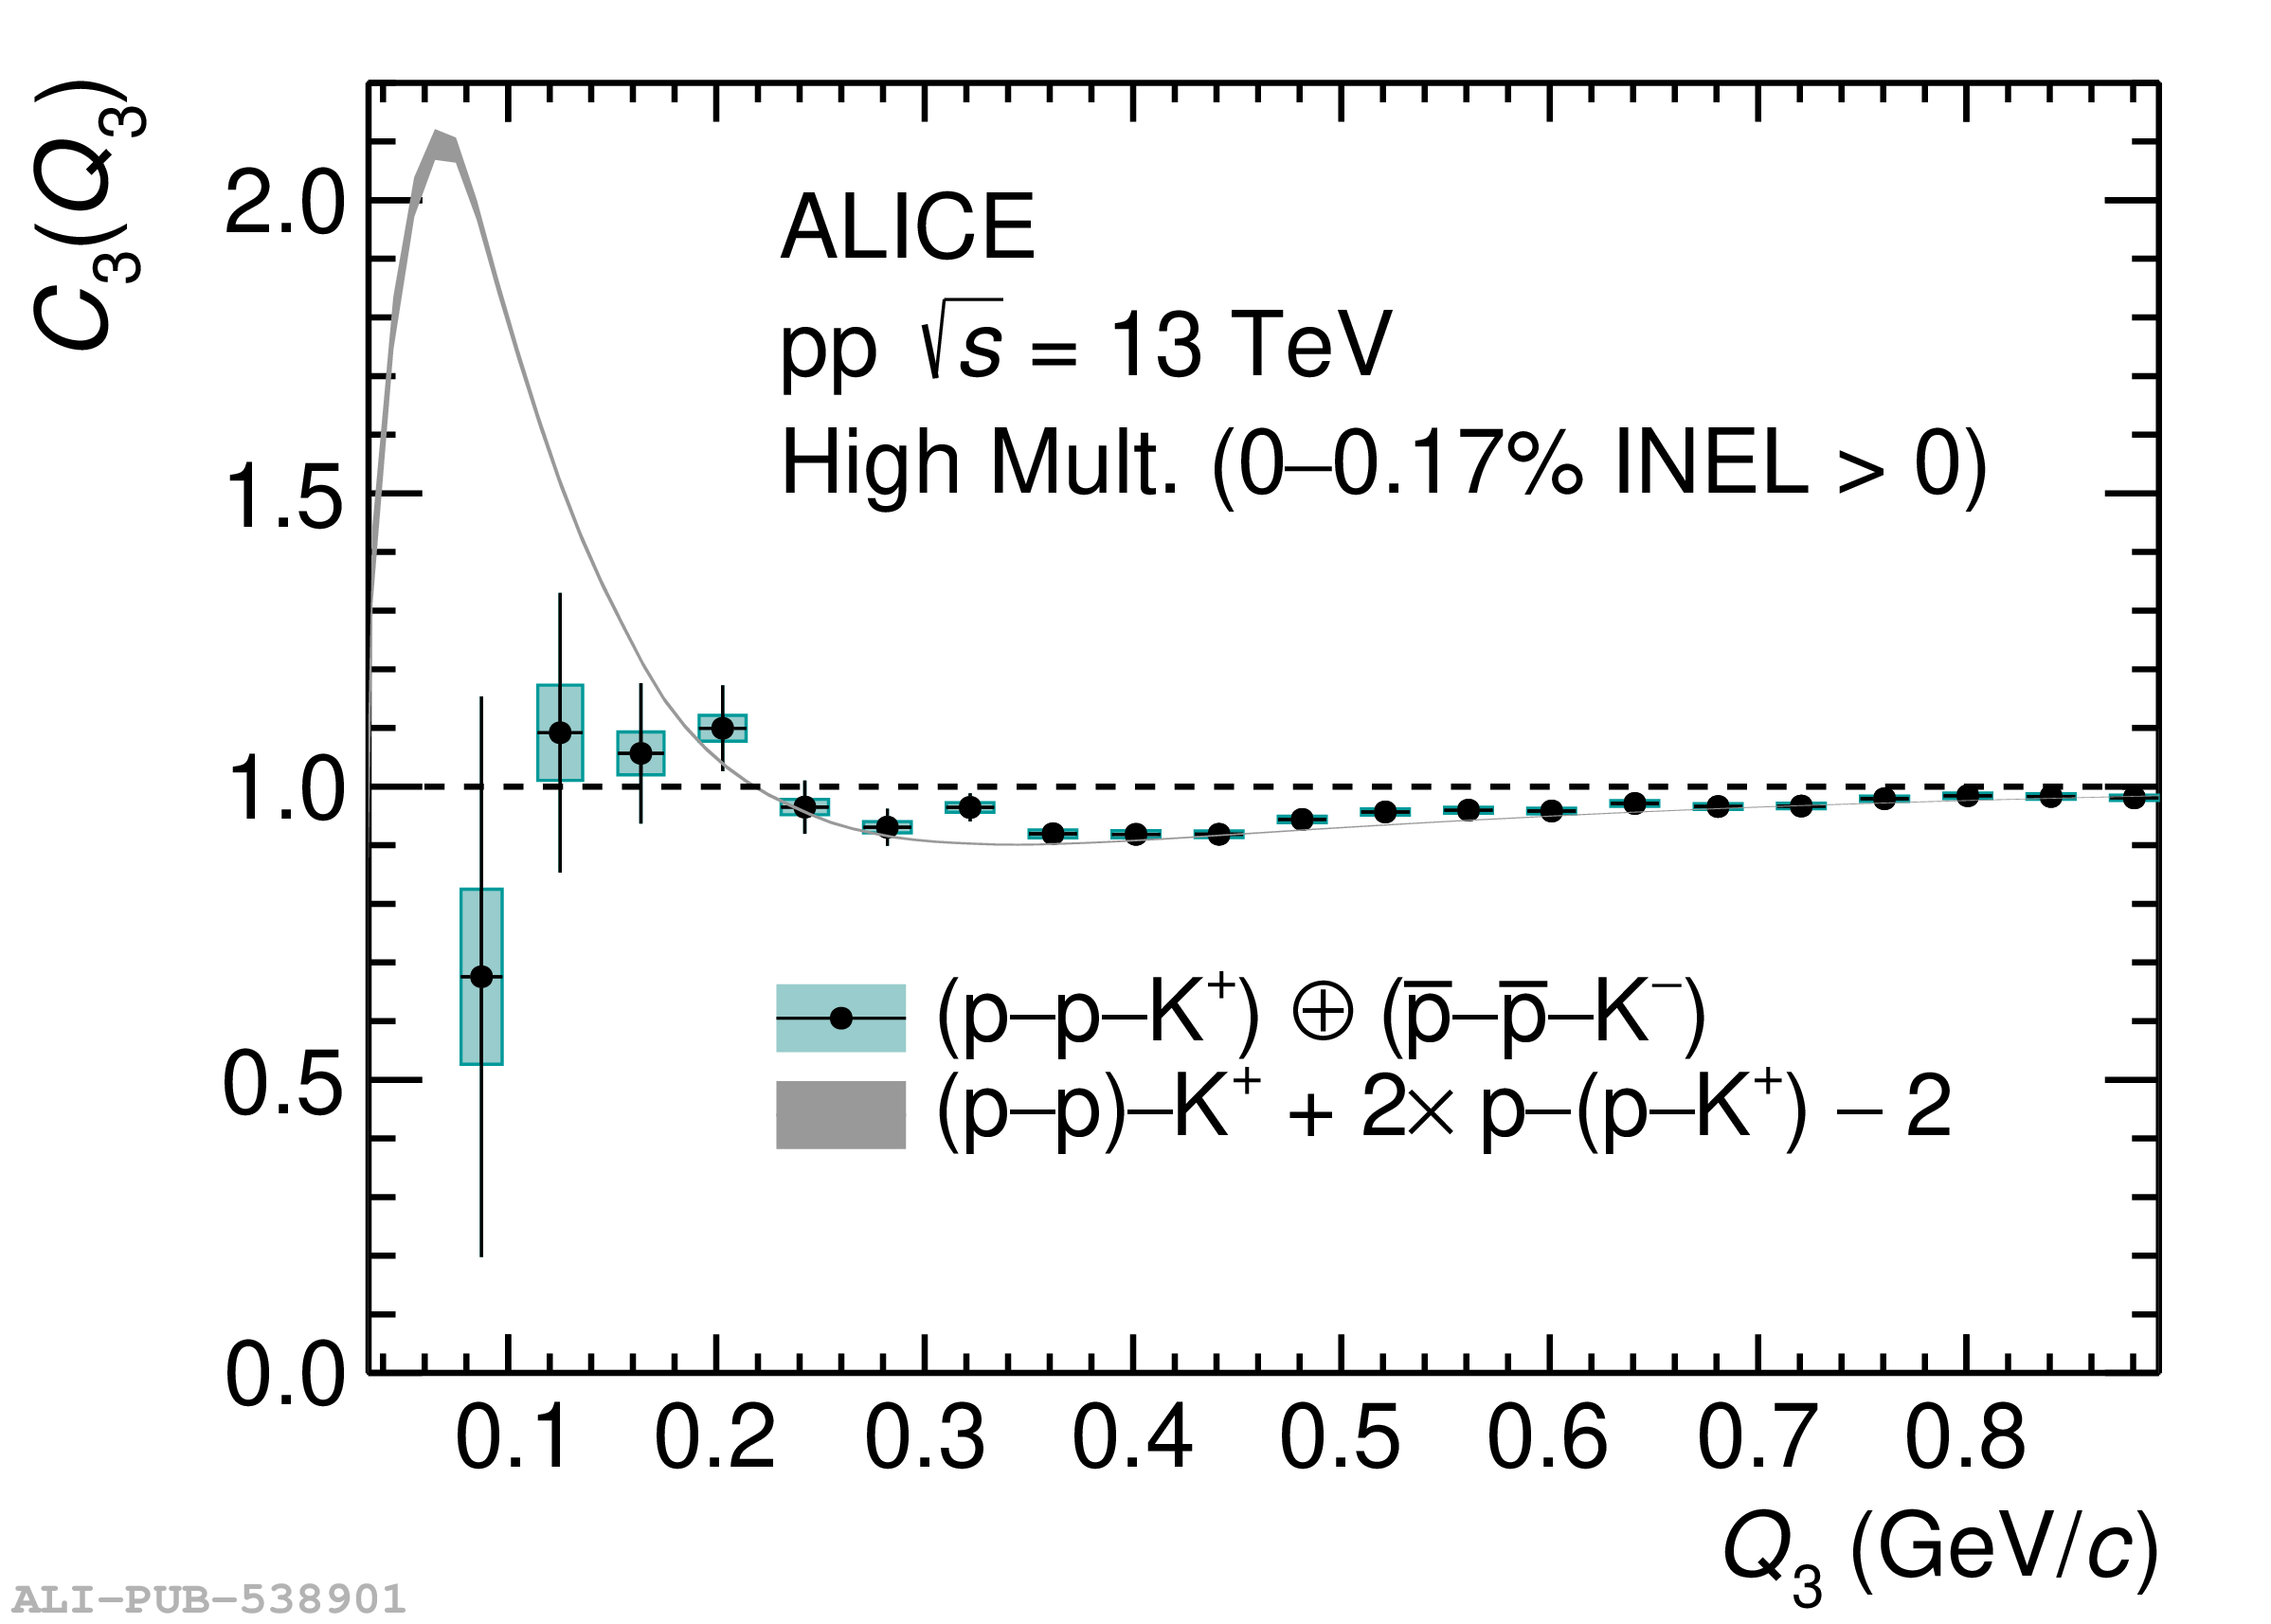  |