Correlation functions for (p$-$p)$-$K$^+$ (panel $\mathrm{a_1}$), (p$-$p)$-$K$^-$ (panel $\mathrm{a_2}$), p$-$(p$-$K$^+$) (panel $\mathrm{b_1}$), p$-$(p$-$K$^-$) (panel $\mathrm{b_2}$) as well as the total lower-order contributions for p$-$p$-$K$^+$ (panel $\mathrm{c_1}$) and p$-$p$-$K$^-$ (panel $\mathrm{c_2}$) as a function of $Q_3$. The points represent the results obtained using the data-driven approach, with the statistical and systematic uncertainties represented by the error bars and the green boxes, respectively. The grey bands are the expectations of the projector method, with the band width representing the combined statistical and systematic uncertainties. | 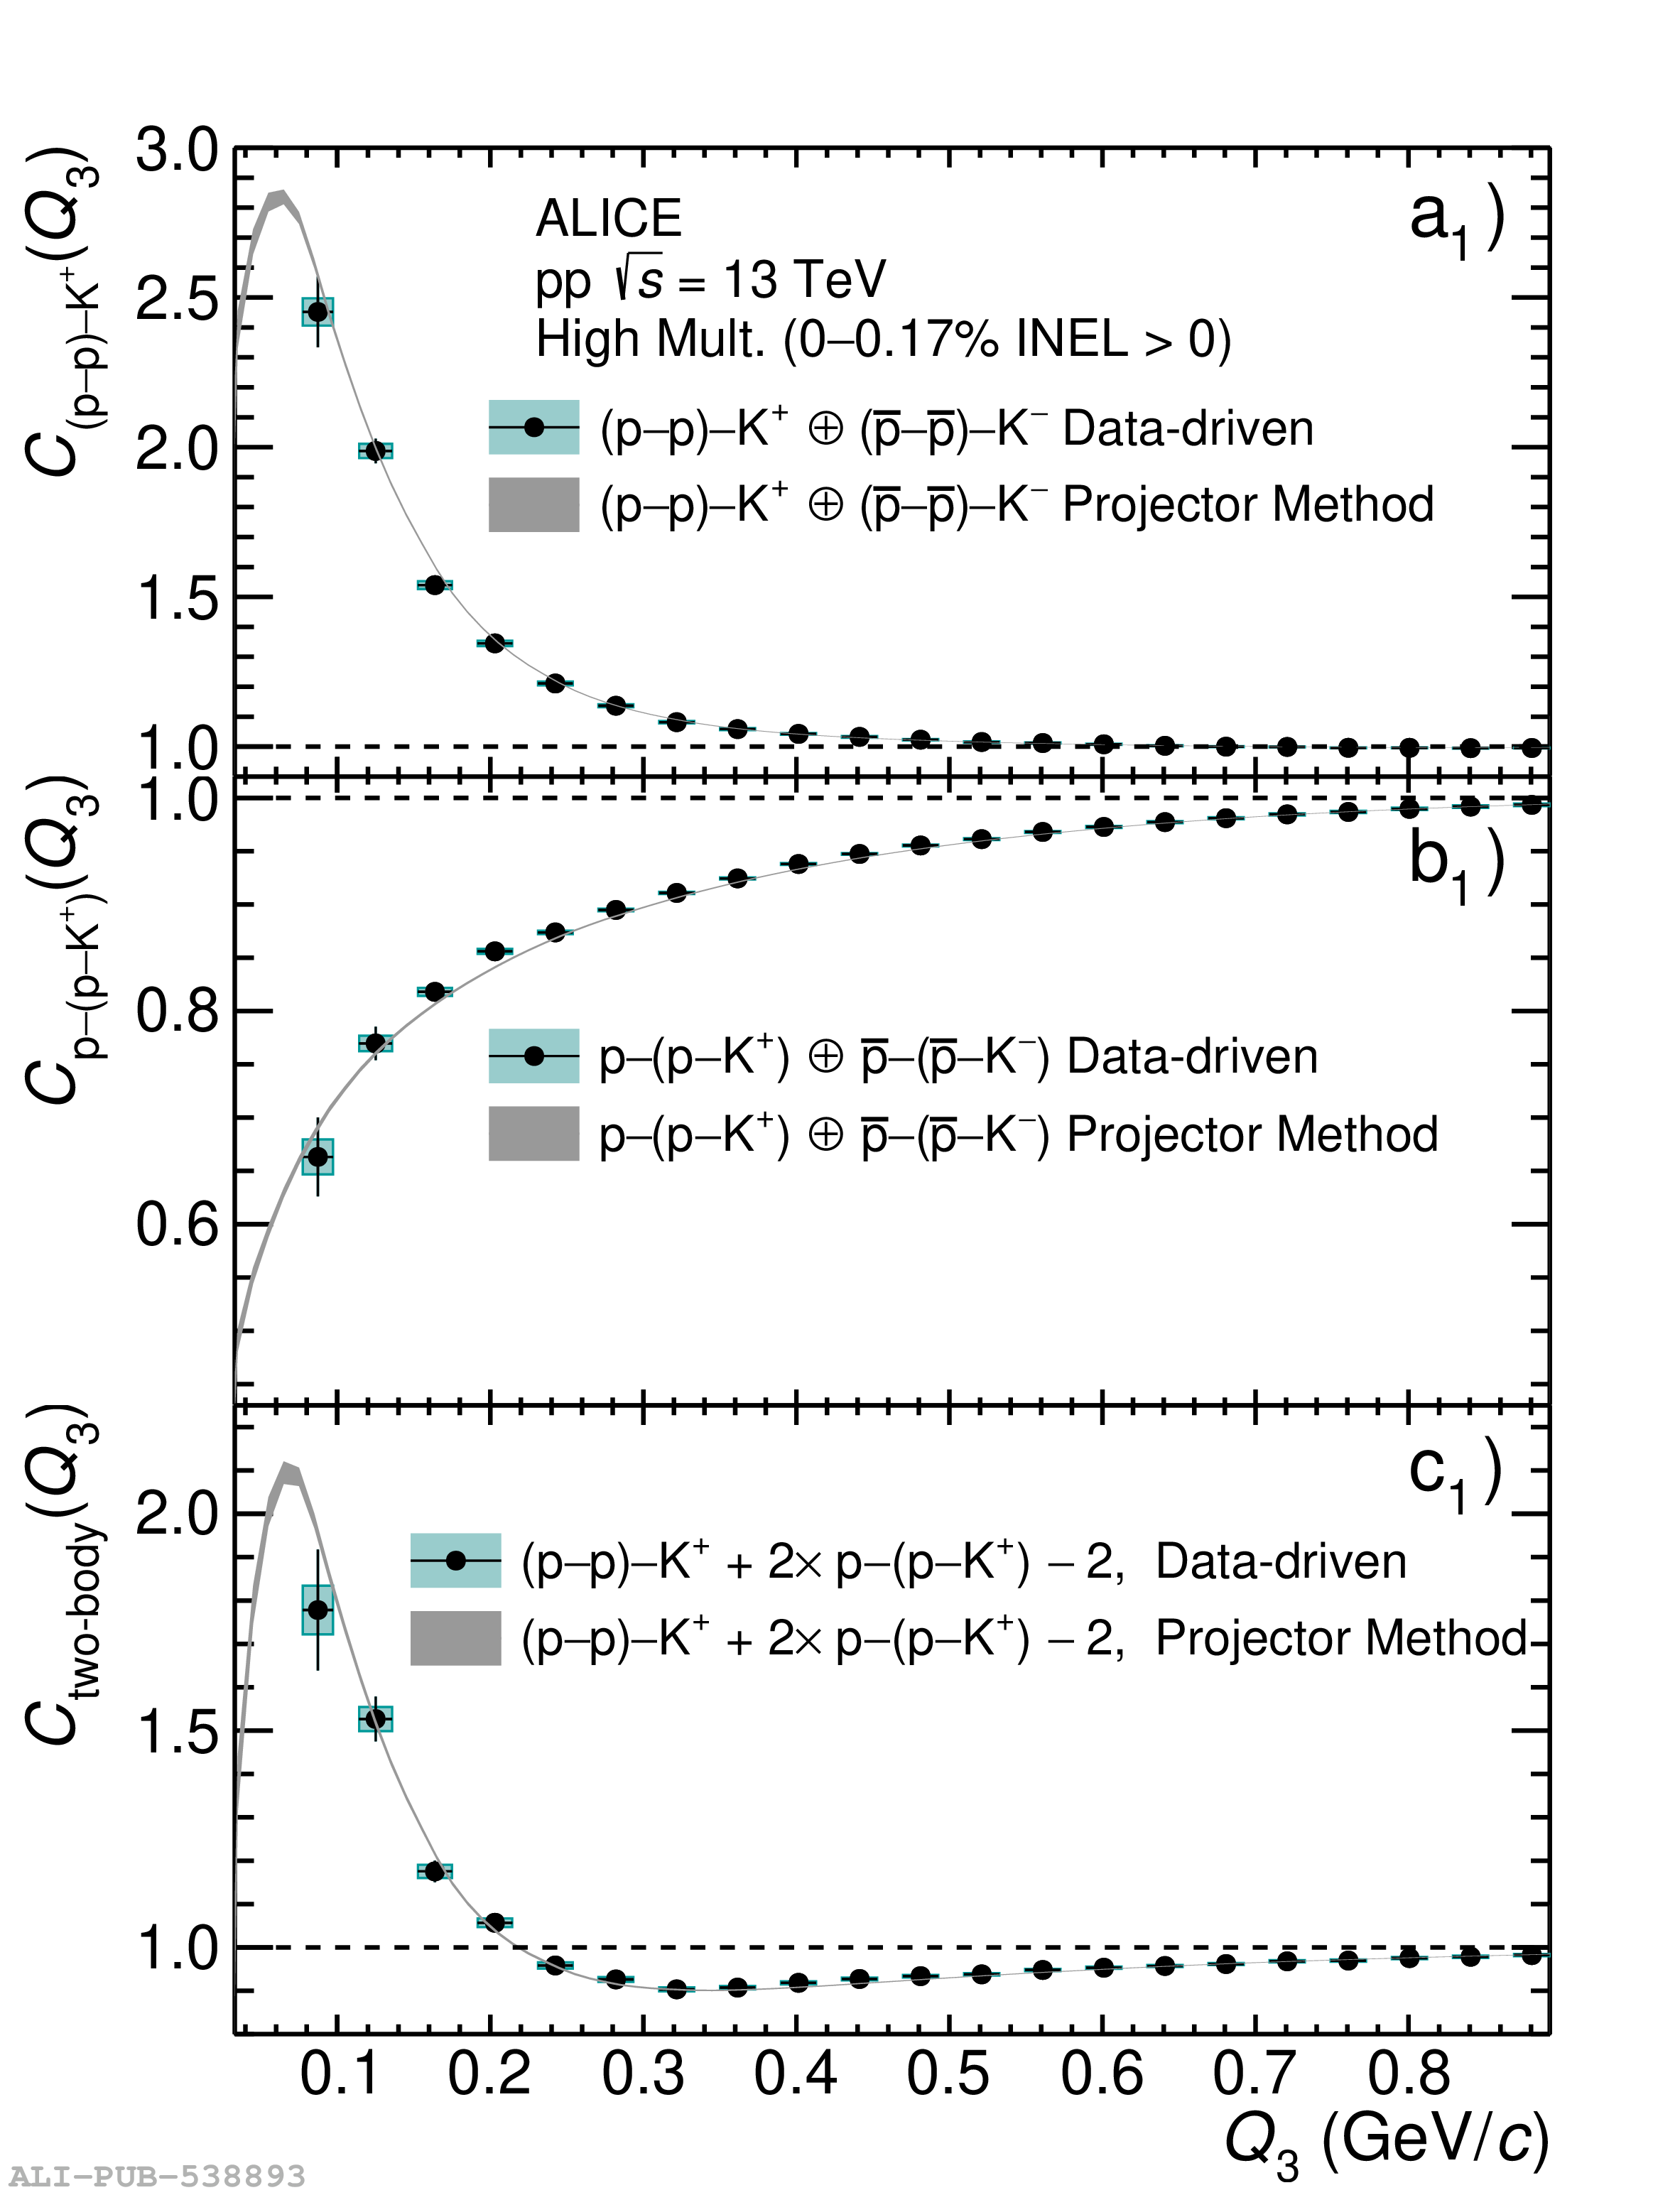  |