Centrality (left) and pseudorapidity interval (right) dependence of the normalized second-order cumulants of net protons for \mbox{$\snn = 5.02$ TeV} and two momentum intervals for the protons. The ALICE data are shown by red and blue markers for $0.6 < p < 1.5$ GeV/c and $0.6 < p < 2.0$ GeV/c, respectively. The colored shaded areas indicate the results from the HIJING and EPOS model calculations. In the right panel, in addition, the dashed colored lines represent the predictions from the model with local baryon number conservation with $\Delta y_{\rm corr}=5$ . | 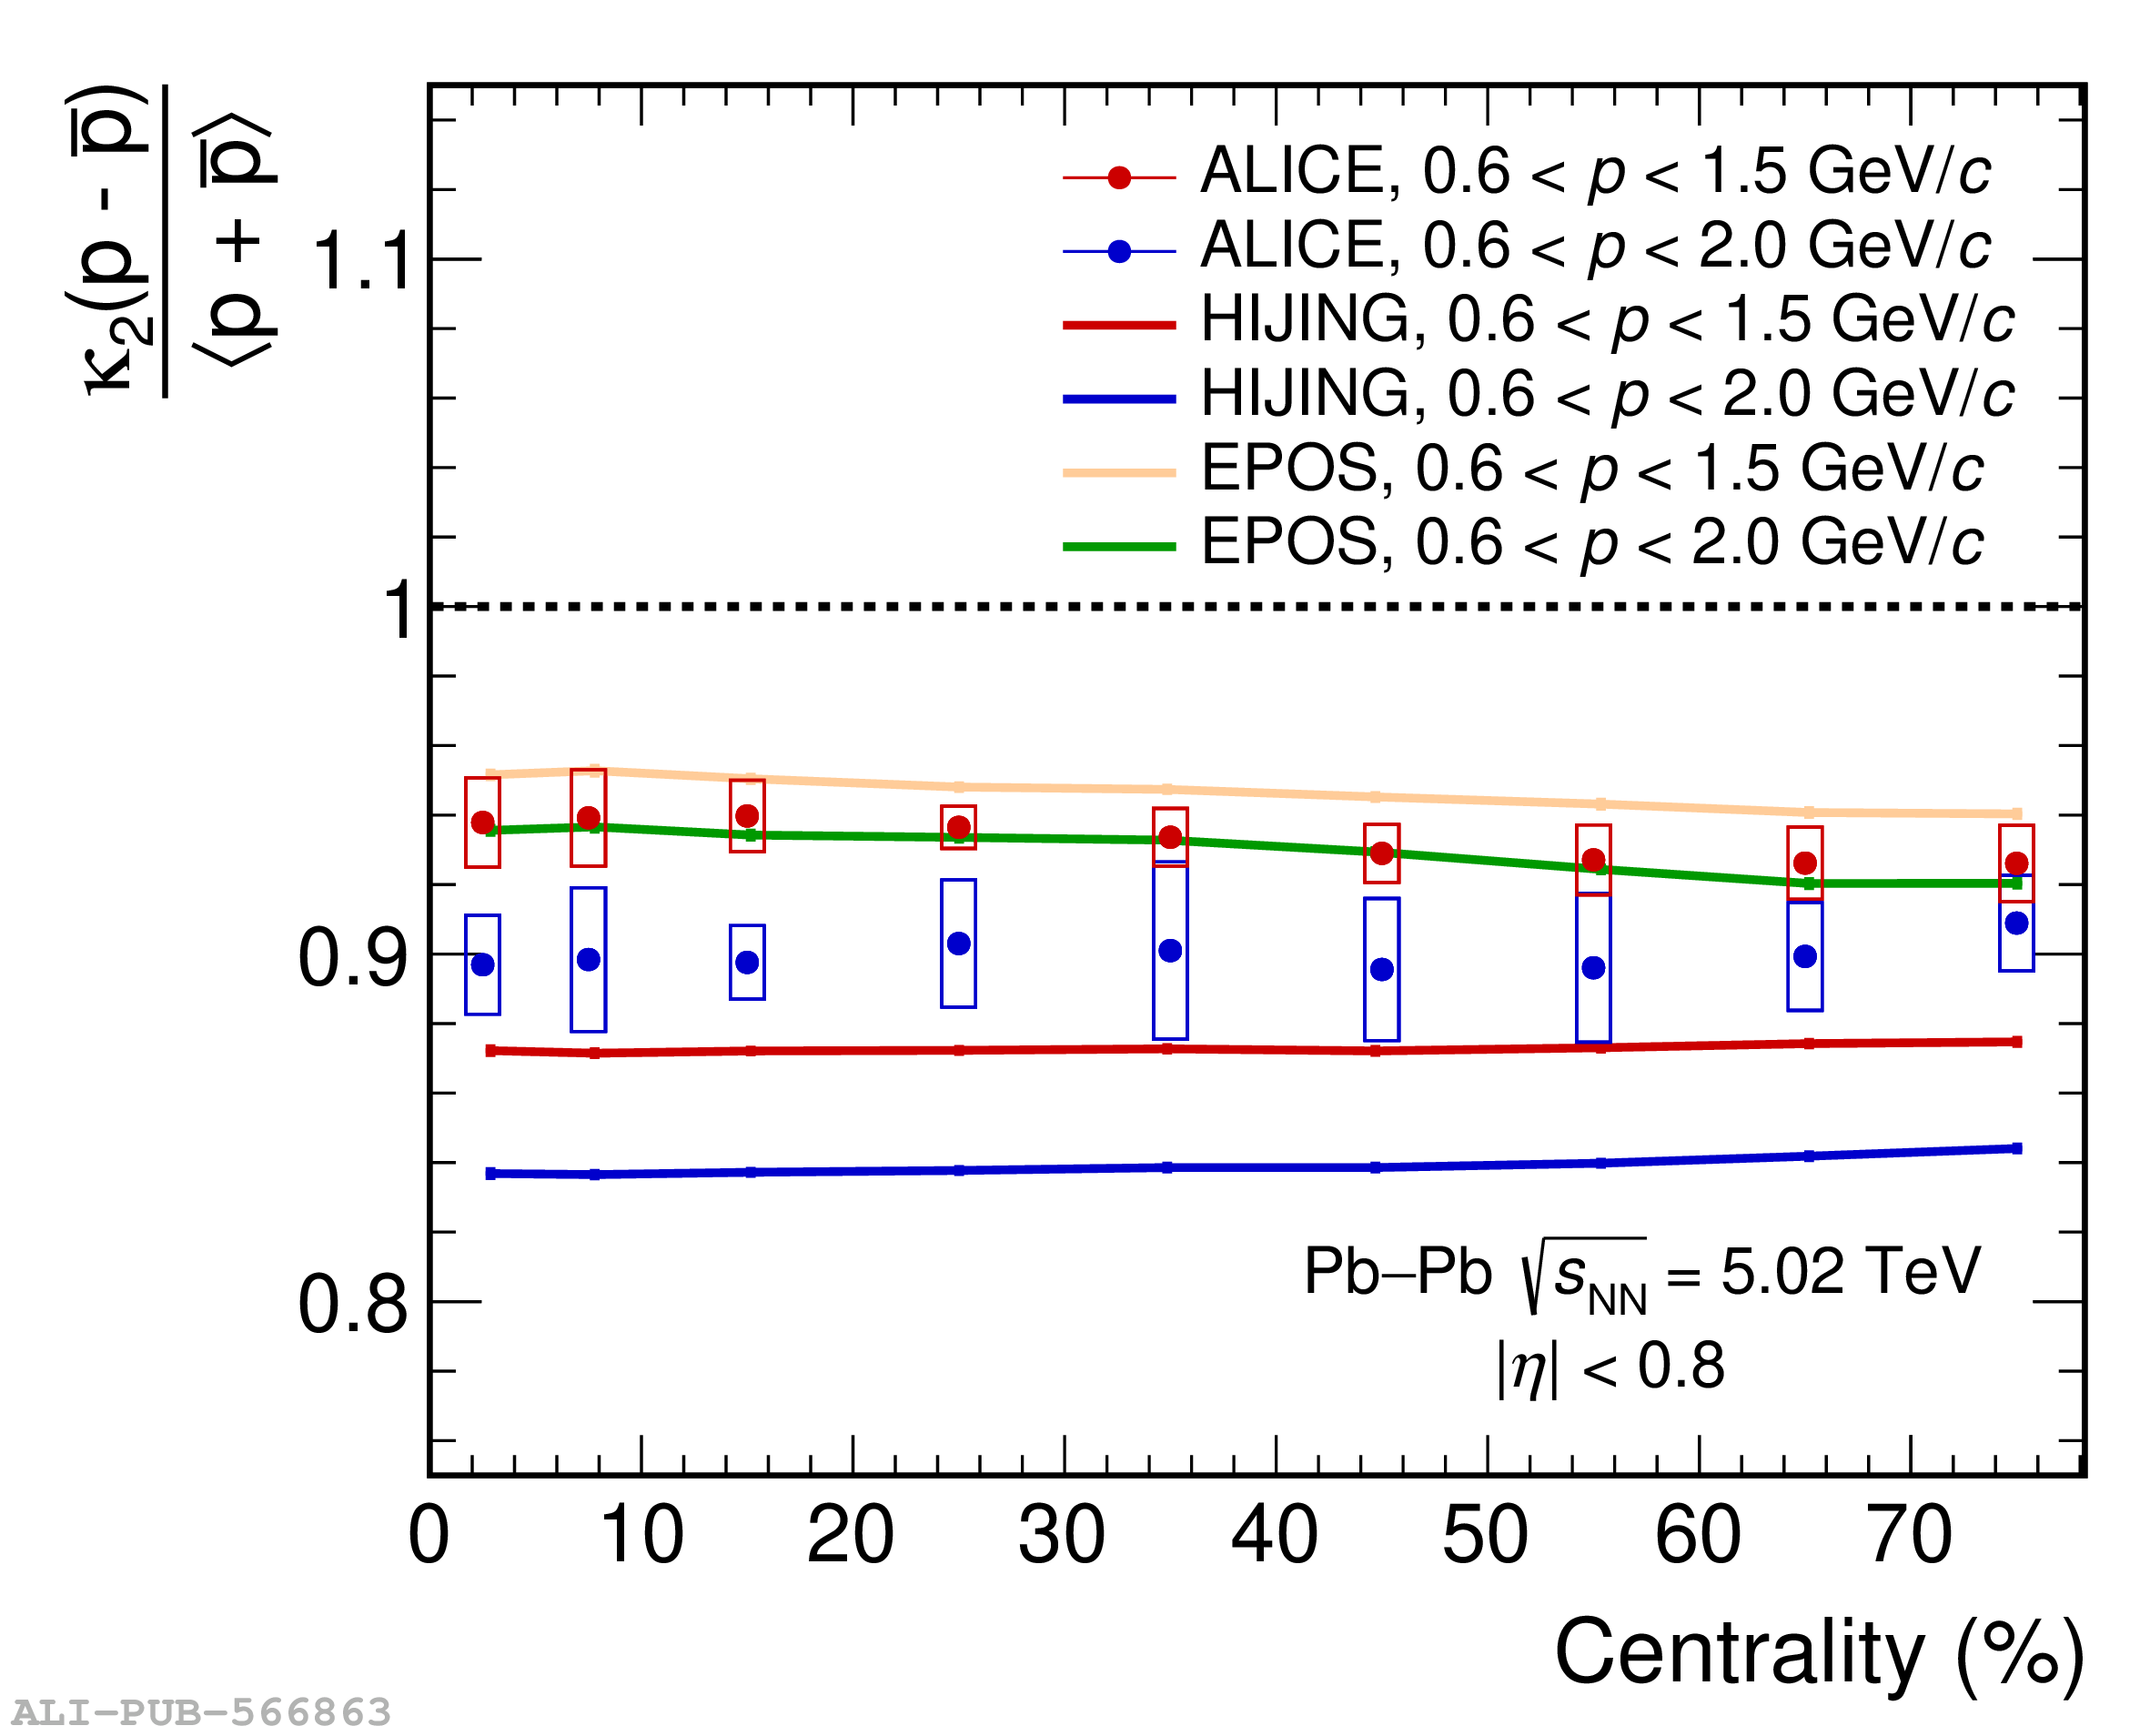 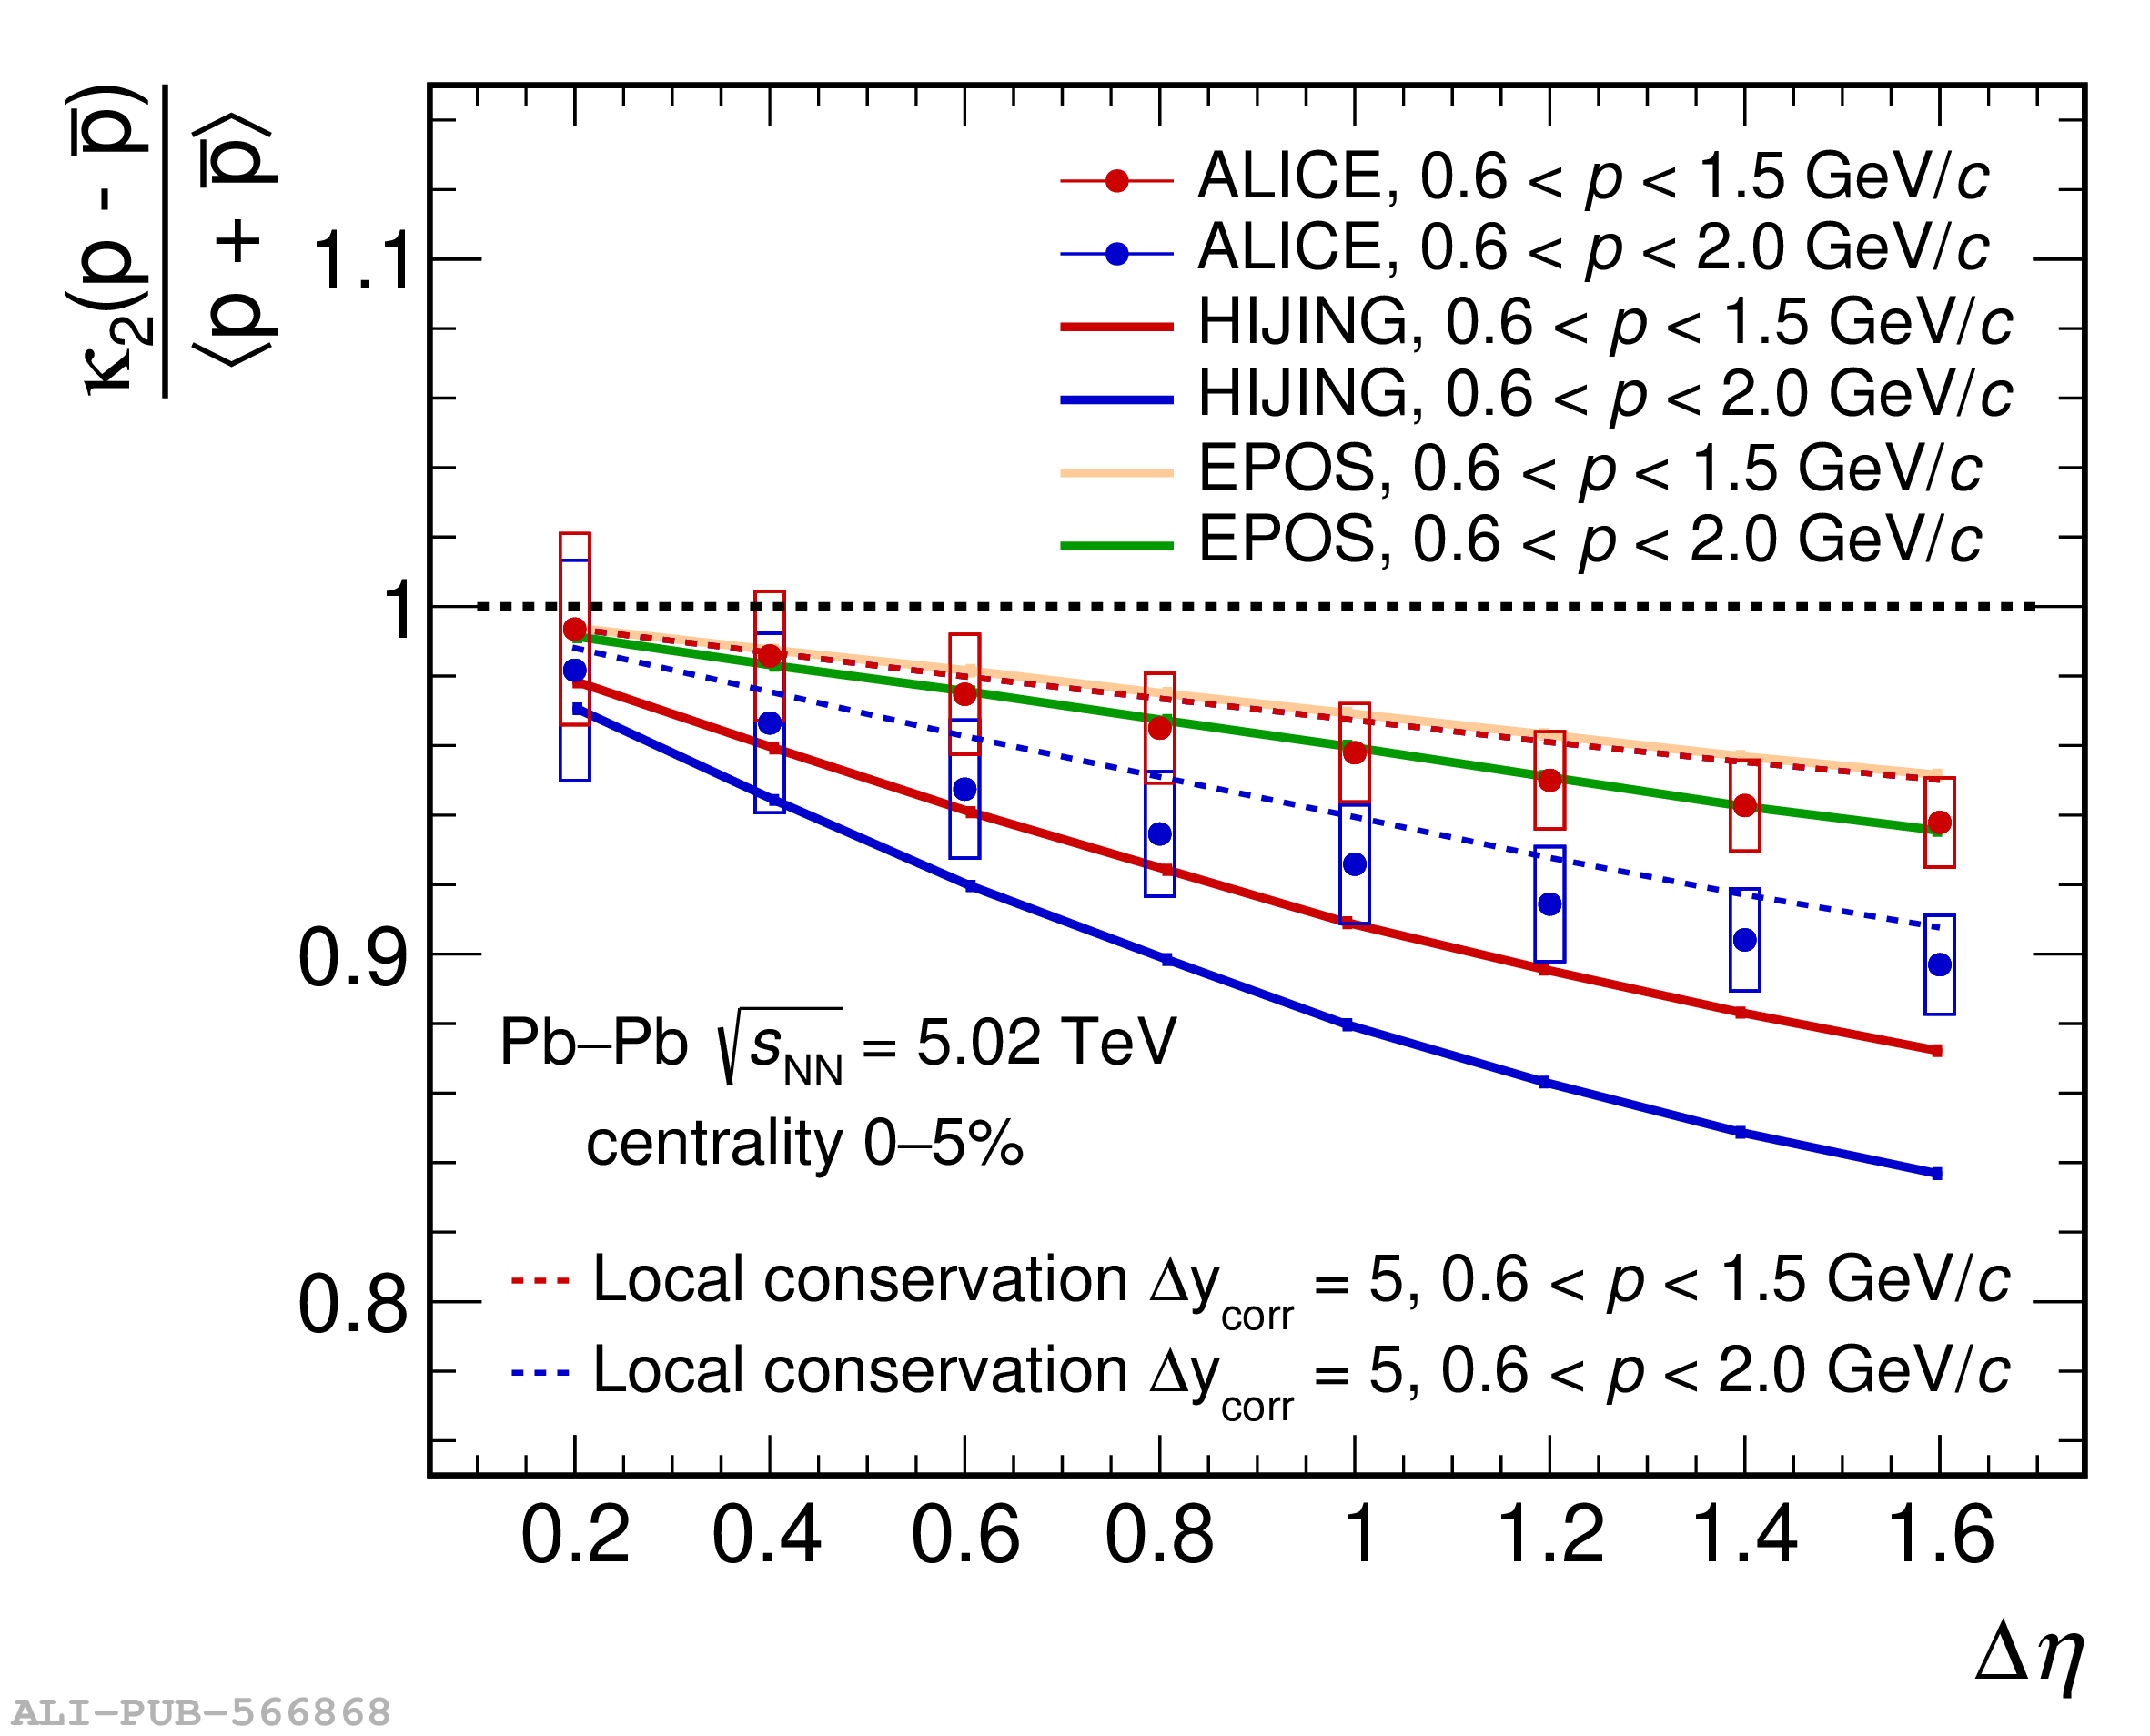 |