Centrality (left) and pseudorapidity interval (right) dependence of the normalized second-order cumulants of net protons. The ALICE data are shown by black and red markers for $\snn = 2.76$ and $5.02$ TeV, respectively, while the colored shaded areas indicate the results from HIJING and EPOS model calculations at $\snn =5.02$ TeV. The Skellam baseline is shown by the horizontal dashed black line. In the right panel the expectation from global baryon number conservation is shown as a pink band and the dashed colored lines represent the predictions of the model with local baryon number conservation . | 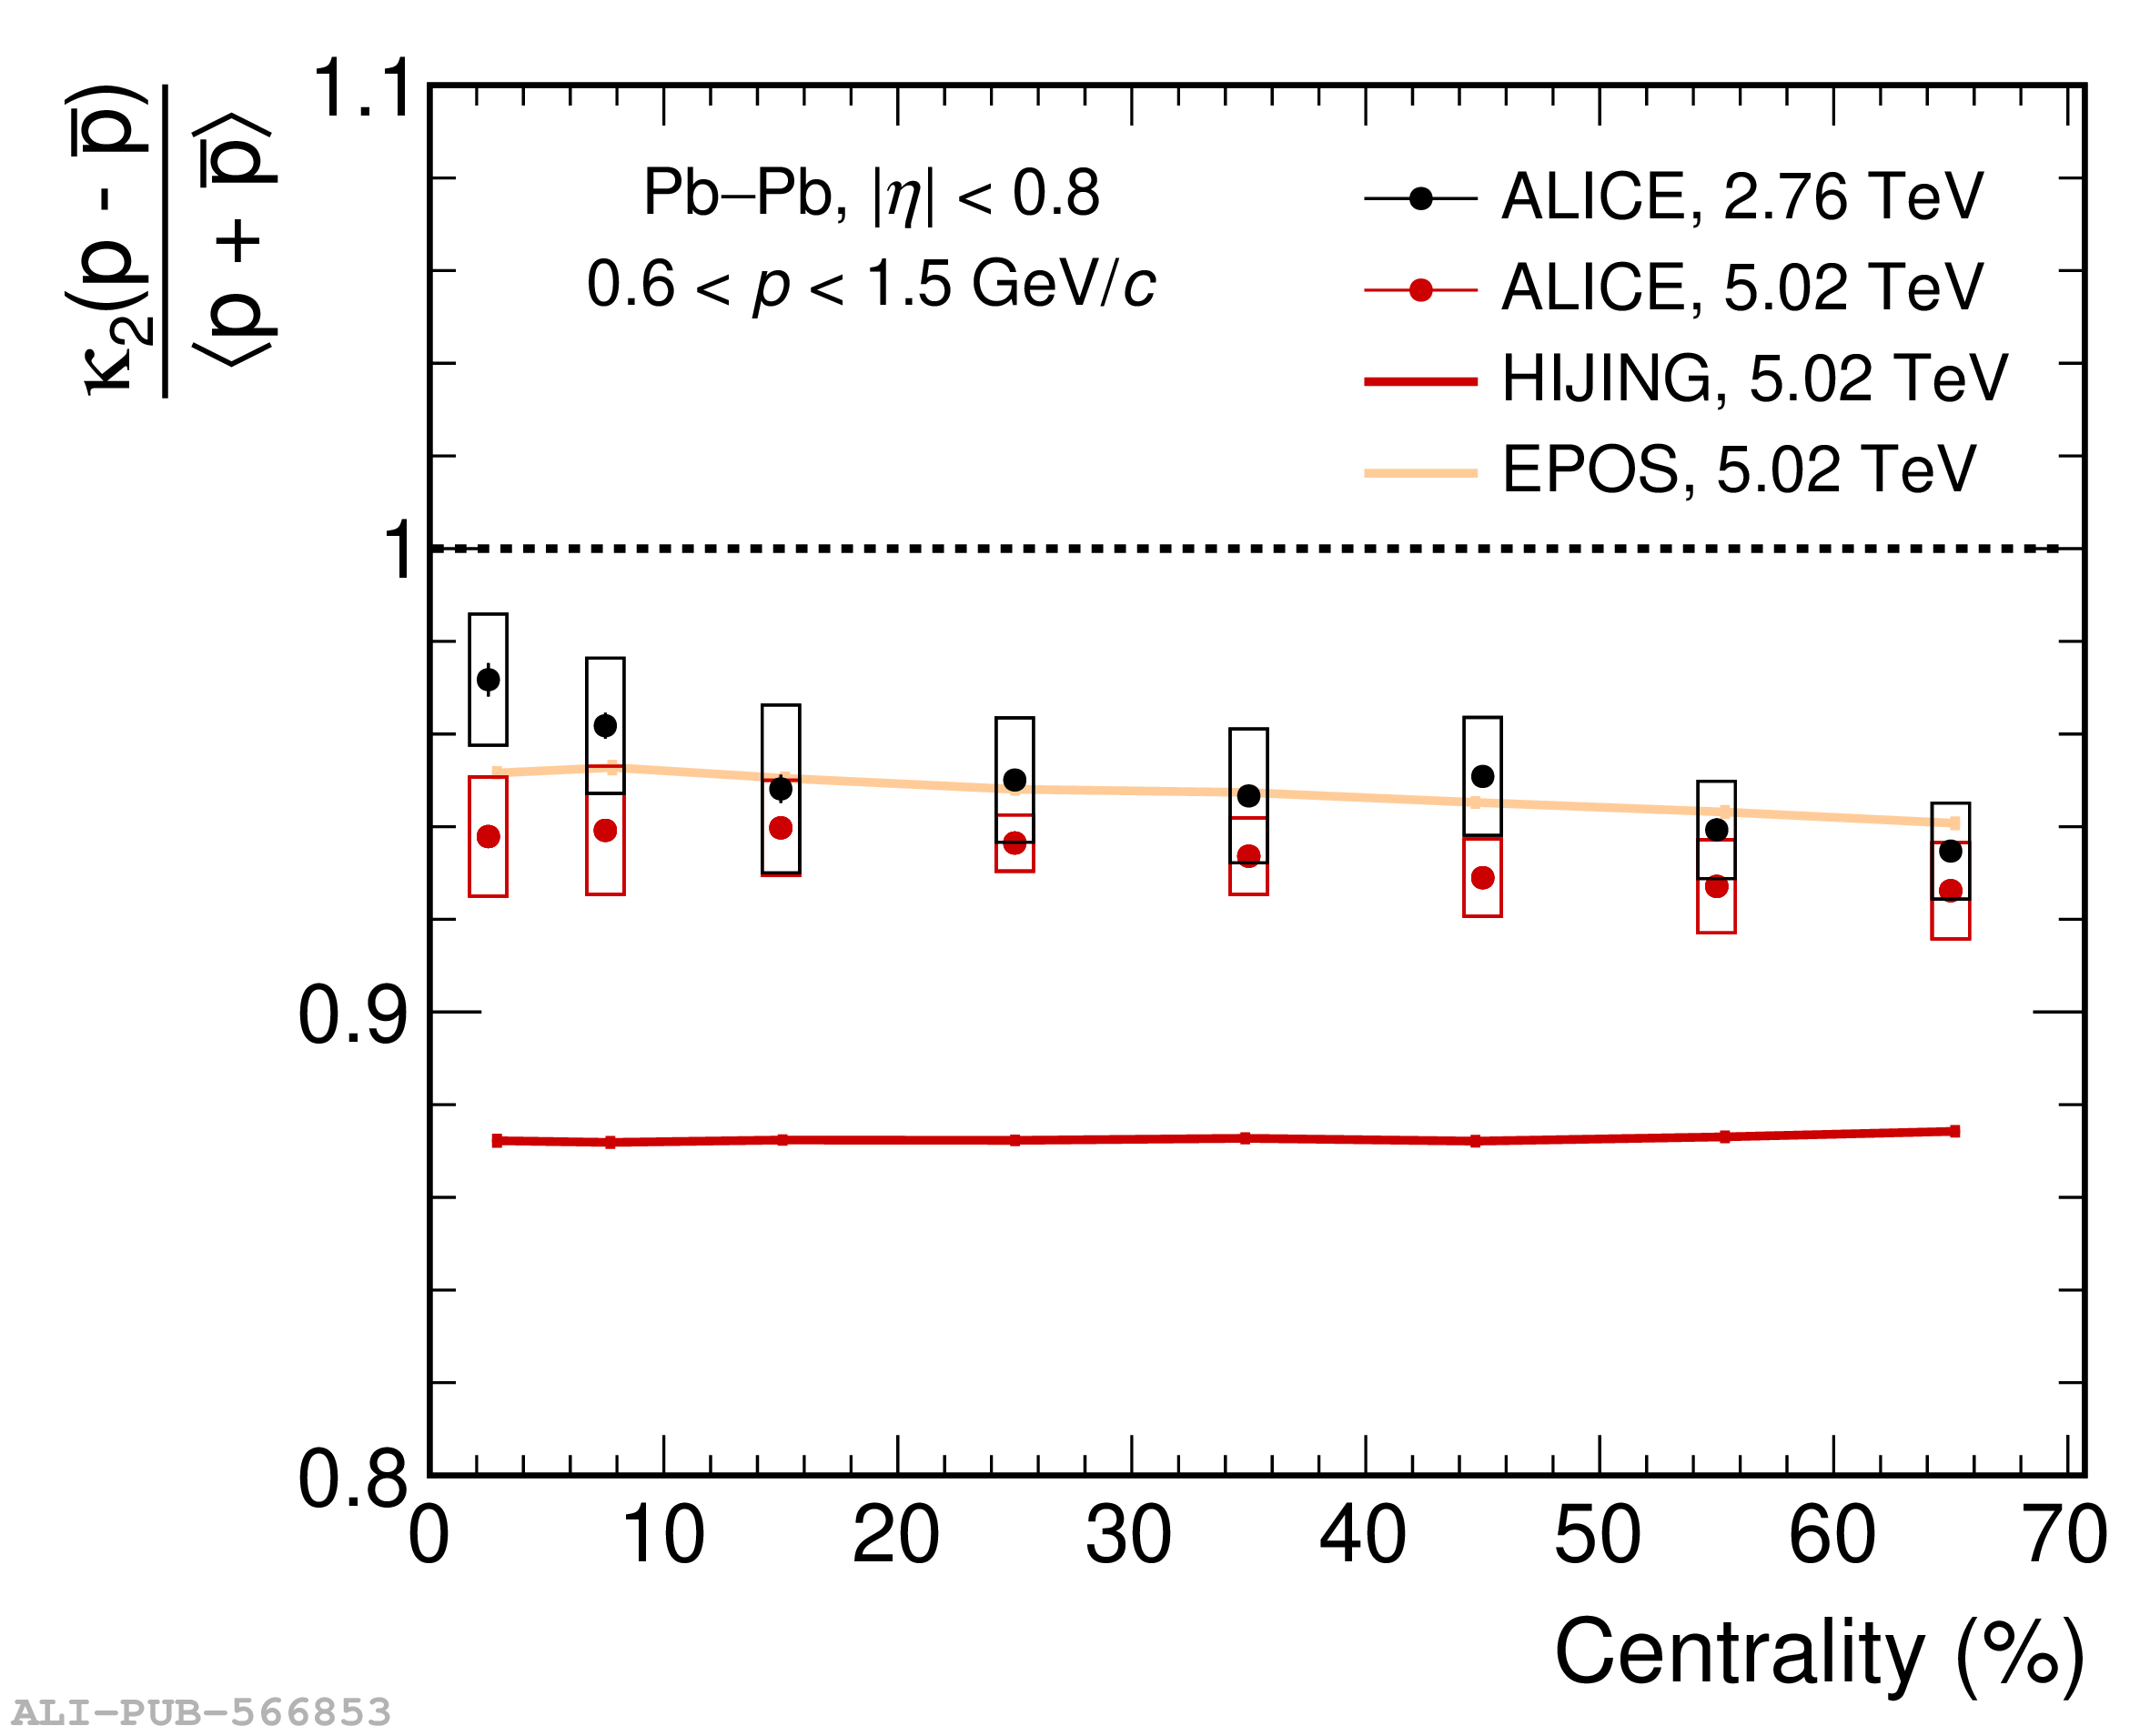 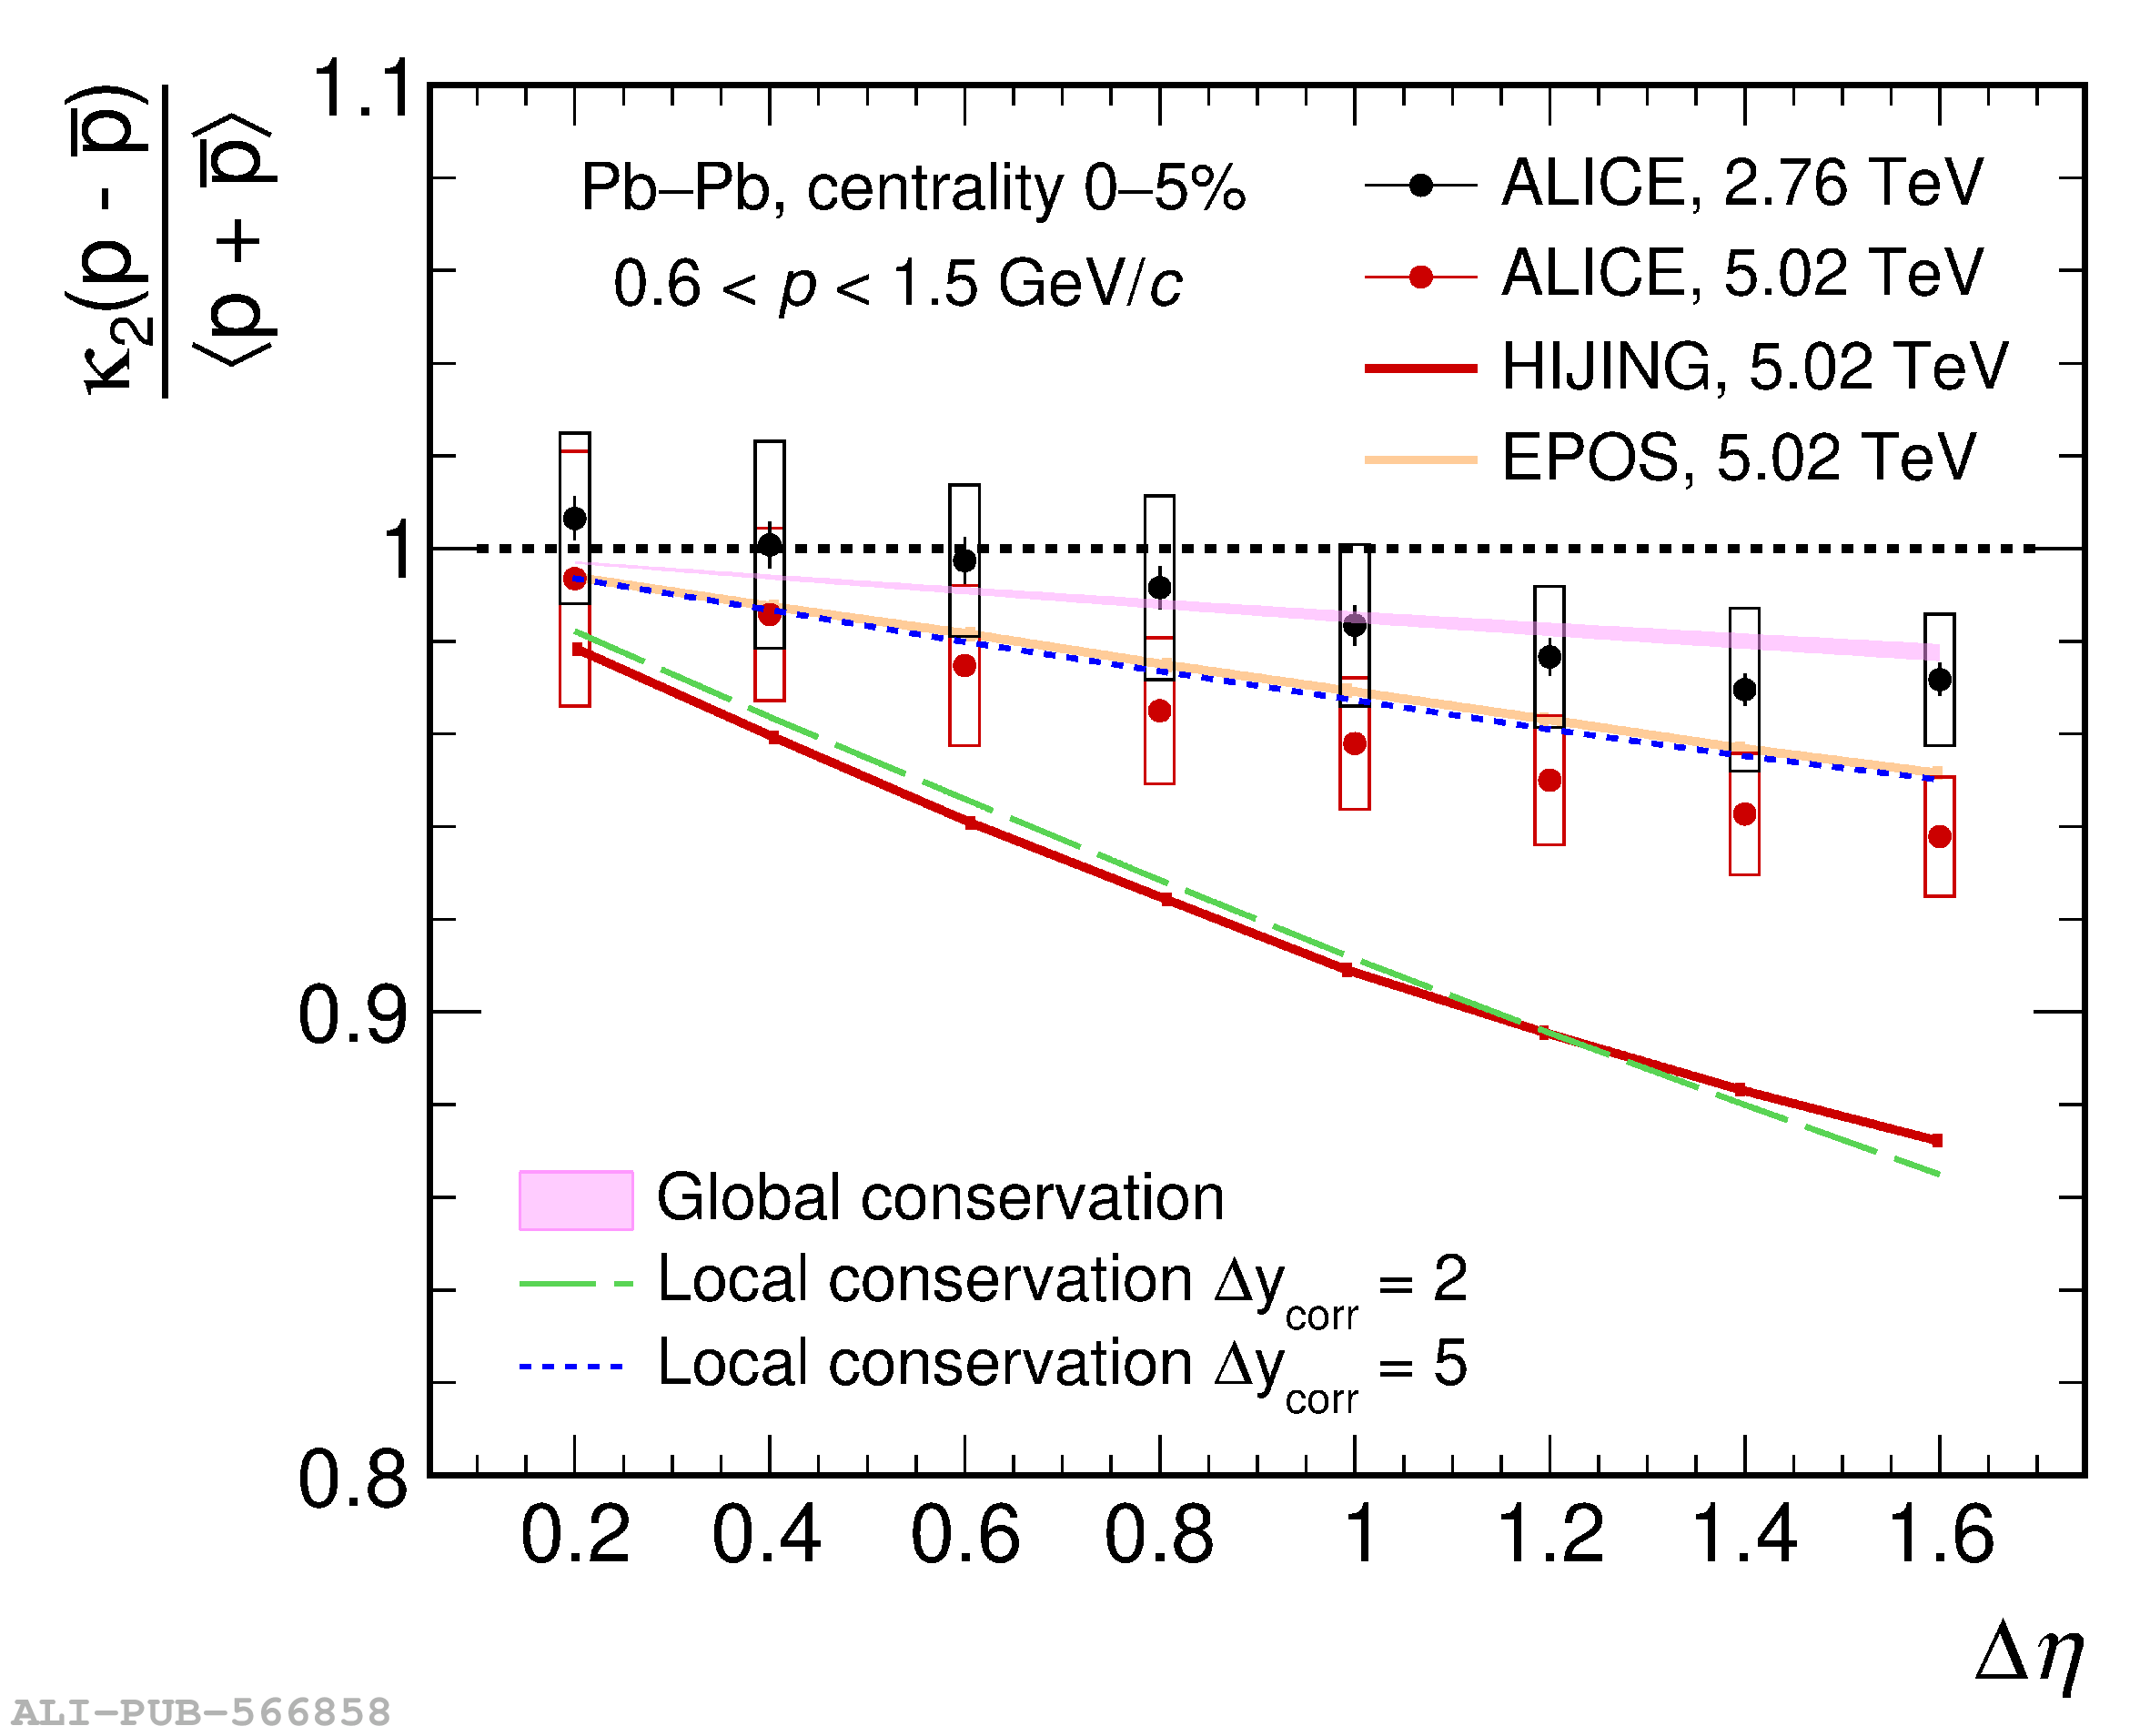 |