Top panels: Inclusive photon multiplicity distributions measured within 2.3 $<$ $\etalab$ $<$ 3.9 in \pp (a), \pPb (b), and \Pbp (c) collisions at \fivenn. Results from various MC predictions are superimposed Bottom panels: The ratios between MC results and data are shown. Shaded boxes represent the systematic uncertainties. | 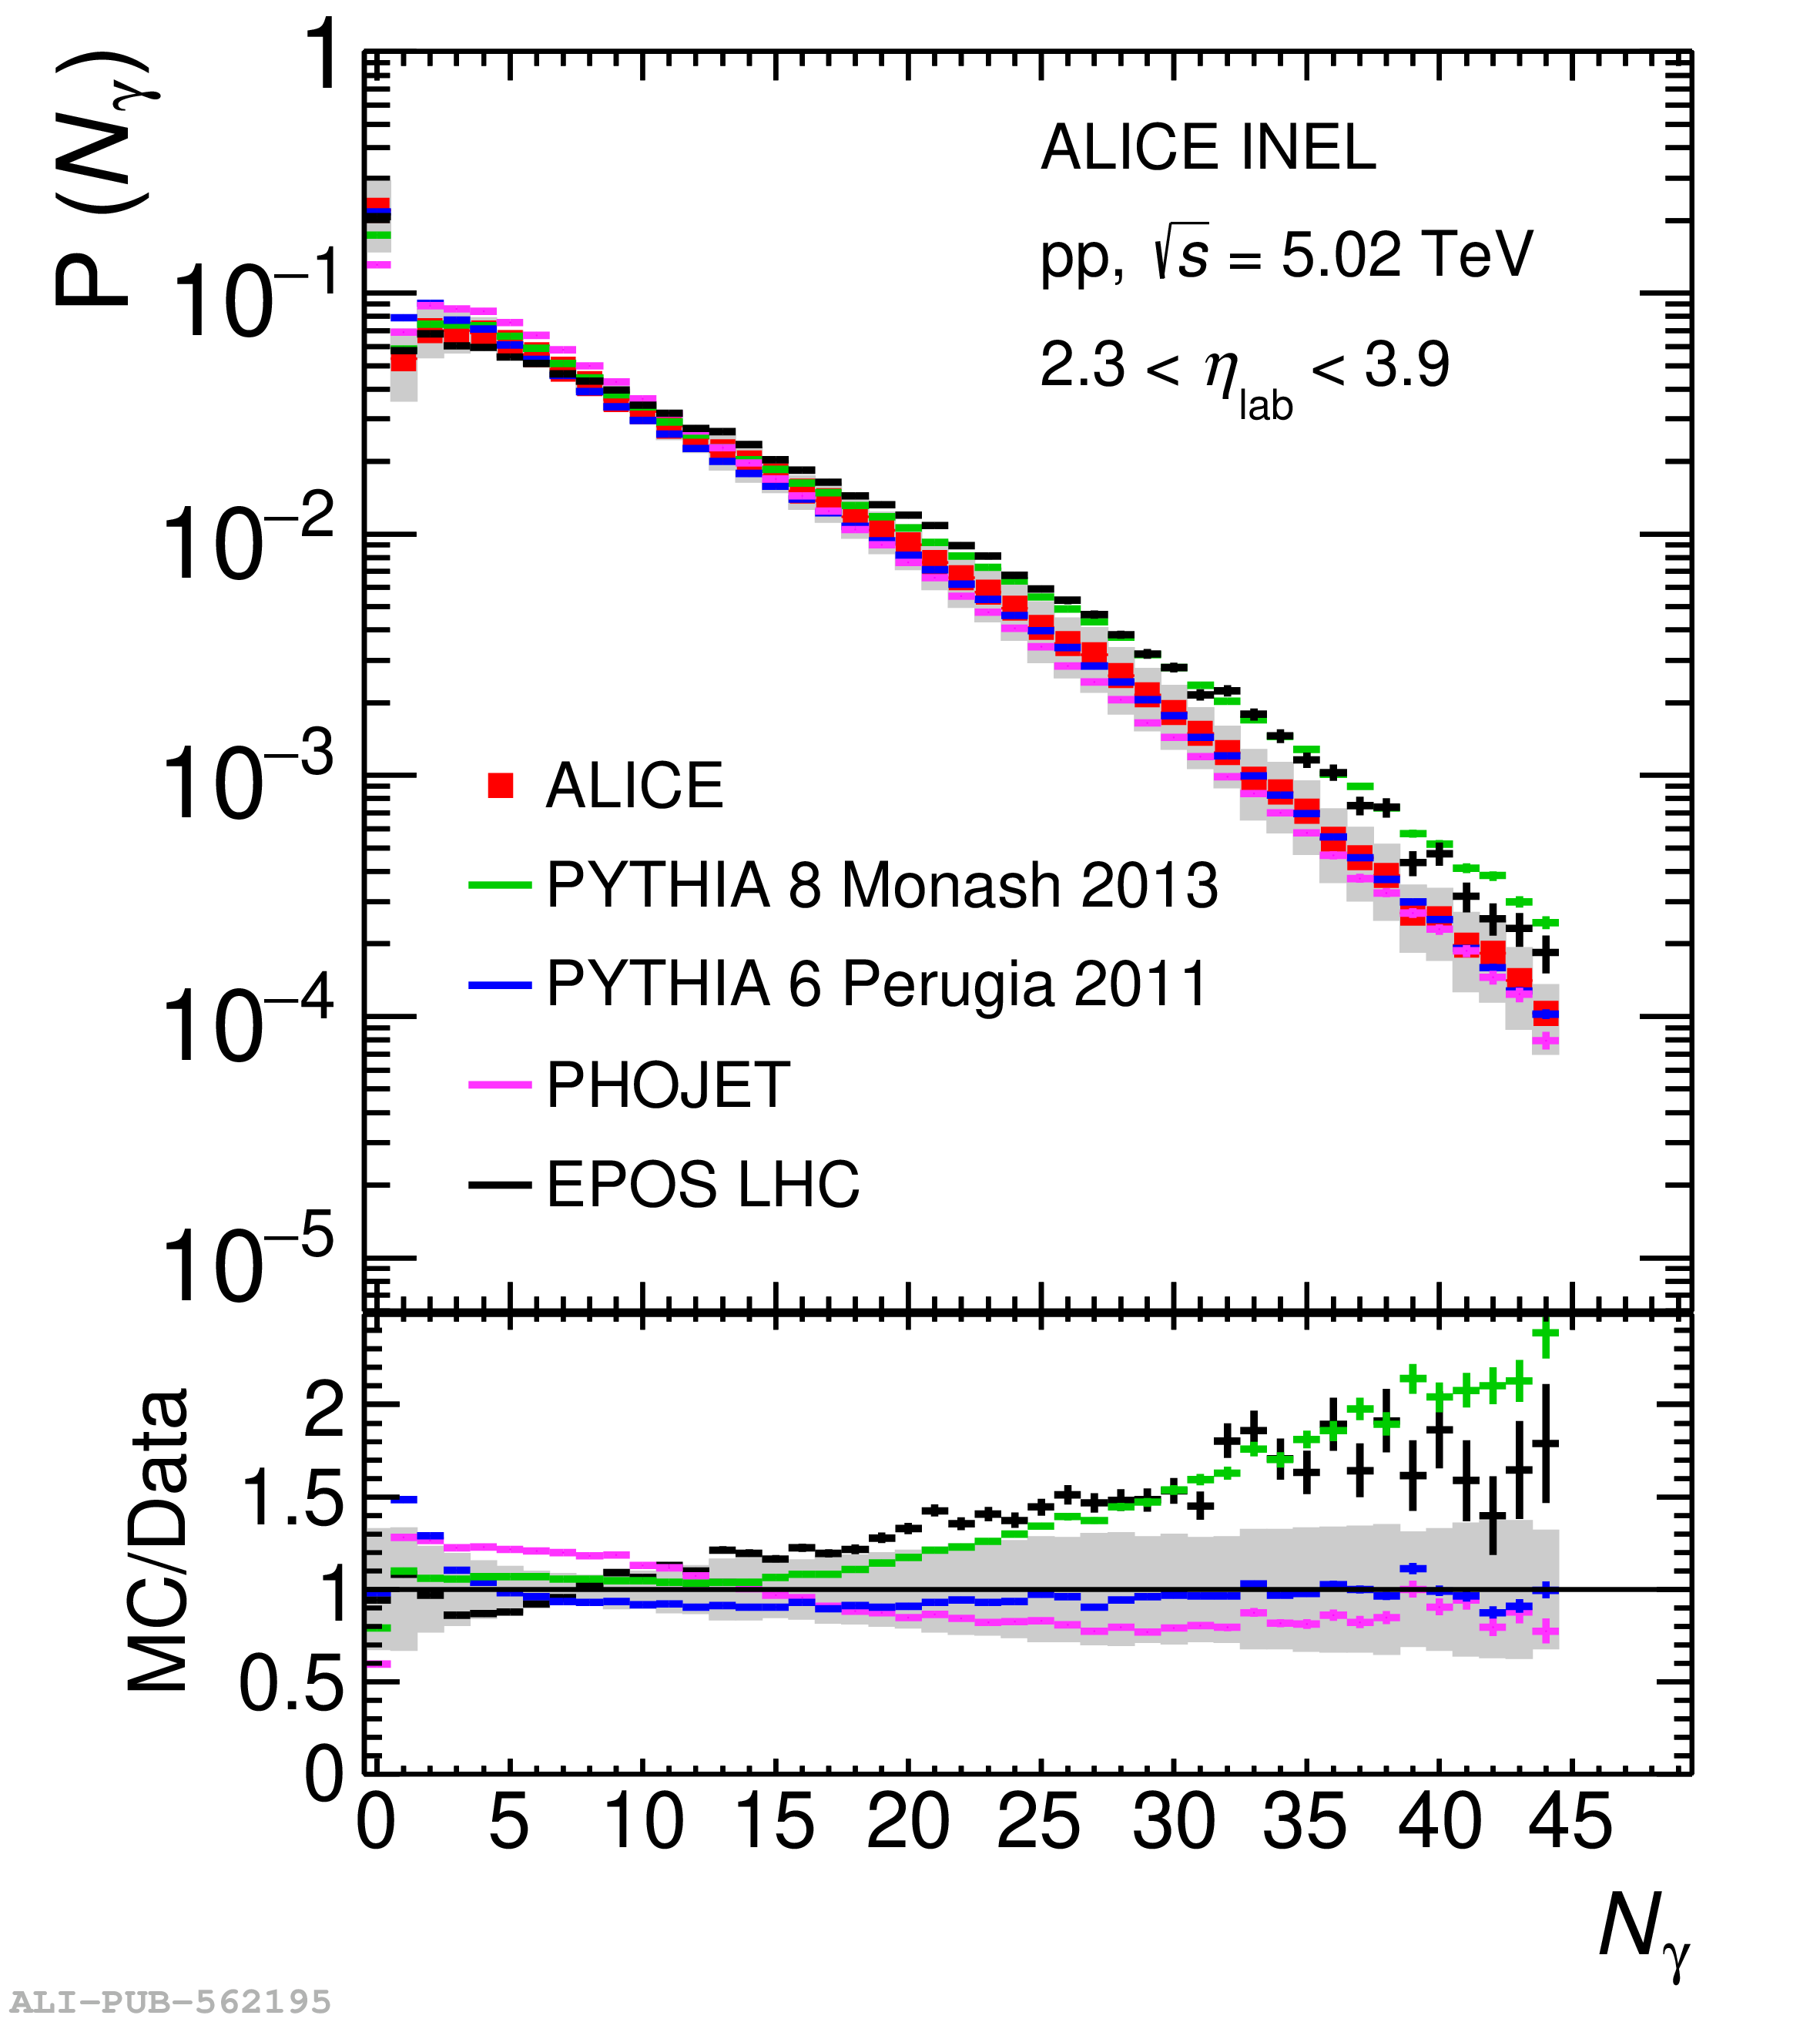 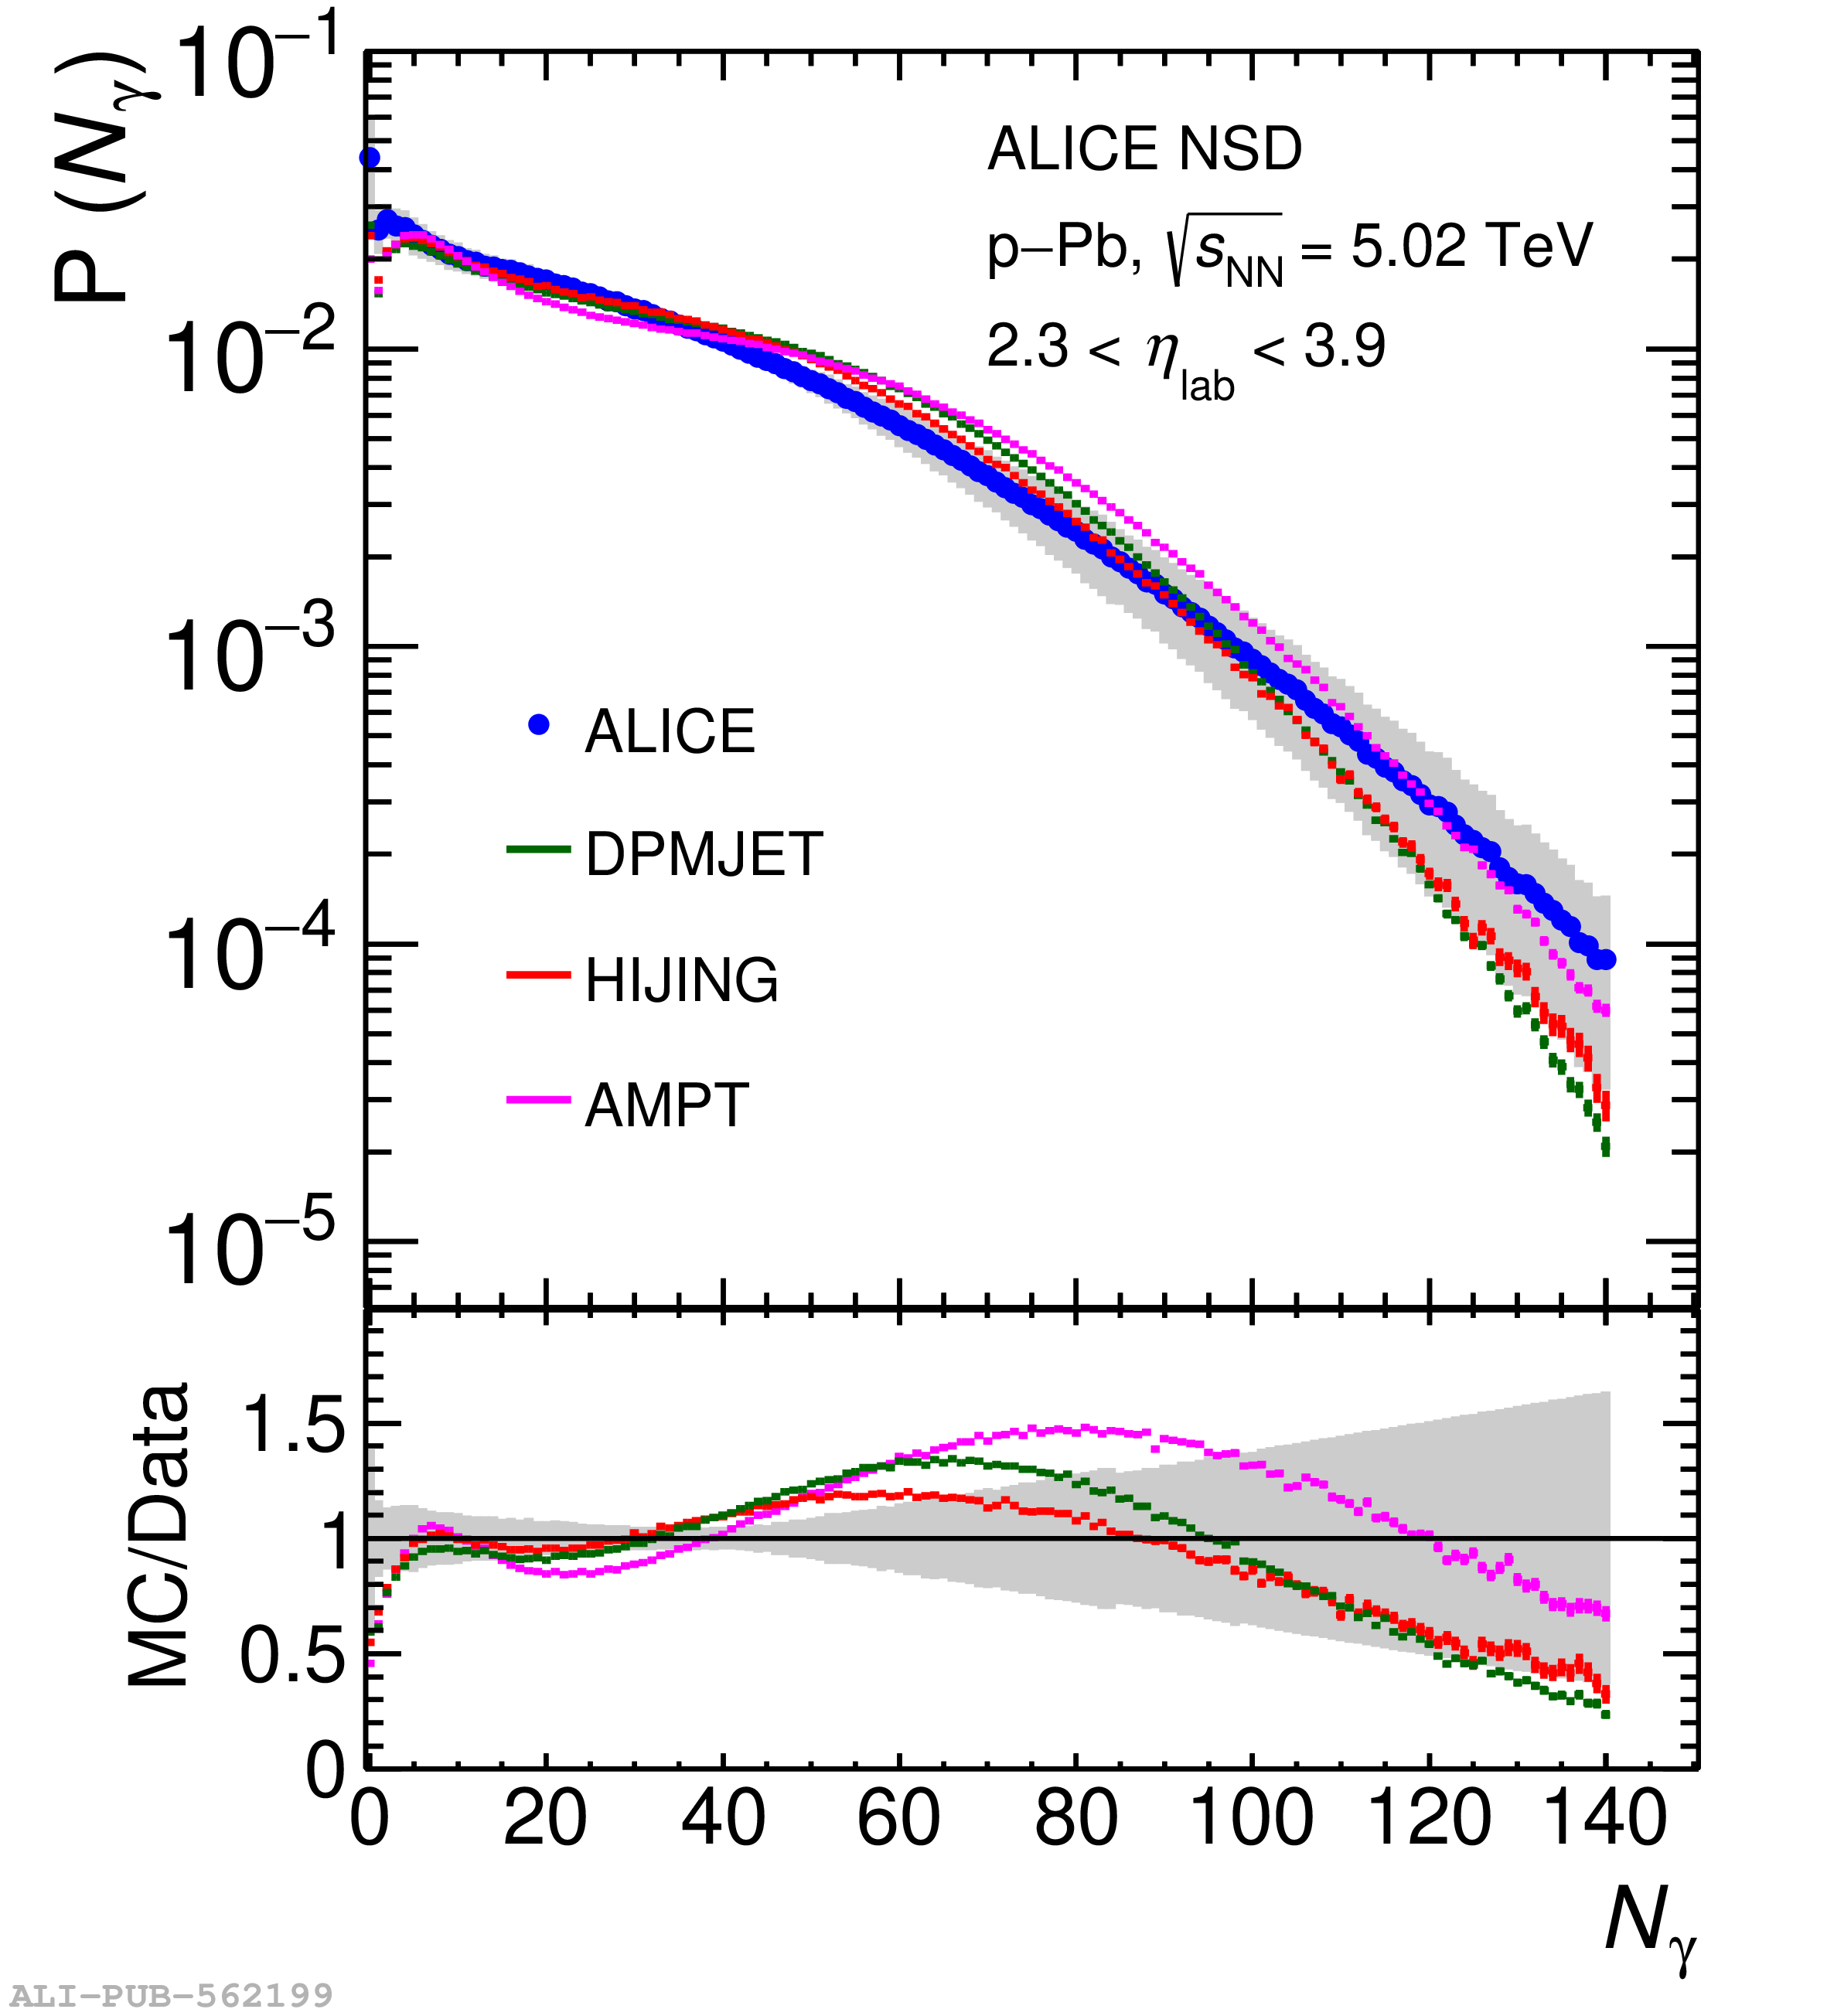 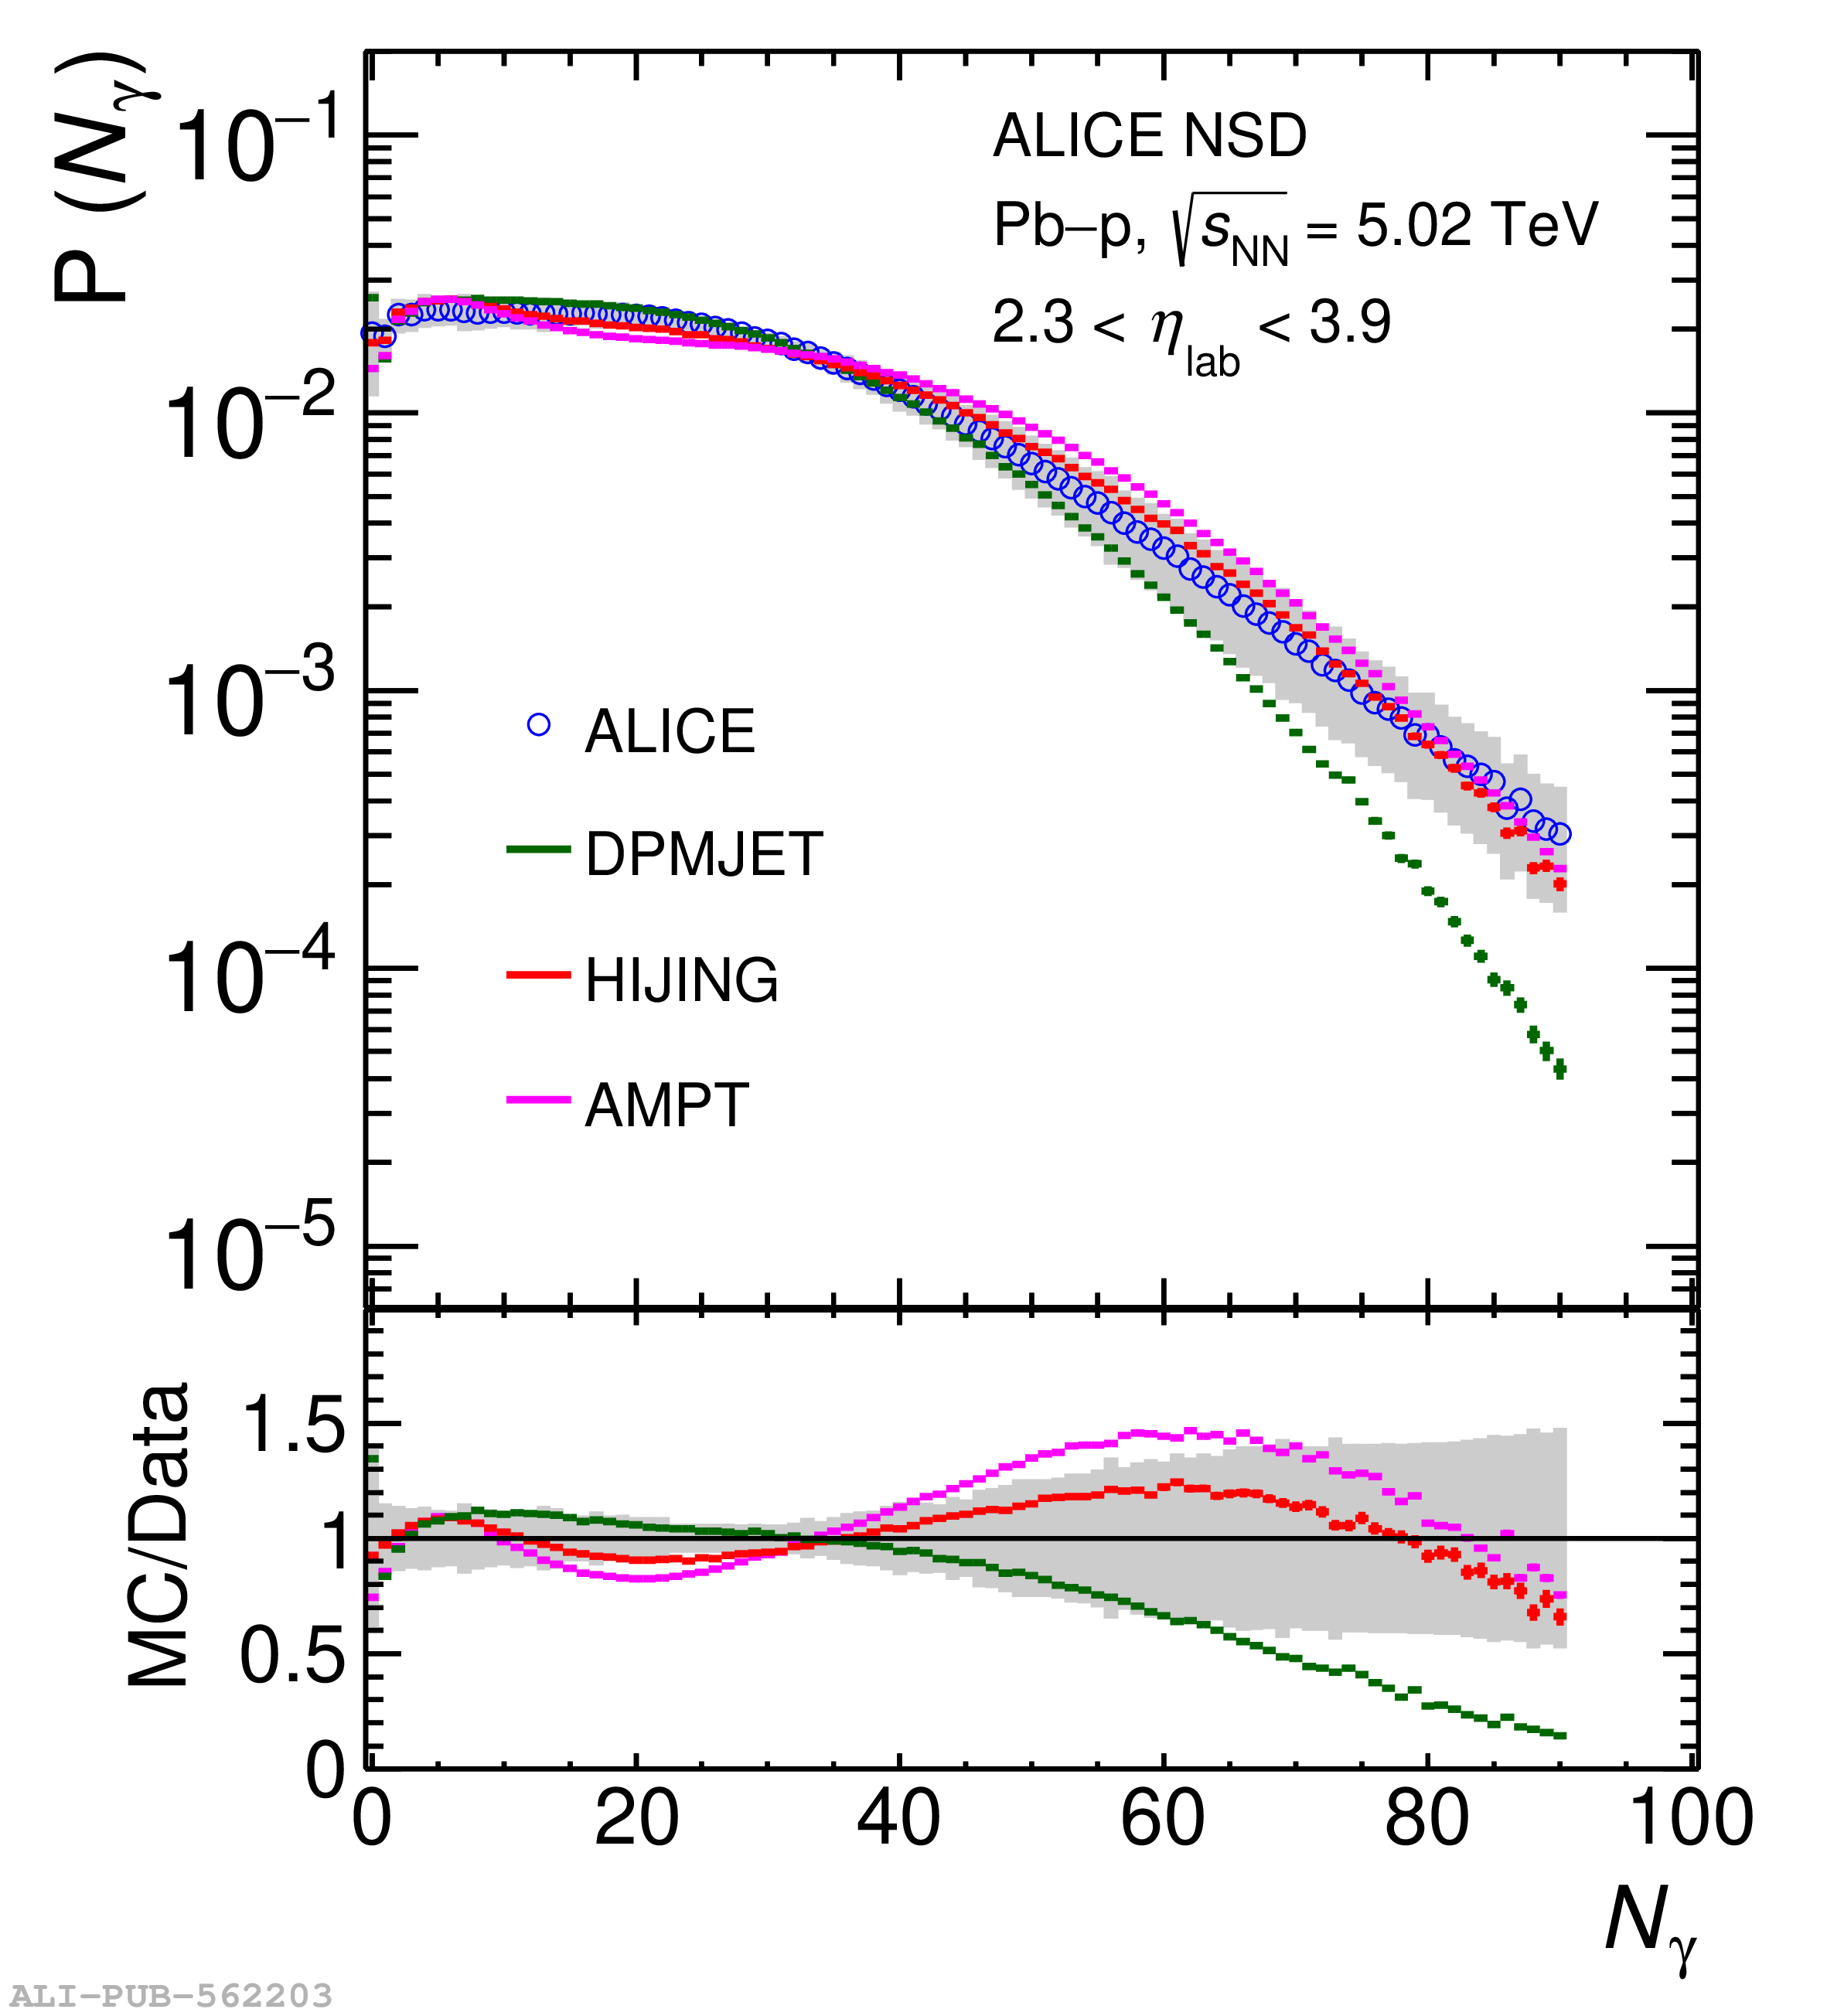 |