A study of multiplicity and pseudorapidity distributions of inclusive photons measured in pp and p$-$Pb collisions at a center-of-mass energy per nucleon$-$nucleon collision of $\sqrt{s_{\rm NN}} = 5.02$ TeV using the ALICE detector in the forward pseudorapidity region $2.3 <~ \eta_{\rm lab} <~ 3.9$ is presented. Measurements in p$-$Pb collisions are reported for two beam configurations in which the directions of the proton and lead ion beam were reversed. The pseudorapidity distributions in p$-$Pb collisions are obtained for seven centrality classes which are defined based on different event activity estimators, i.e., the charged-particle multiplicity measured at midrapidity as well as the energy deposited in a calorimeter at beam rapidity. The inclusive photon multiplicity distributions for both pp and p$-$Pb collisions are described by double negative binomial distributions. The pseudorapidity distributions of inclusive photons are compared to those of charged particles at midrapidity in \pp collisions and for different centrality classes in p$-$Pb collisions. The results are compared to predictions from various Monte Carlo event generators. None of the generators considered in this paper reproduces the inclusive photon multiplicity distributions in the reported multiplicity range. The pseudorapidity distributions are, however, better described by the same generators.
Eur. Phys. J. C 83 (2023) 661
HEP Data
e-Print: arXiv:2303.00590 | PDF | inSPIRE
CERN-EP-2023-026
Figure group
Figure 1
Graphical representation of the detector response matrices for three different collision systems: \pp (a), \pPb (b) and \Pbp (c). The reconstructed and true photon multiplicities are denoted as $N_{\gamma\text-\rm like}$ and $N_{\gamma\text-\rm true}$, respectively, obtained from simulations using PYTHIA 8 with the Monash 2013 tune for \pp collisions and \hijing for \pPb and \Pbp collisions. | 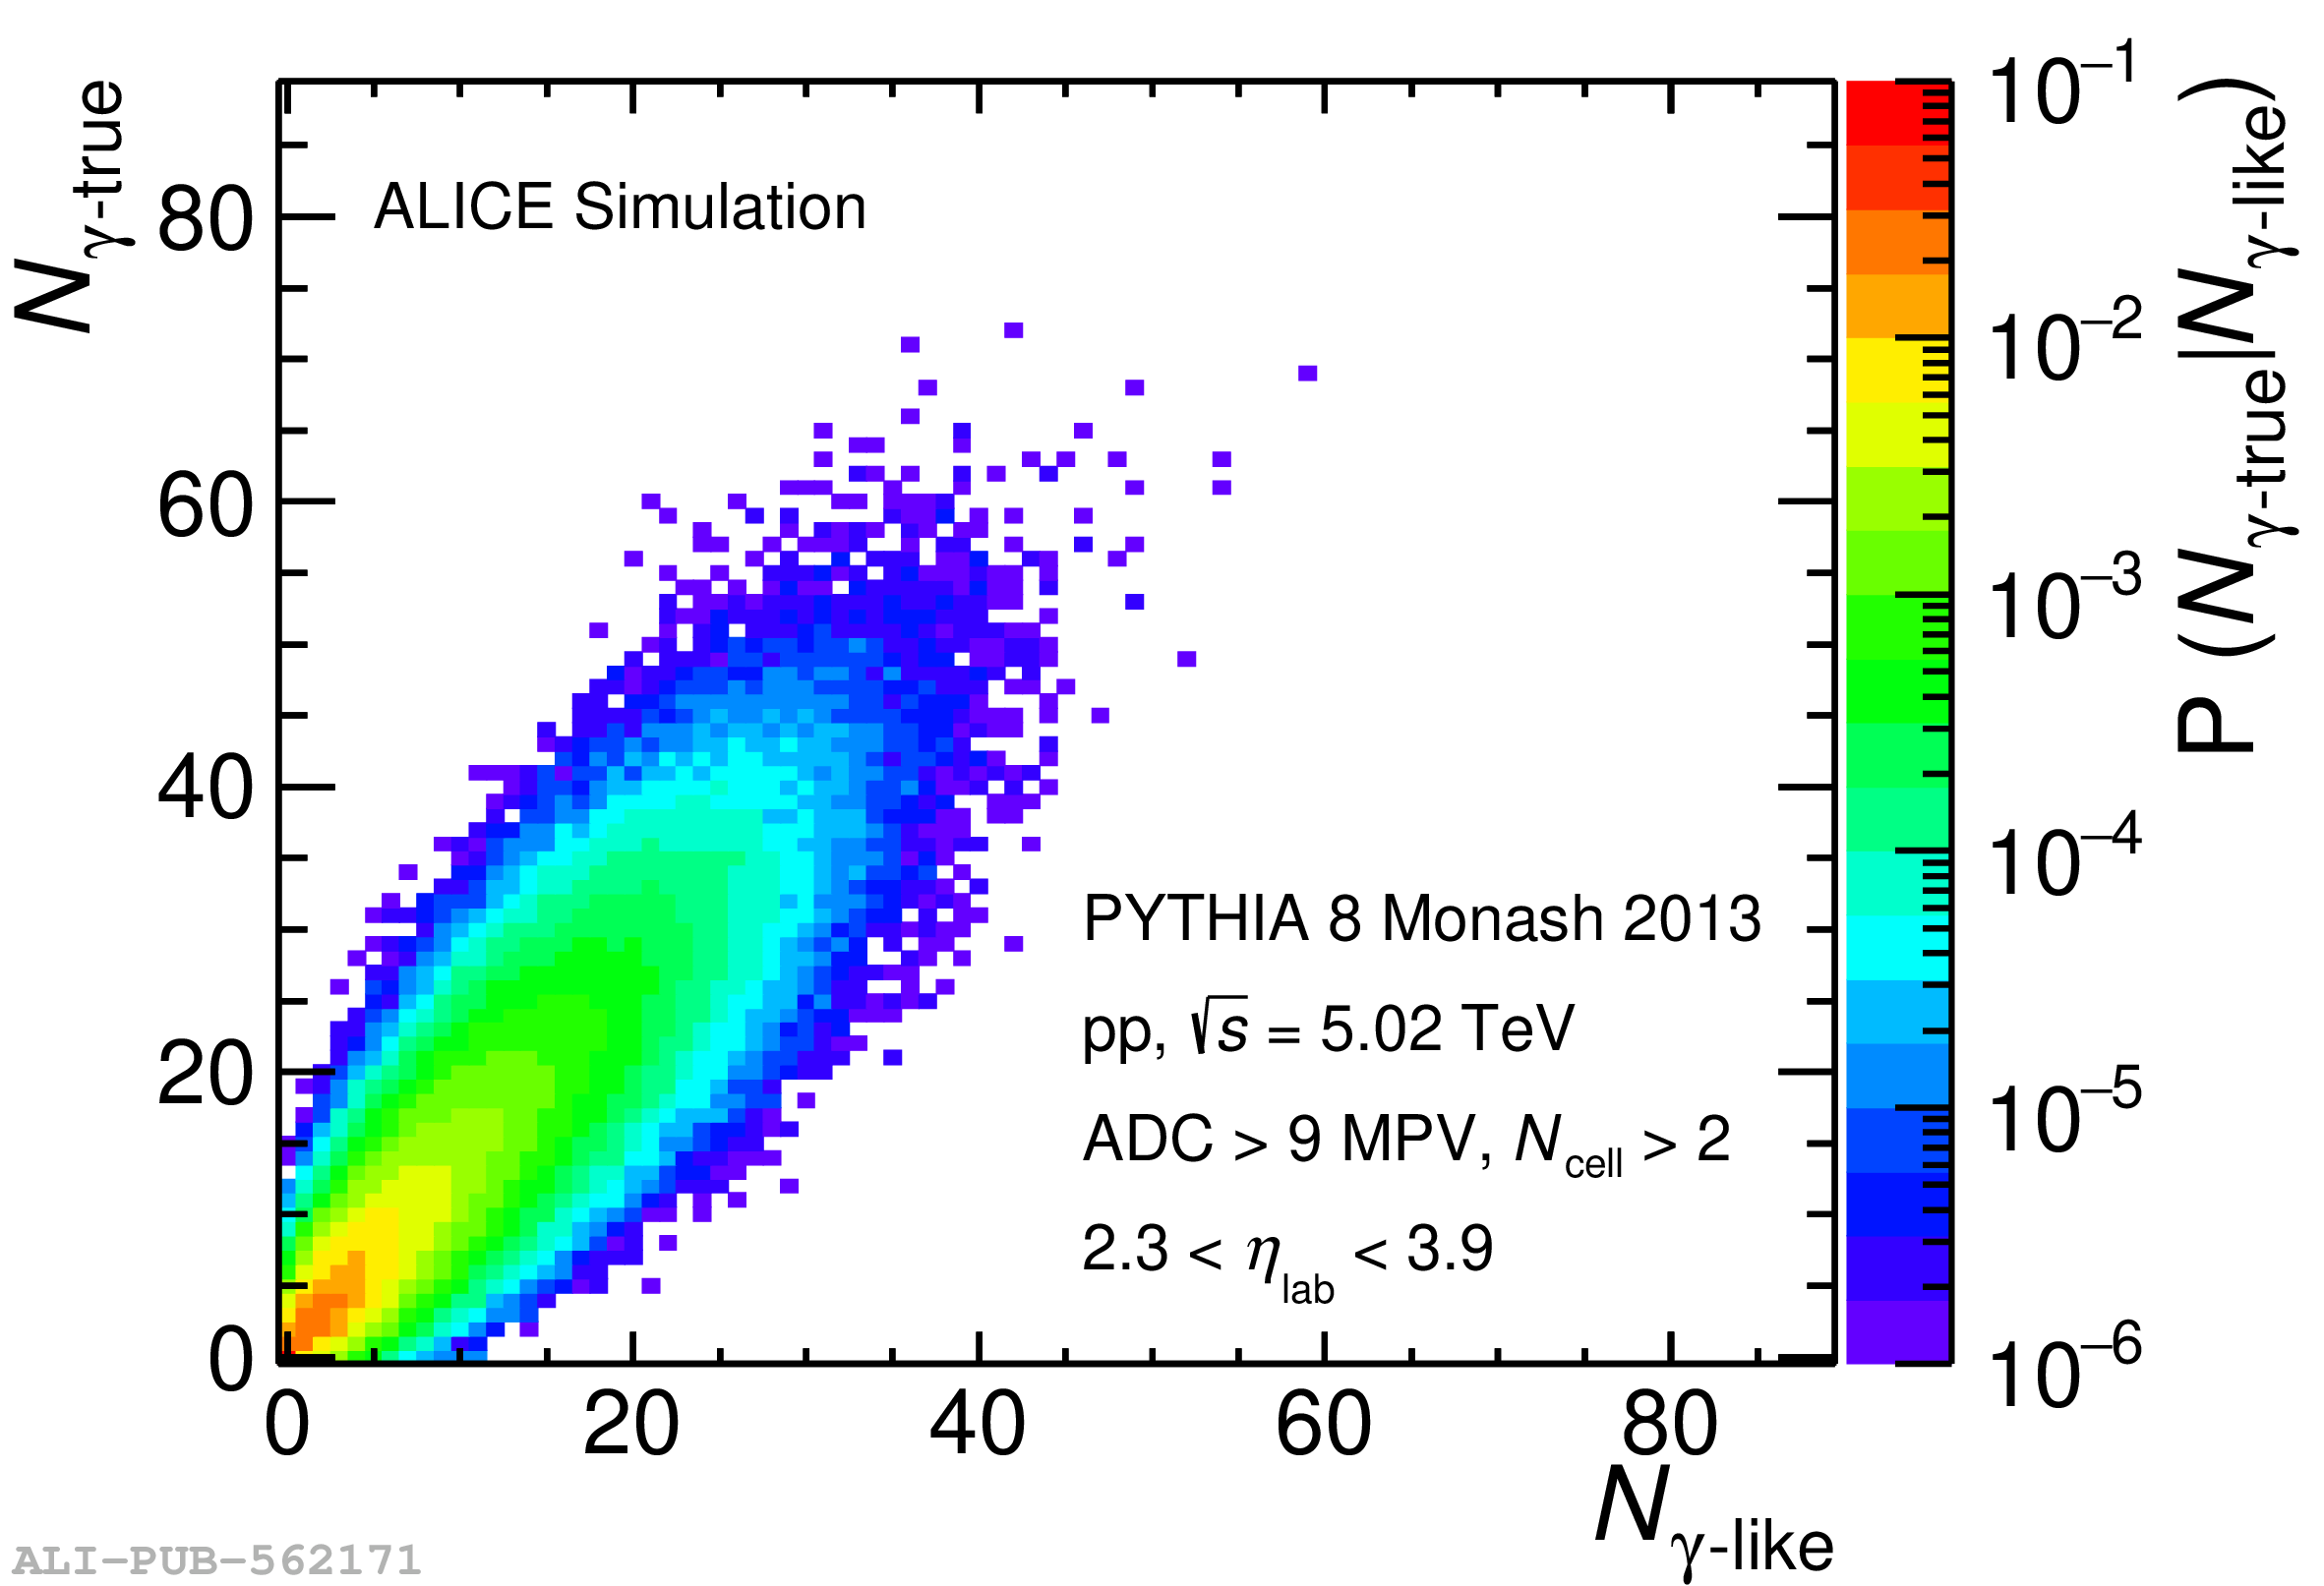  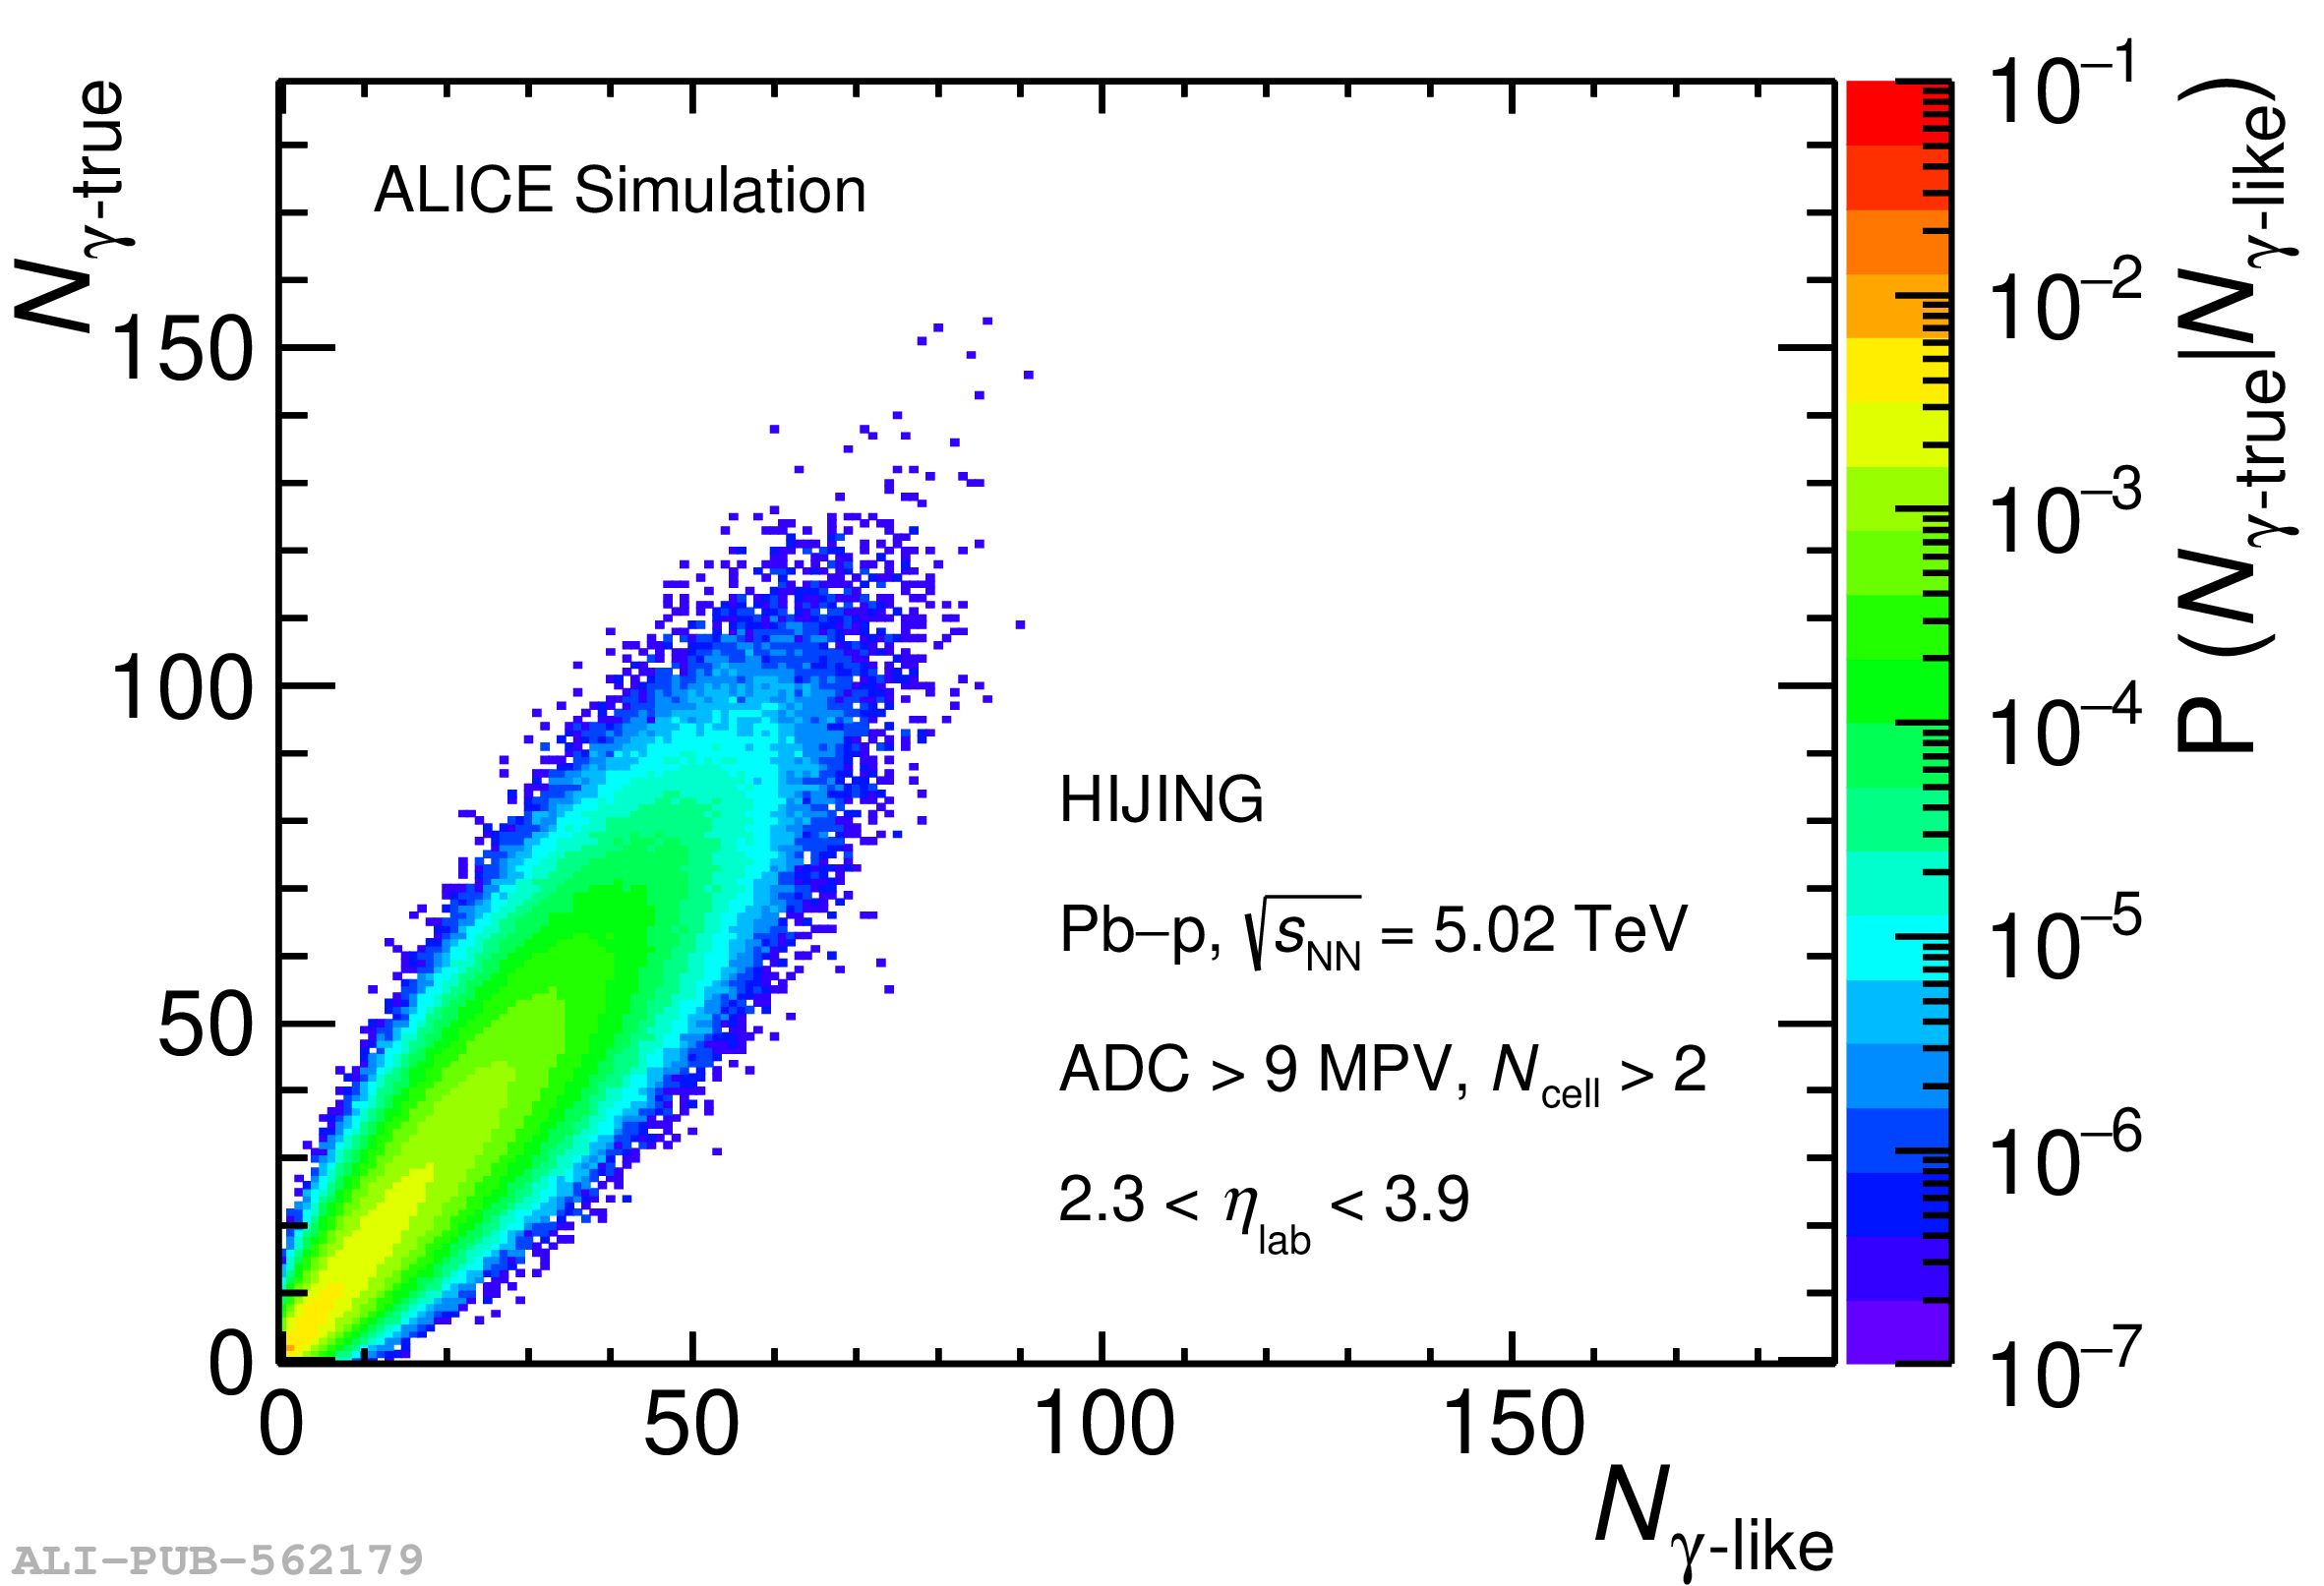 |
Figure 2
MC closure test of the unfolding method for \pp (a), \pPb (b), and \Pbp (c) collisions at \fivenn. The reconstructed, unfolded and true photon multiplicity distributions are presented in the top panels. The ratios of unfolded to true multiplicity distributions are shown in the bottom panels. | 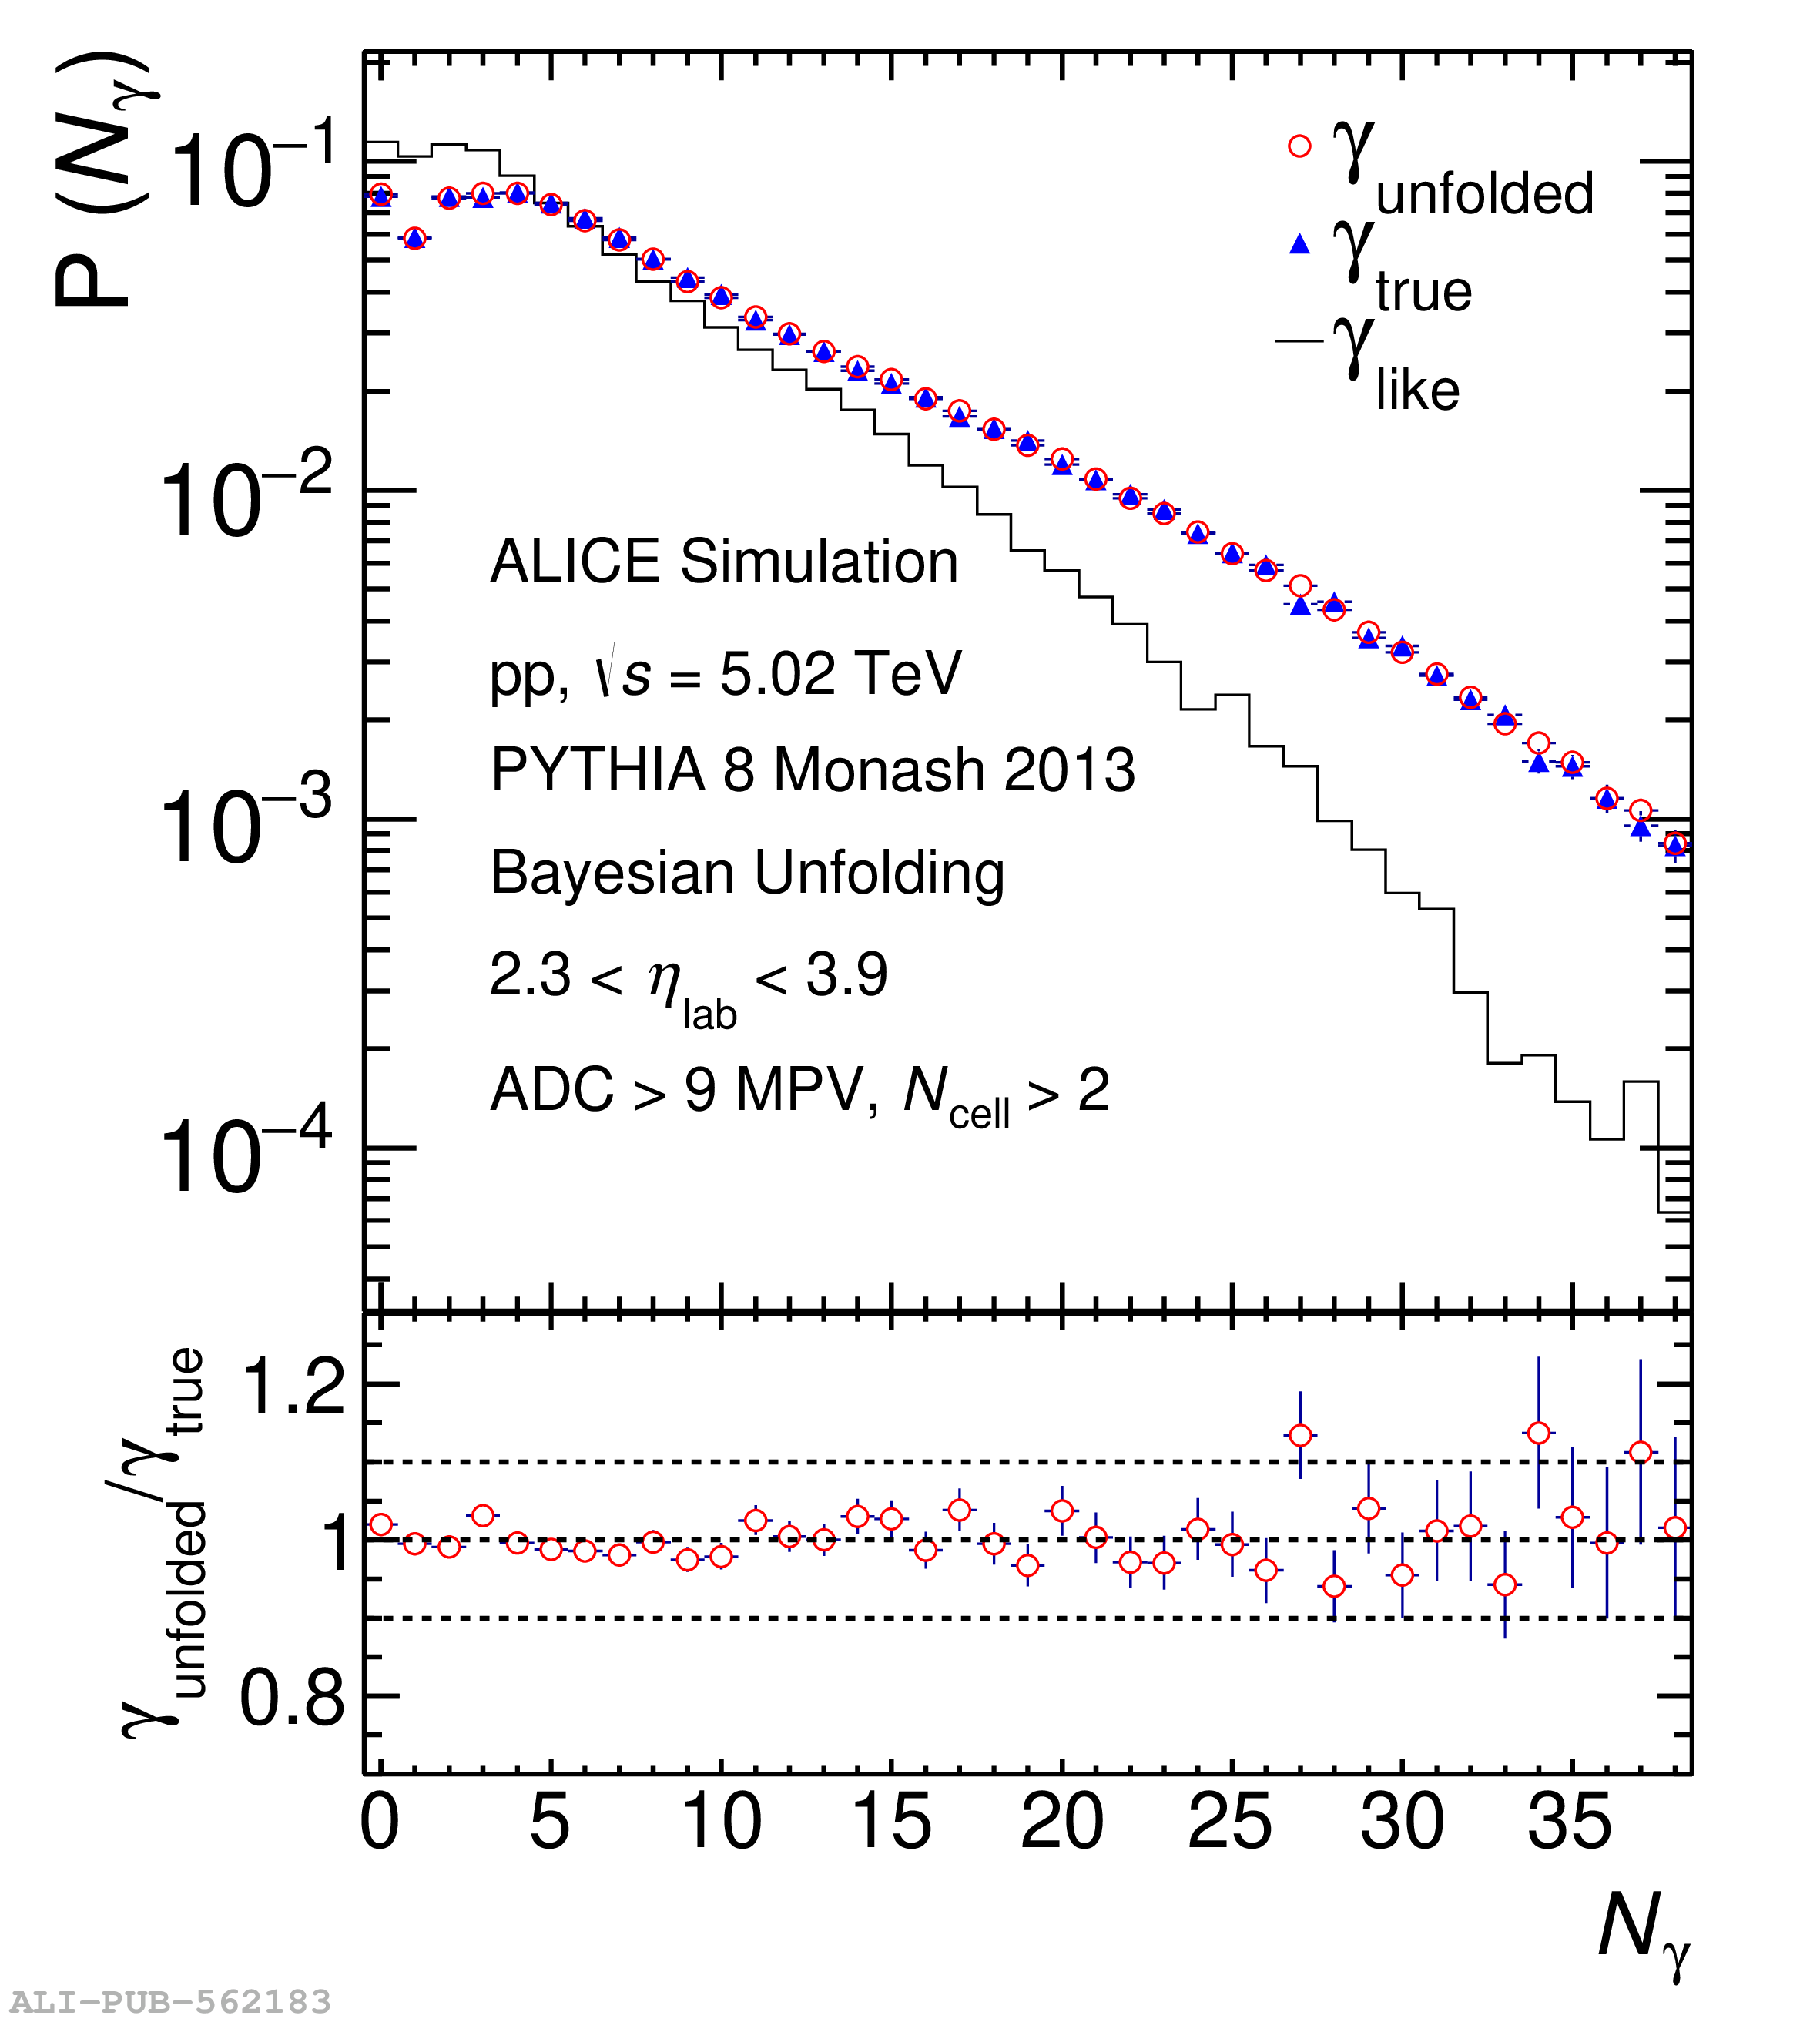 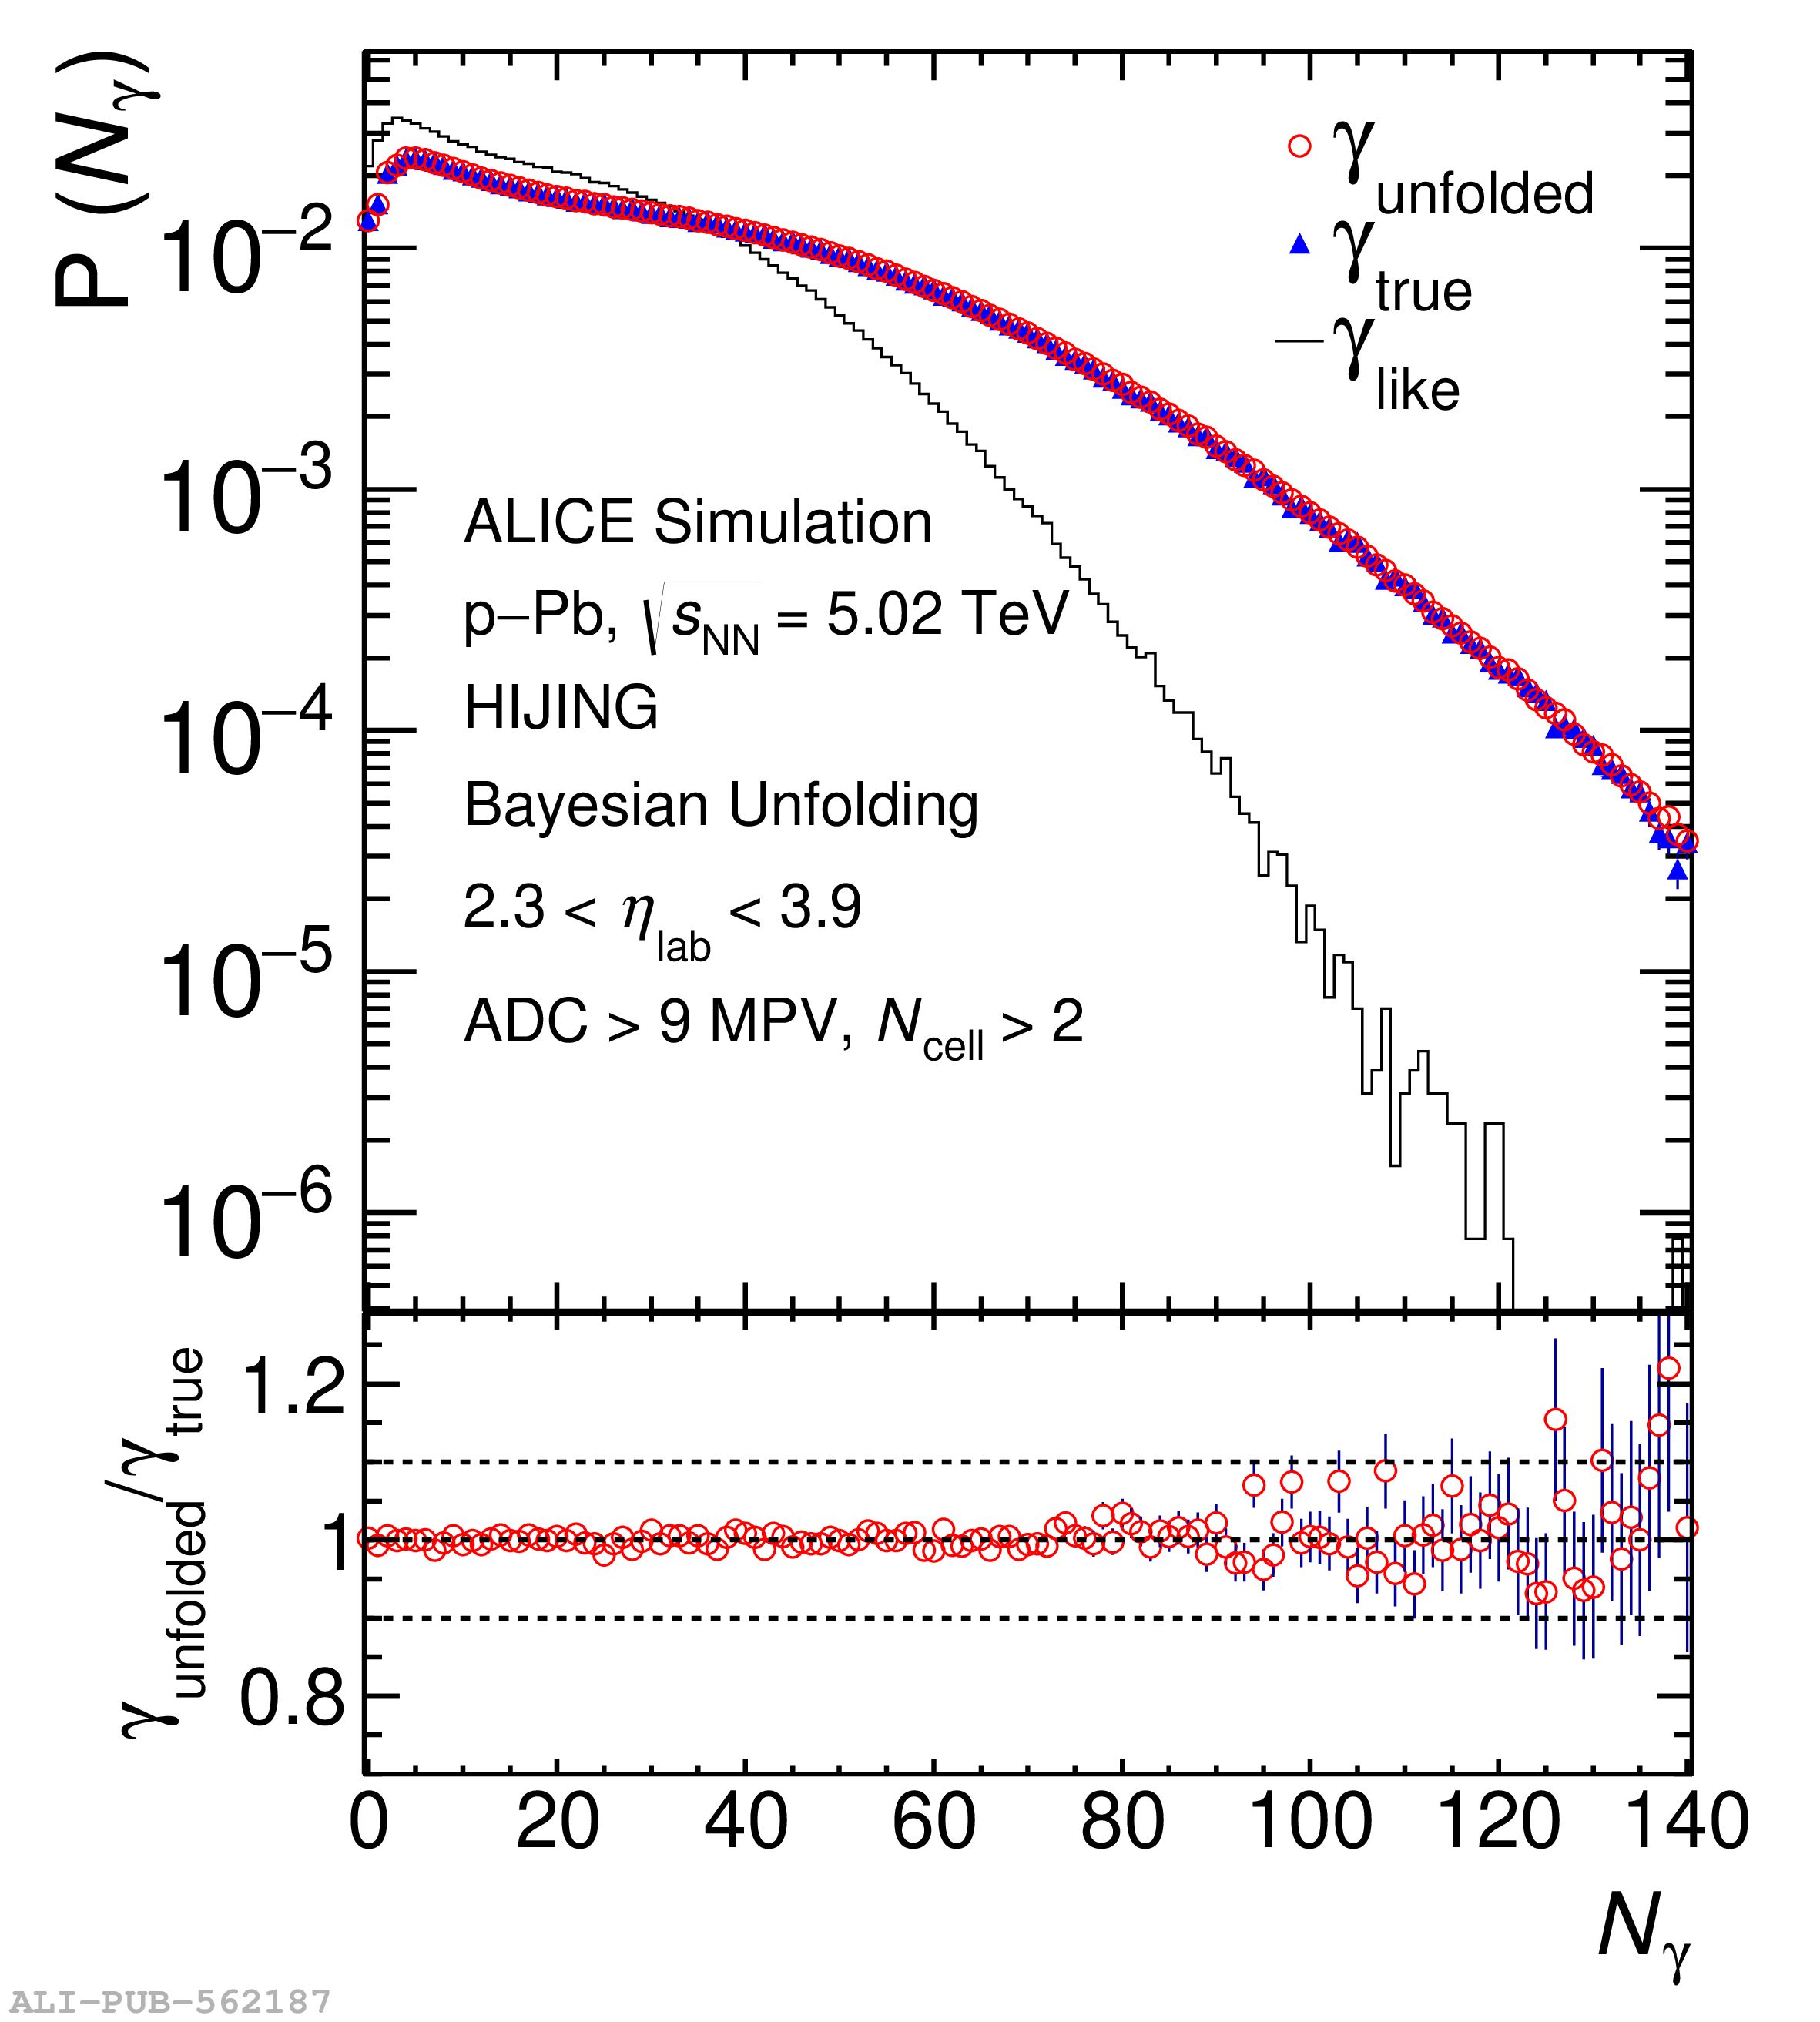 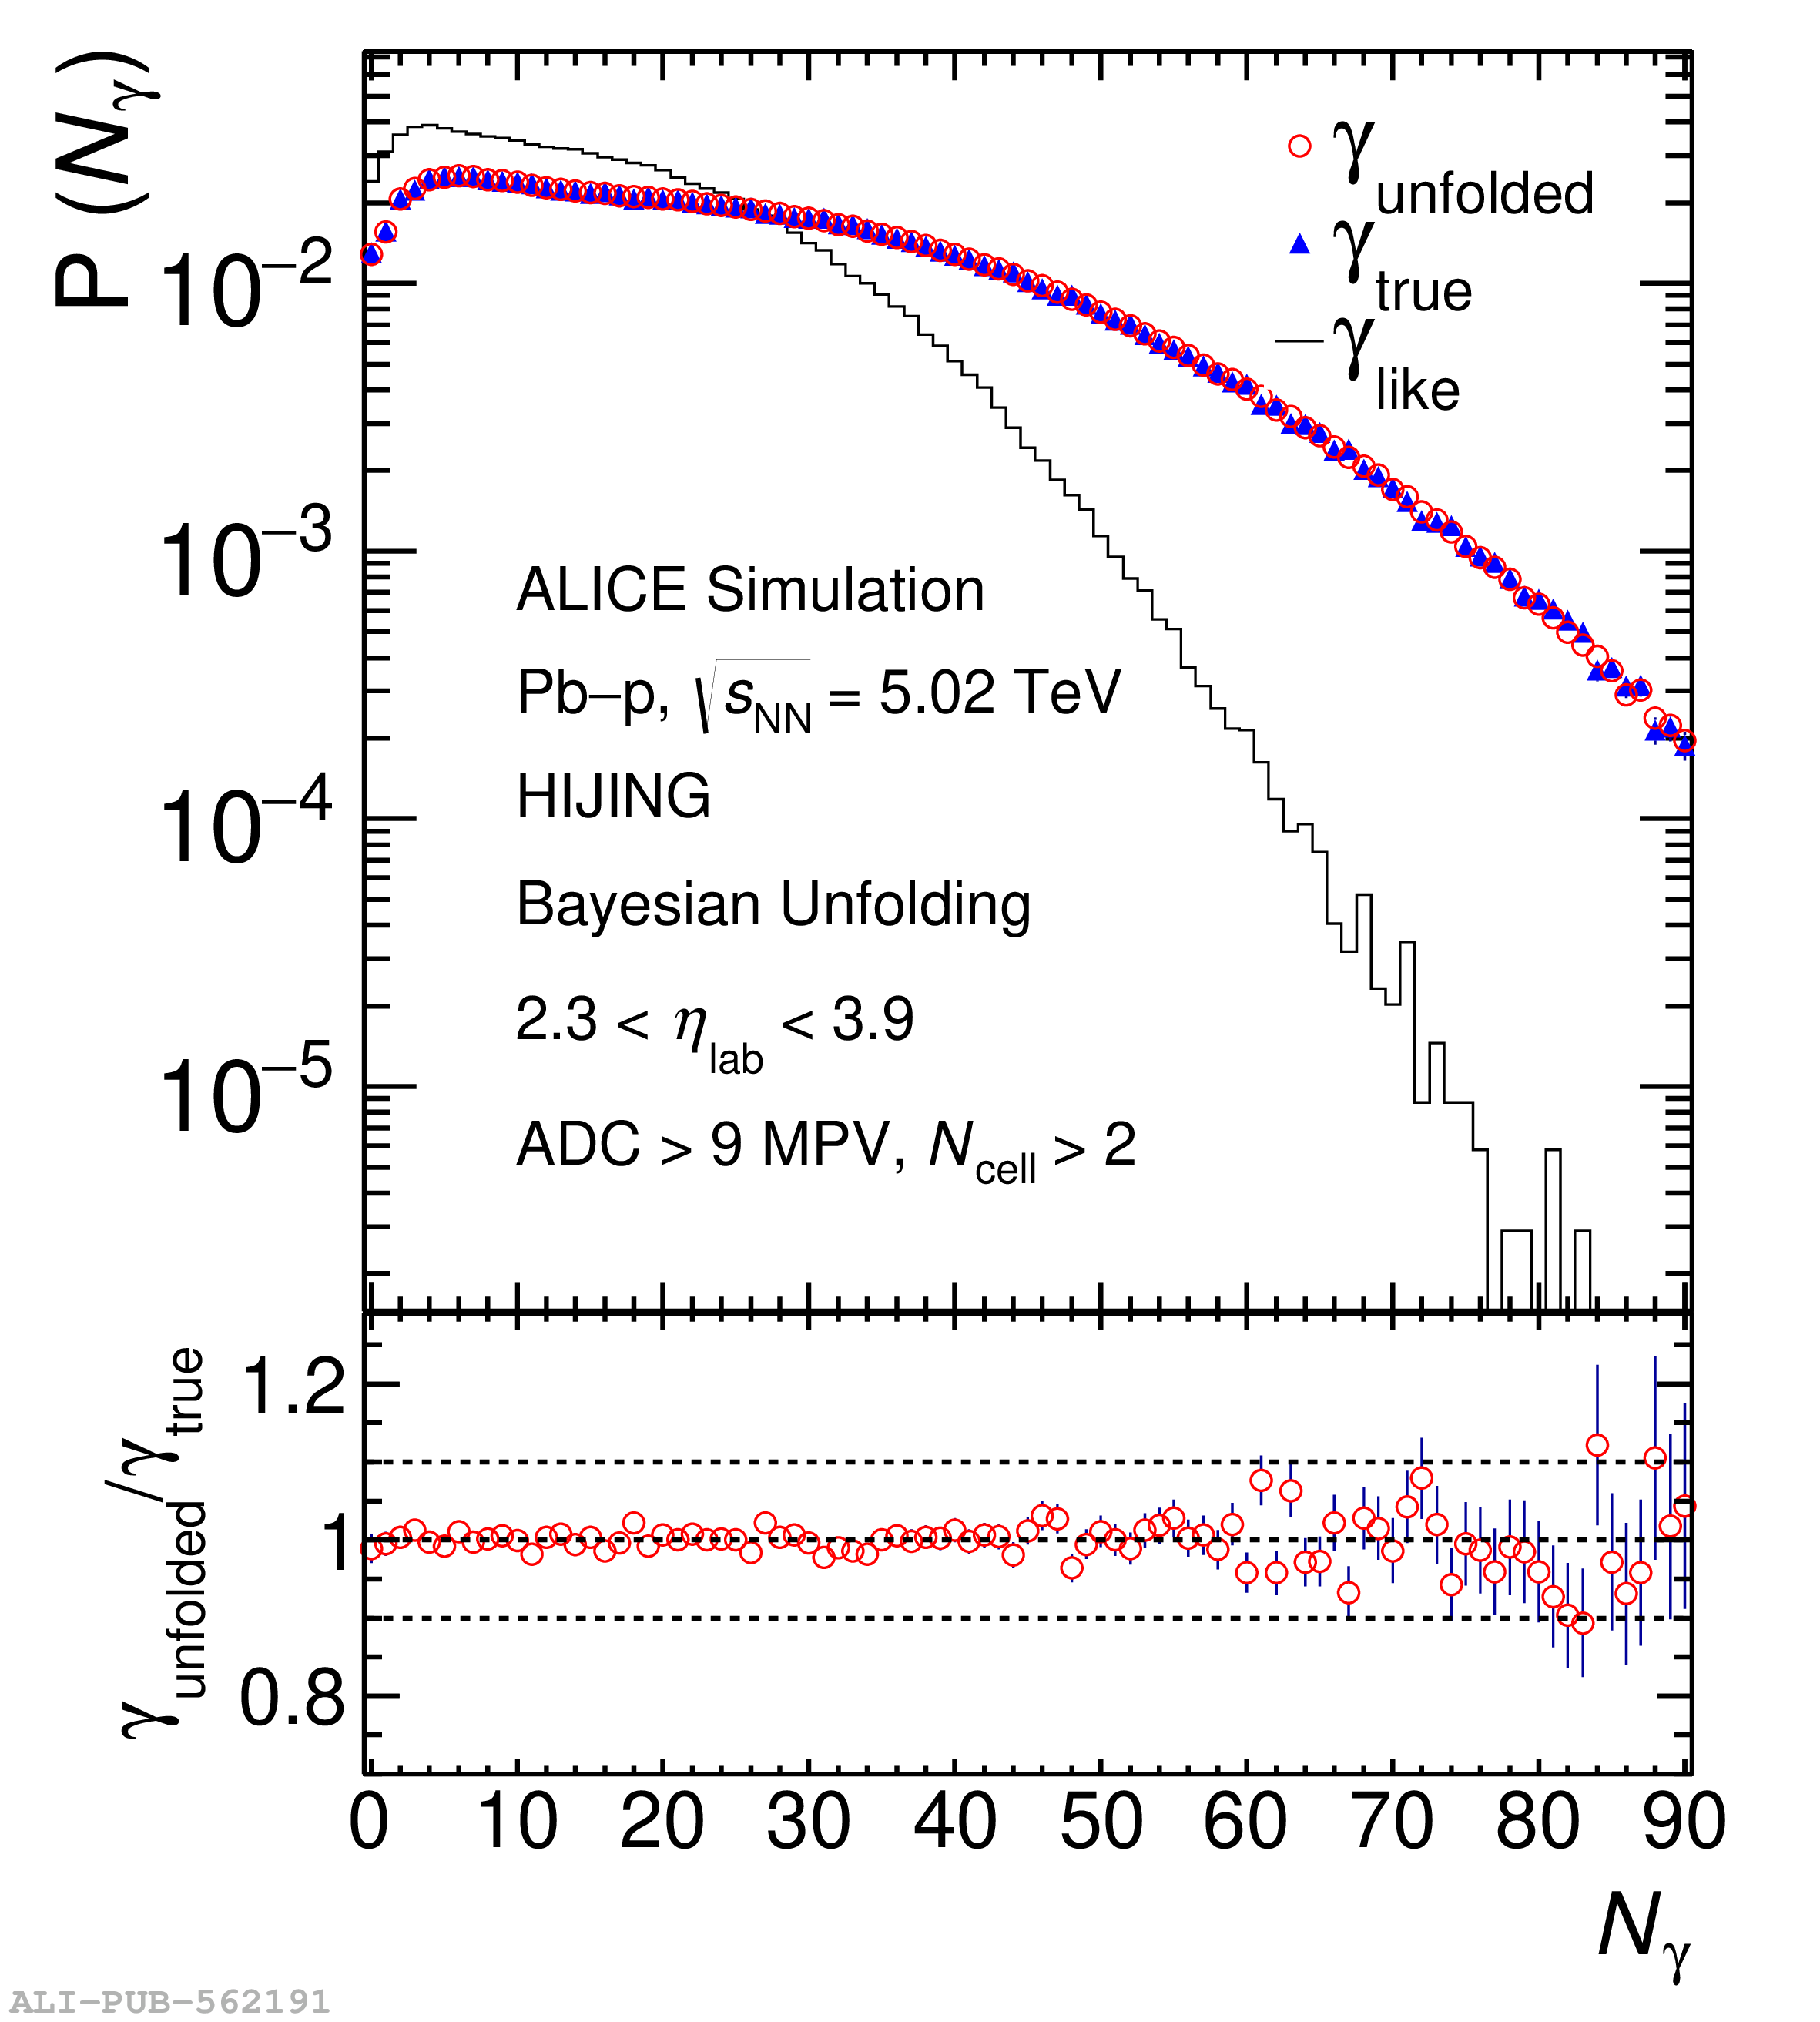 |
Figure 3
Top panels: Inclusive photon multiplicity distributions measured within 2.3 $<$ $\etalab$ $<$ 3.9 in \pp (a), \pPb (b), and \Pbp (c) collisions at \fivenn. Results from various MC predictions are superimposed Bottom panels: The ratios between MC results and data are shown. Shaded boxes represent the systematic uncertainties. | 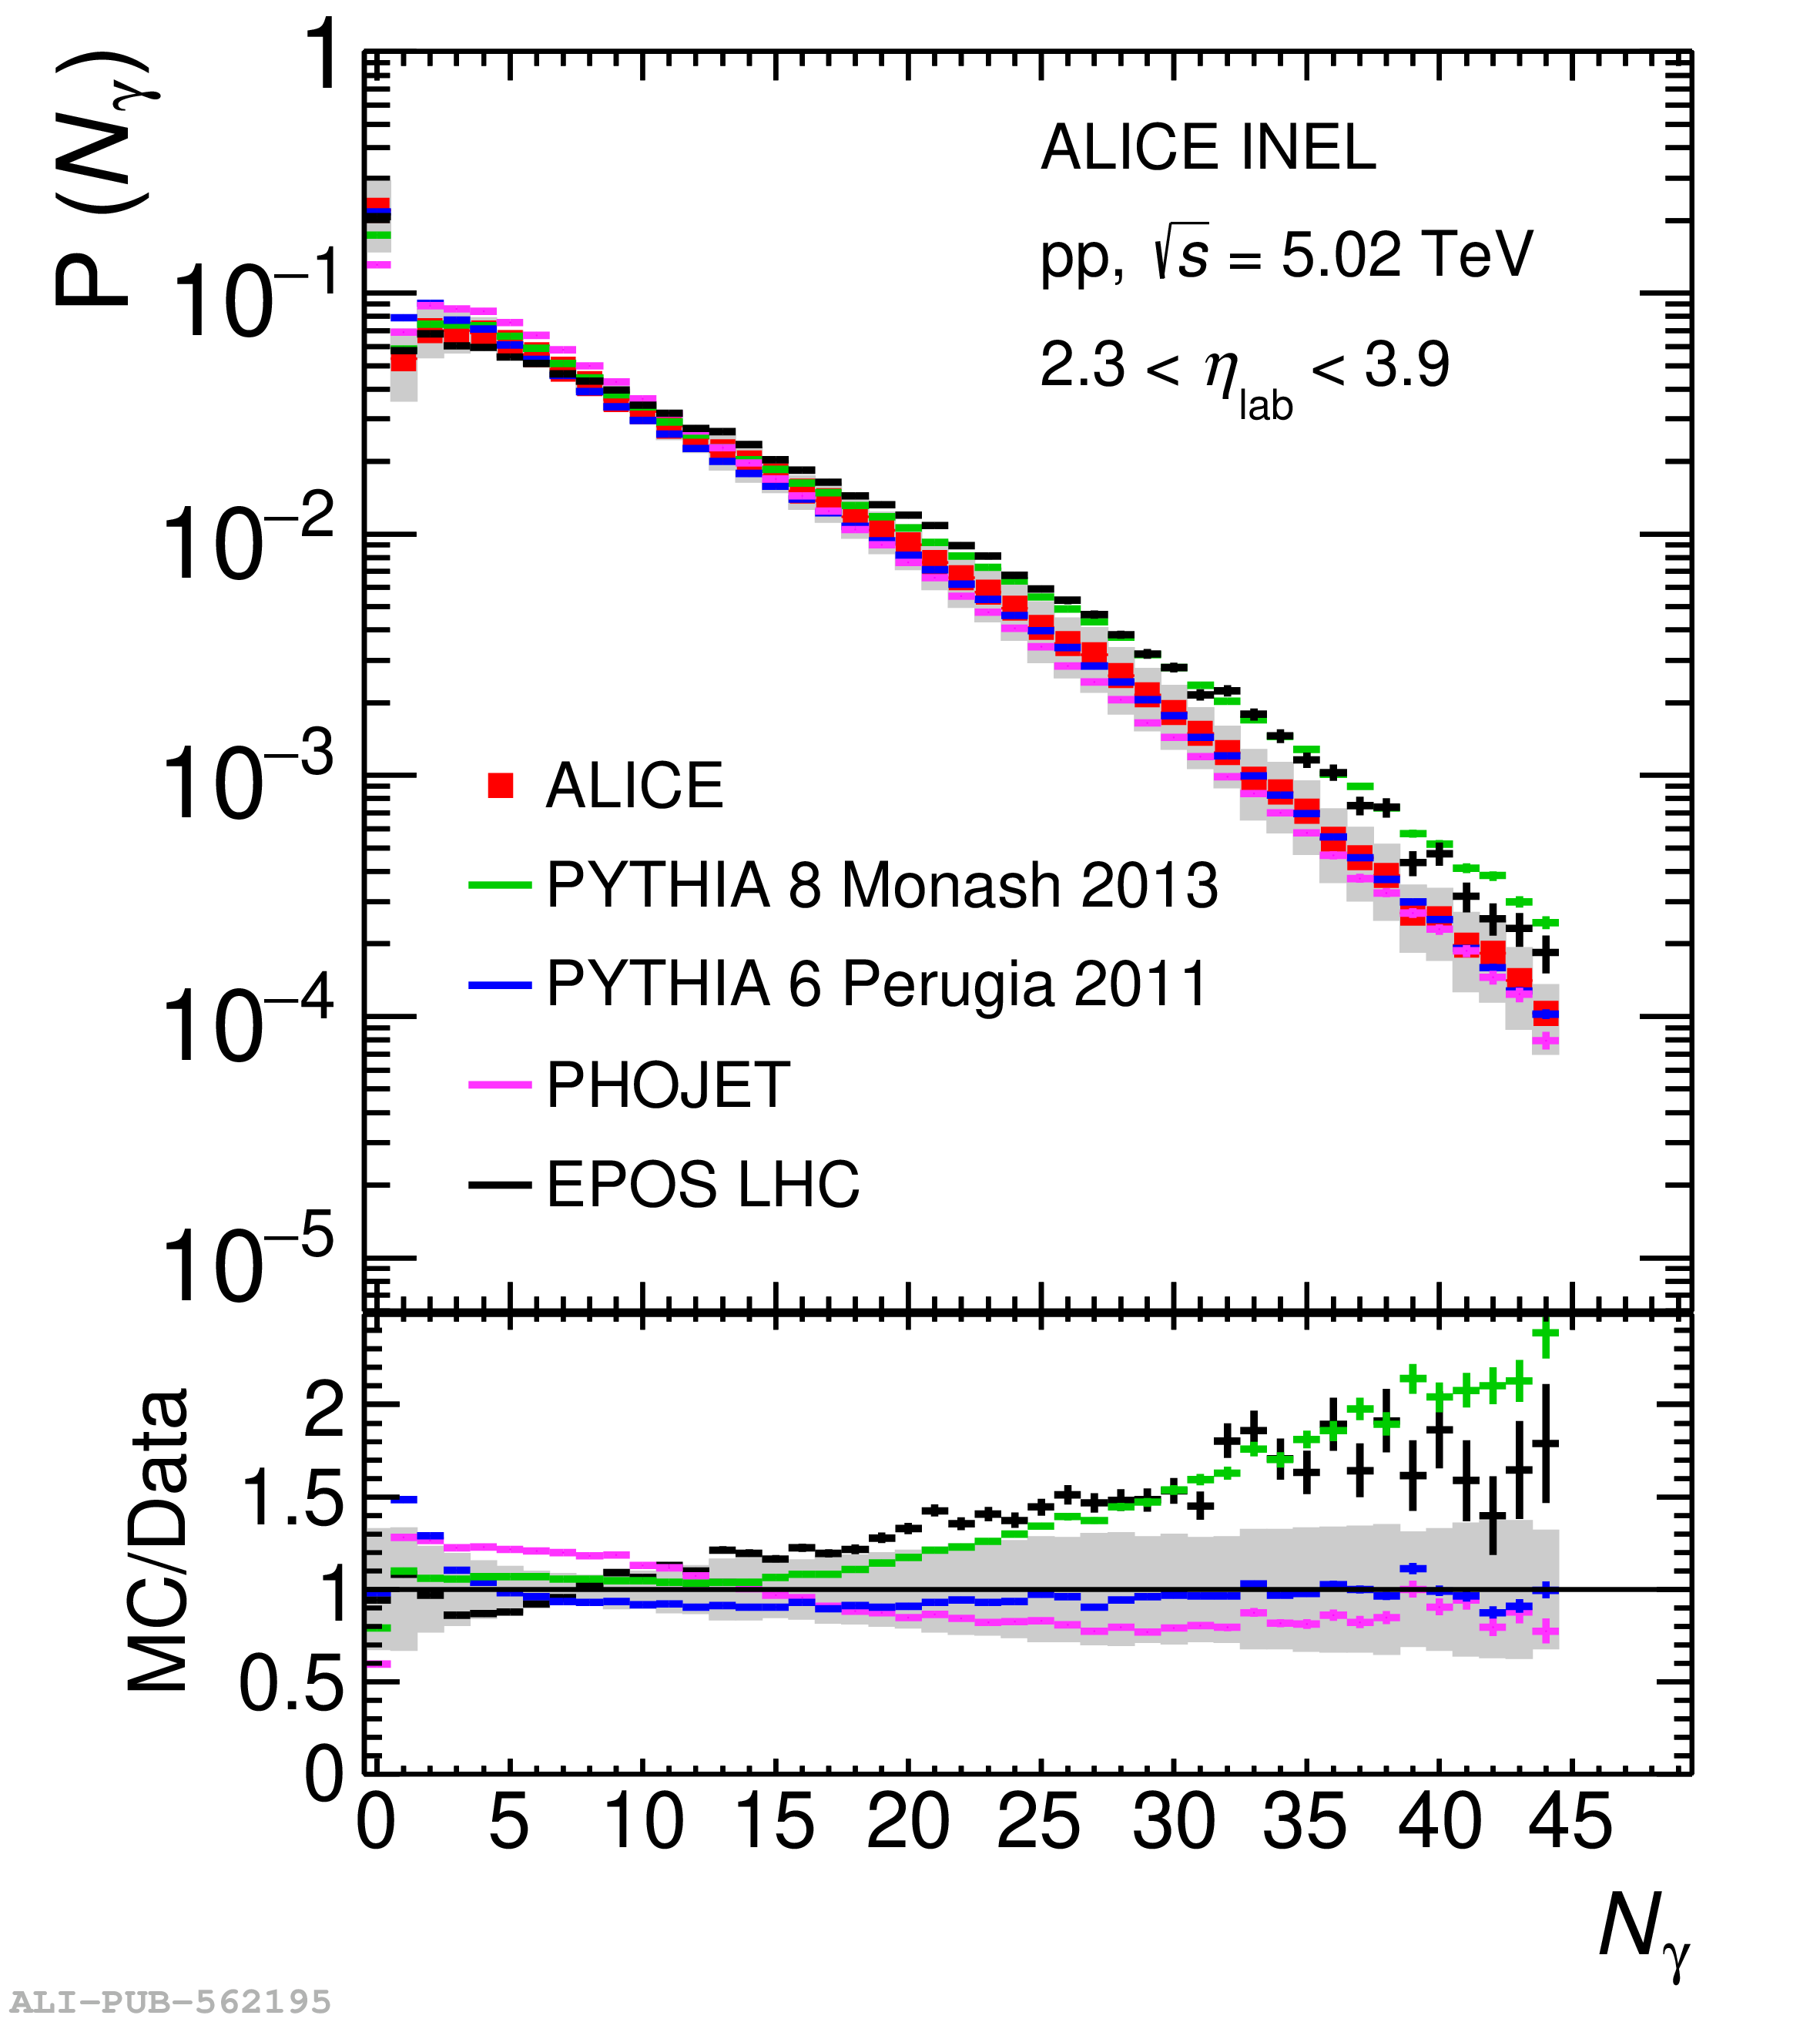 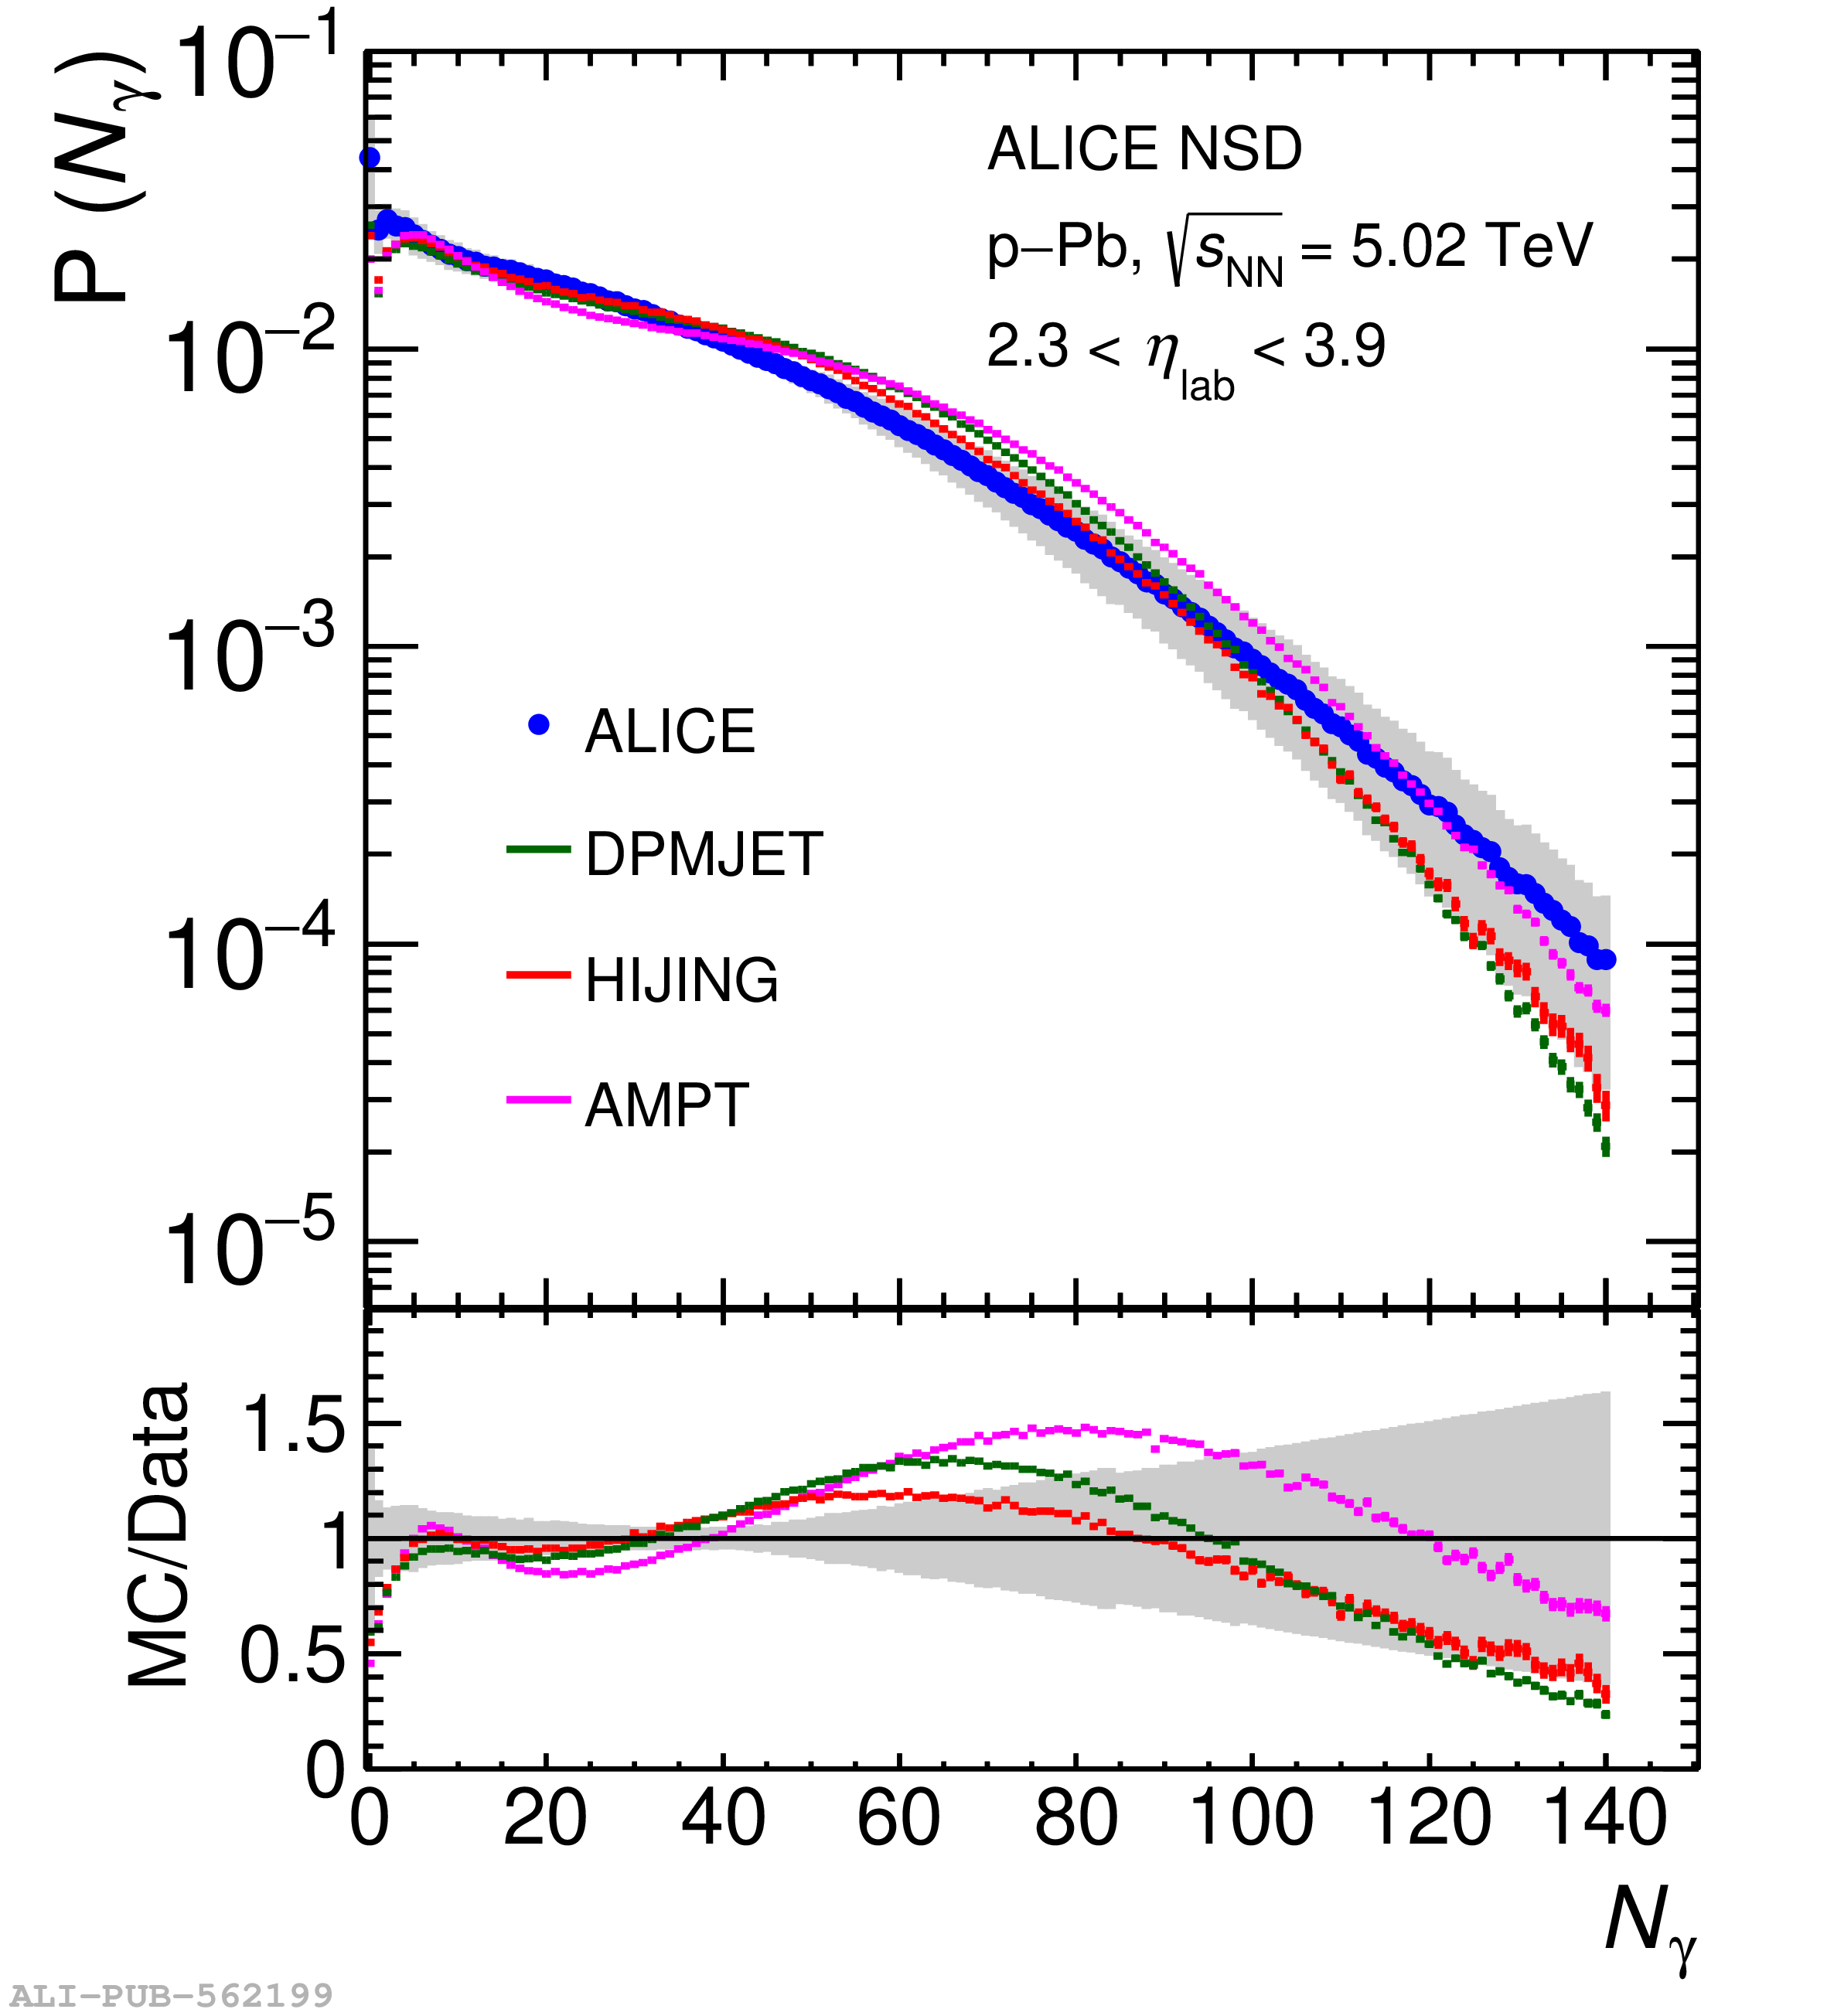 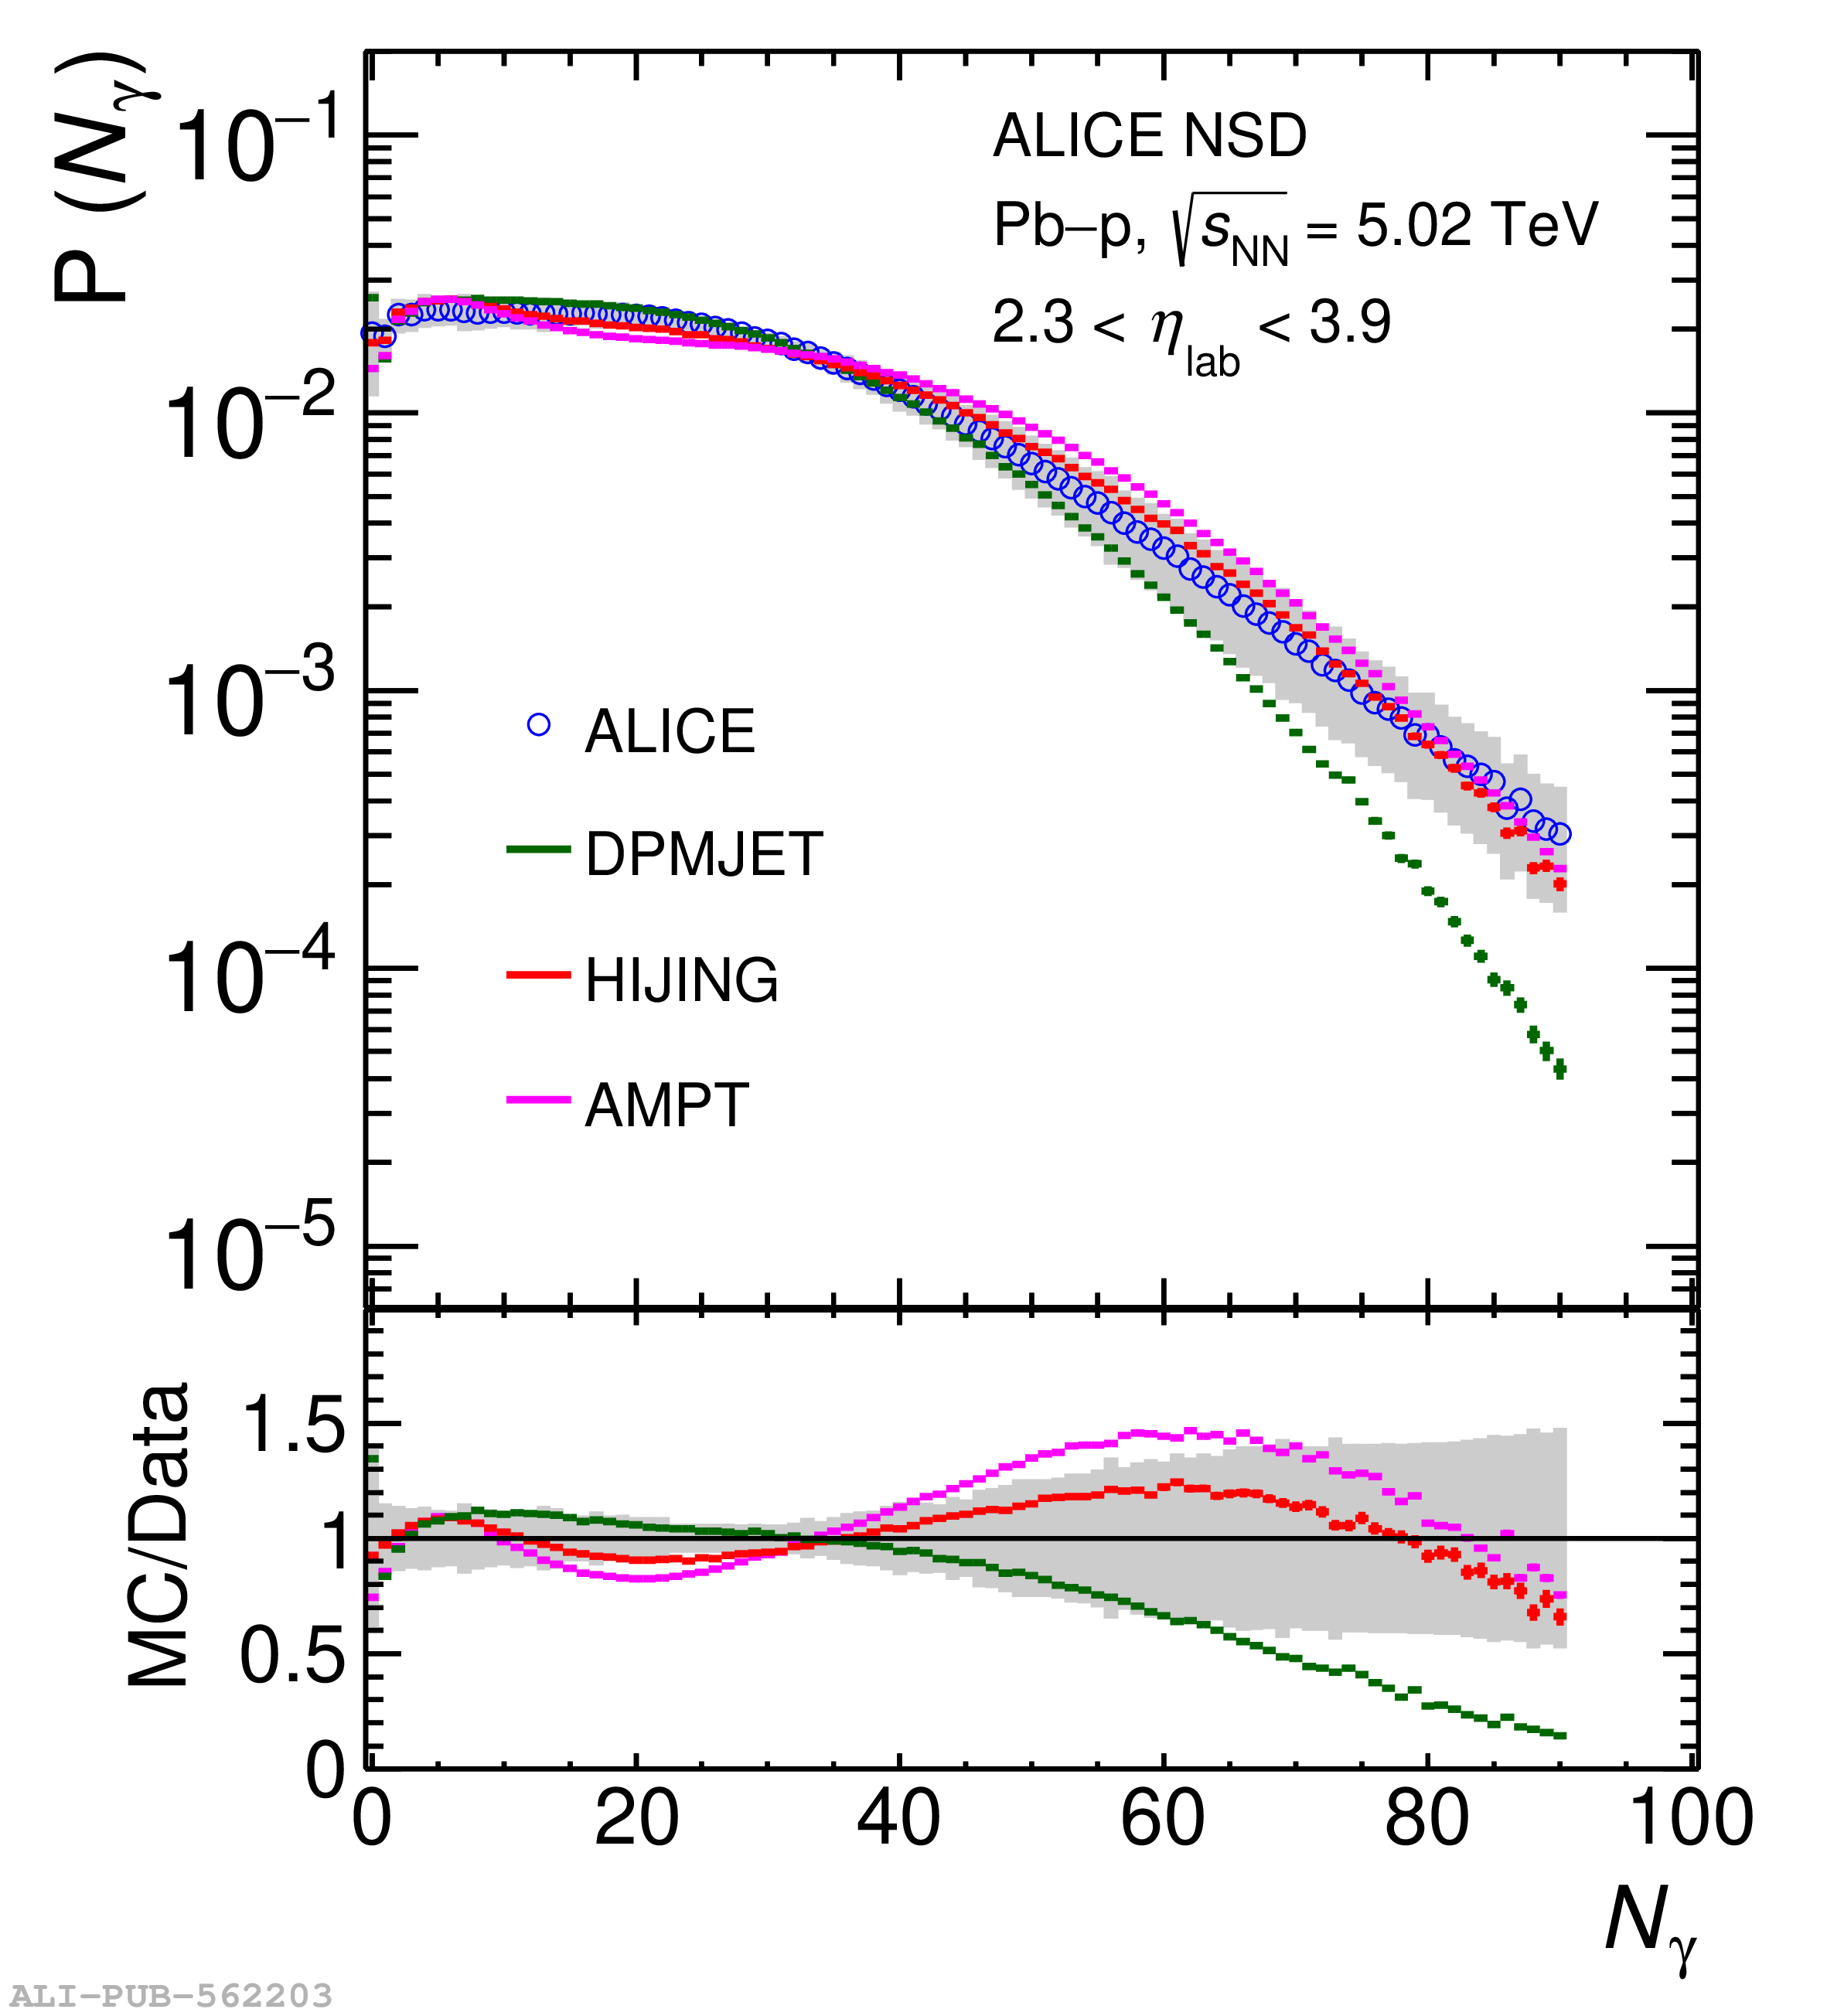 |
Figure 4
Top panels: Multiplicity distribution of inclusive photons fitted to double NBDs for \pp (a), \pPb (b), and \Pbp (c) collisions at \fivenn. Bottom panels: The ratio of the data to the fit is presented. Shaded boxes represent the systematic uncertainties. | 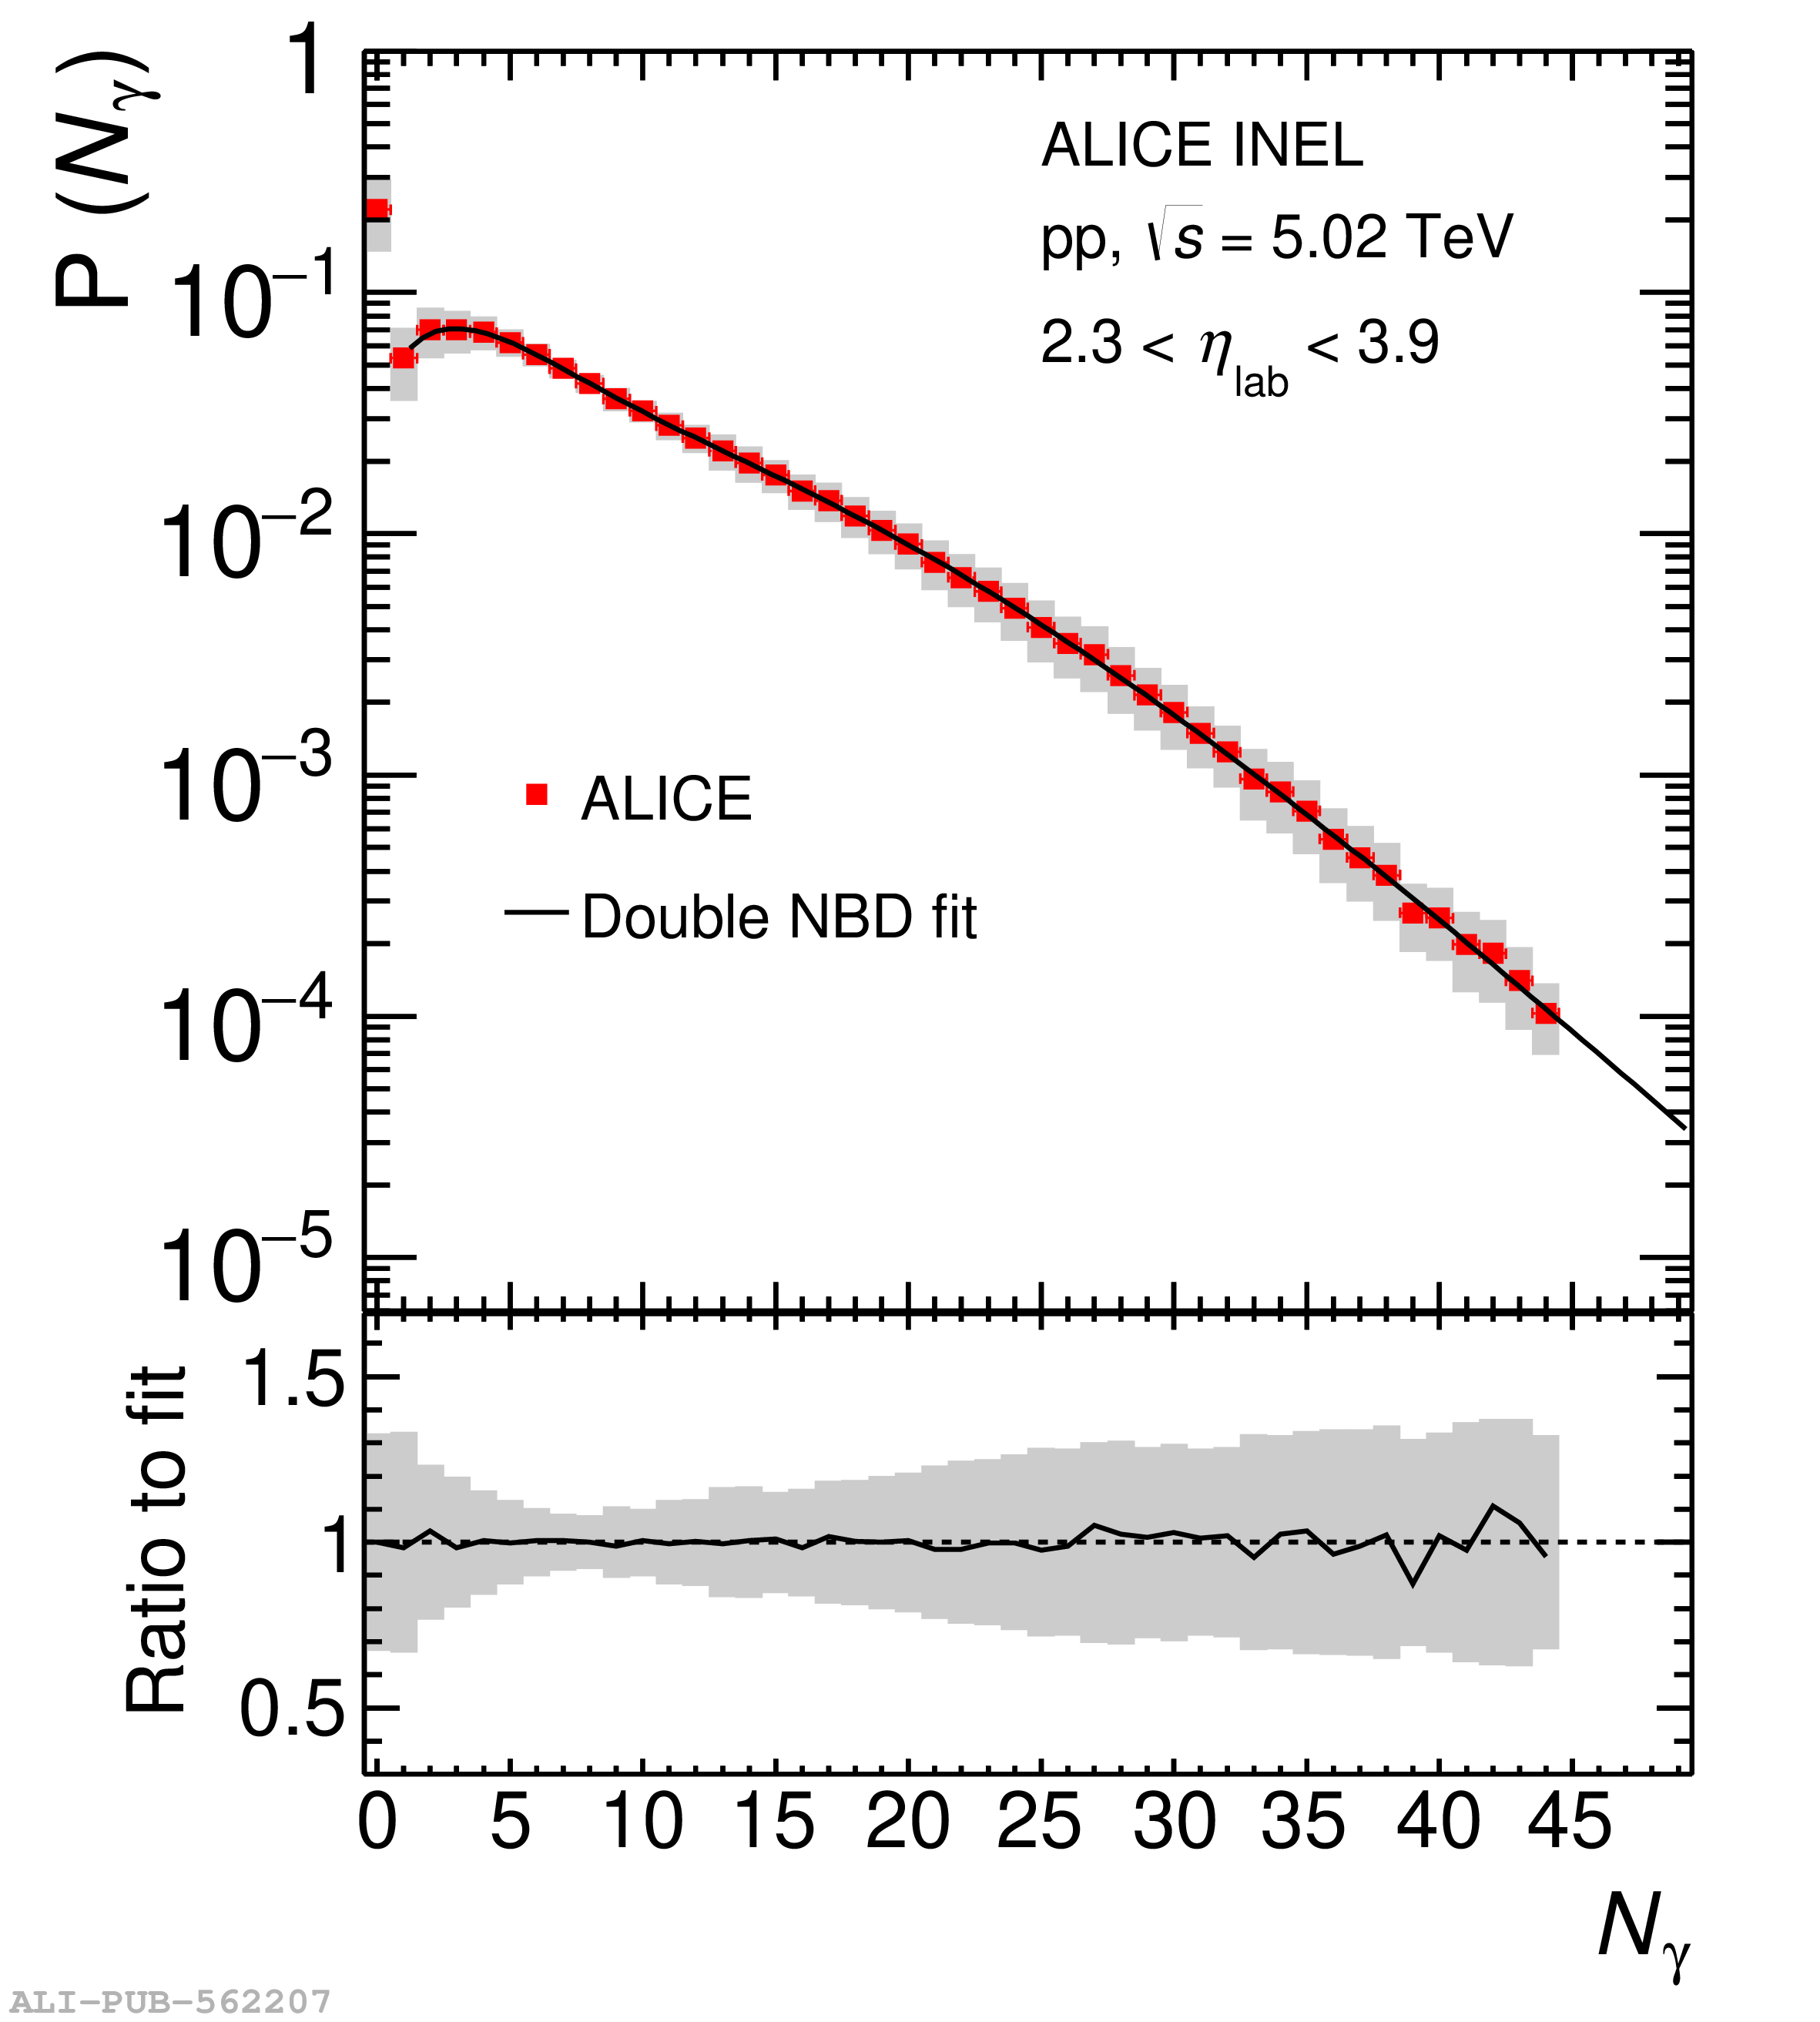 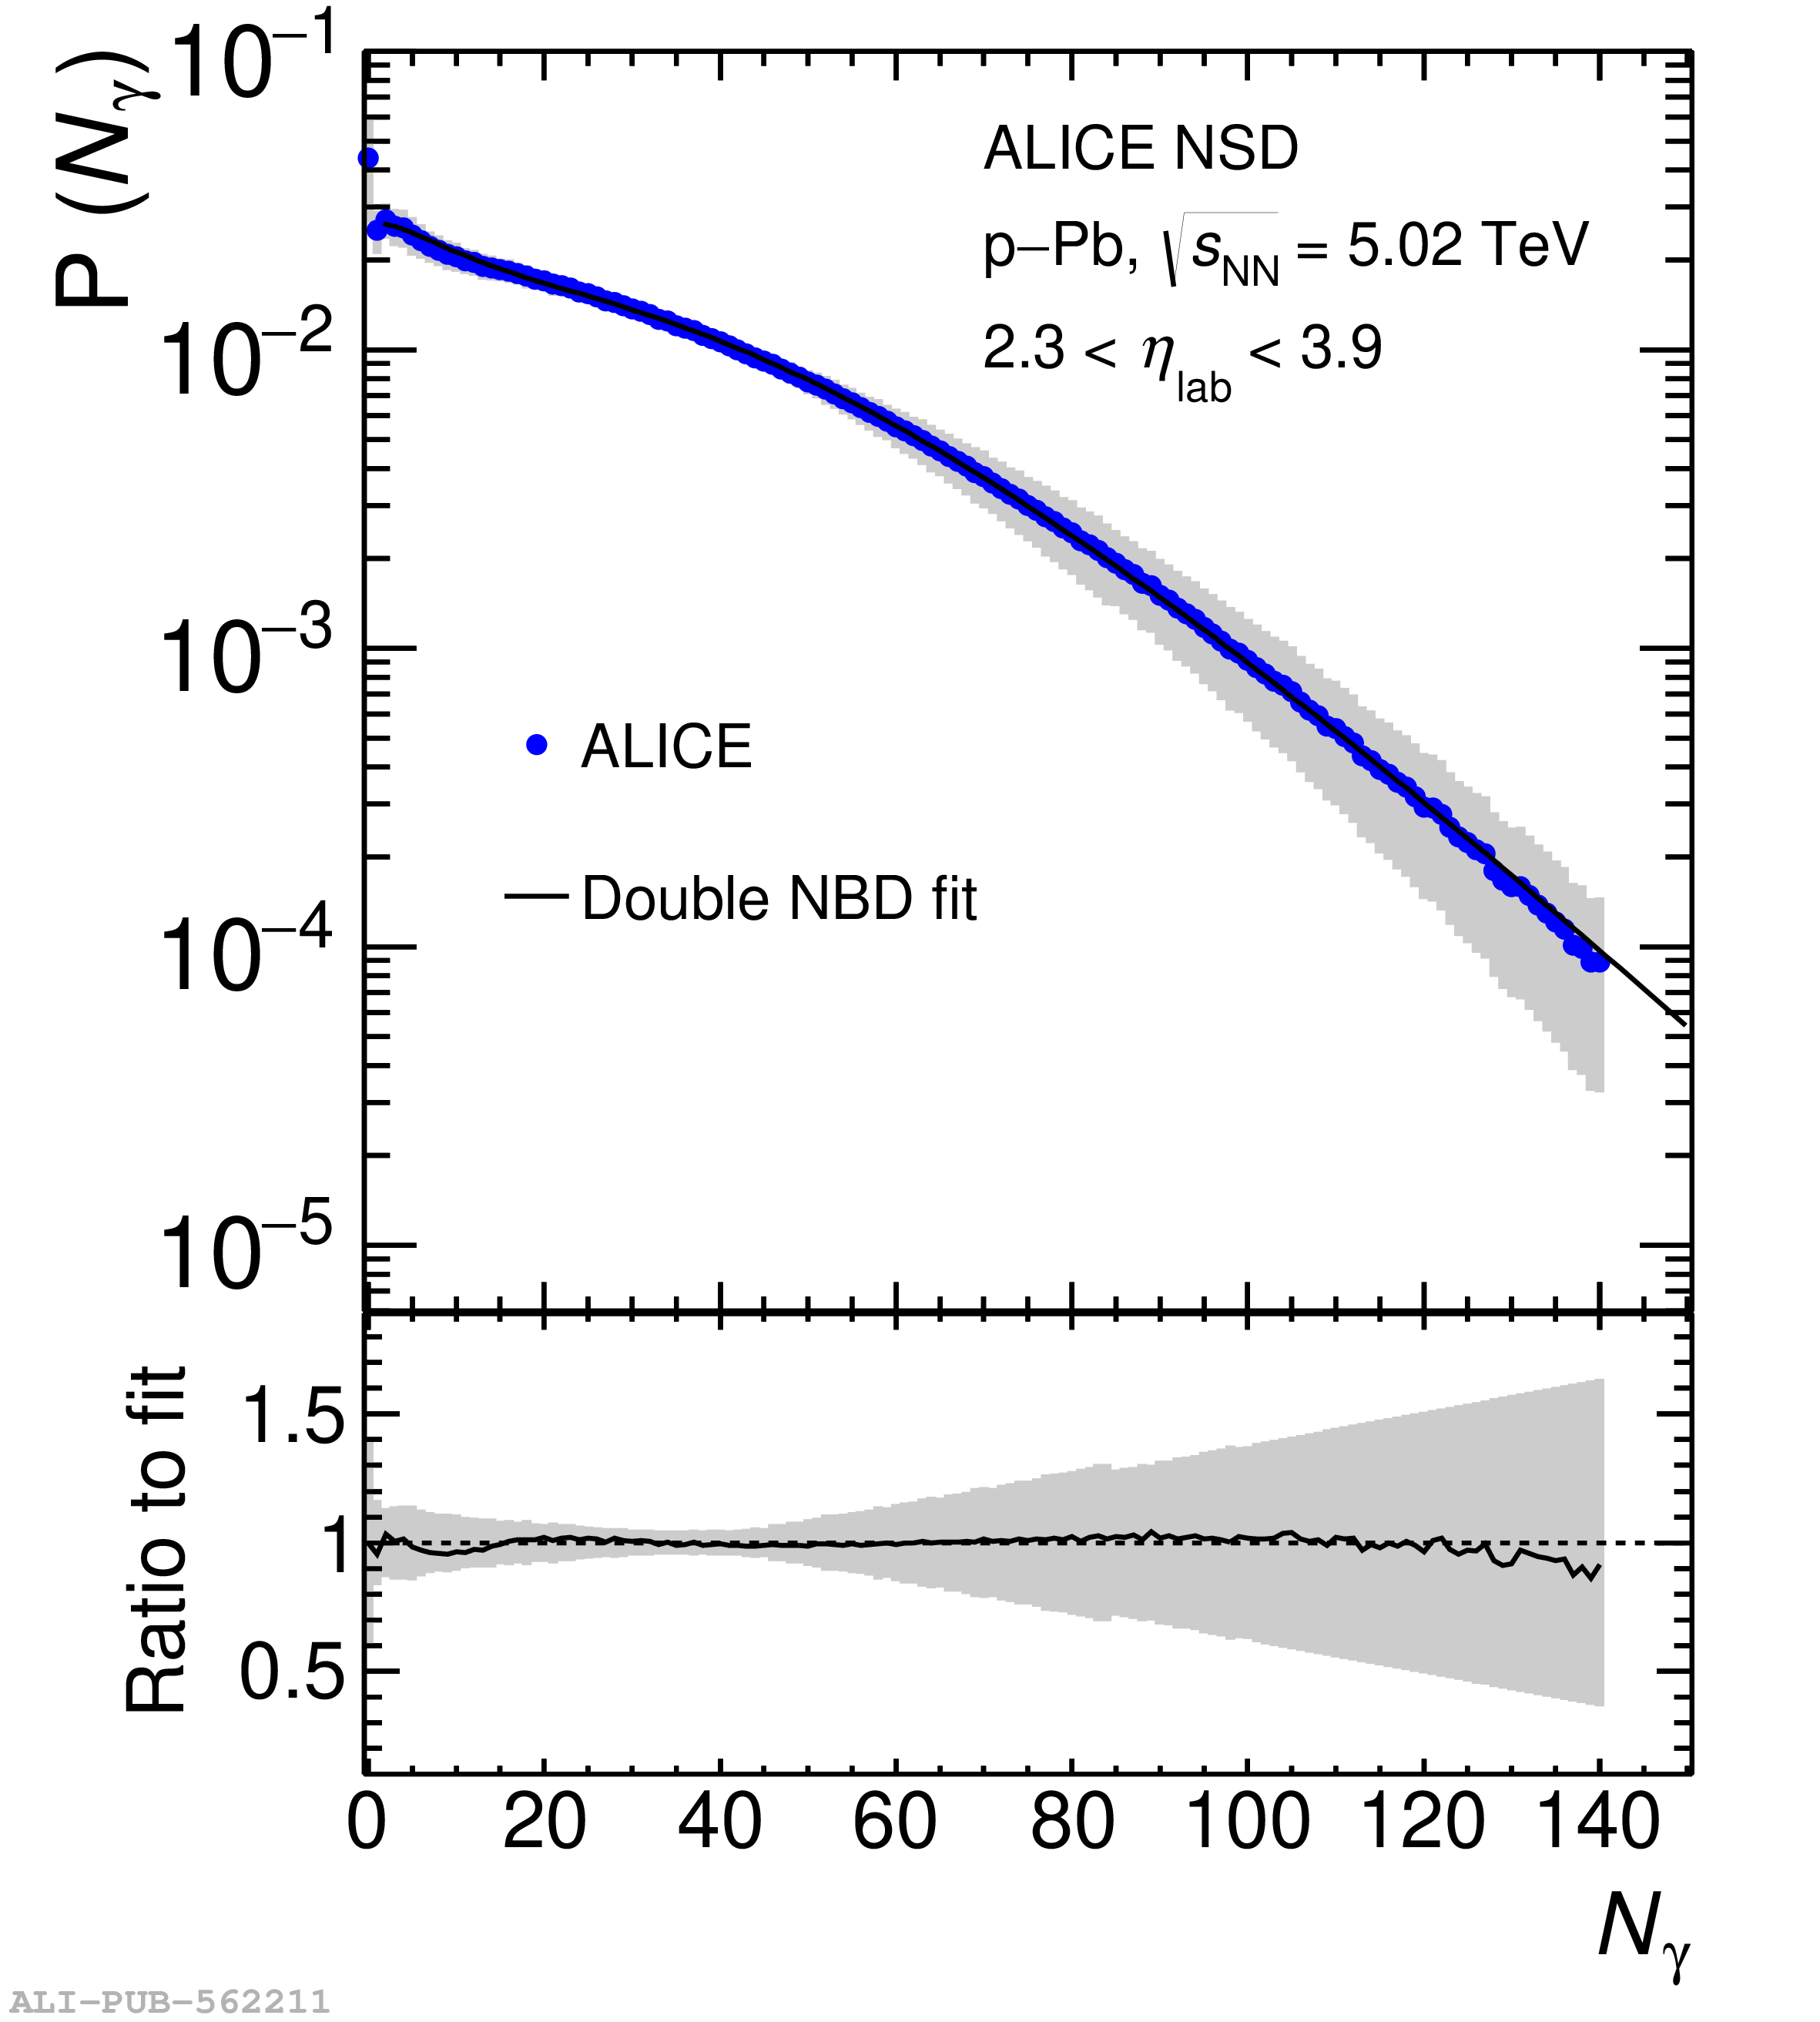 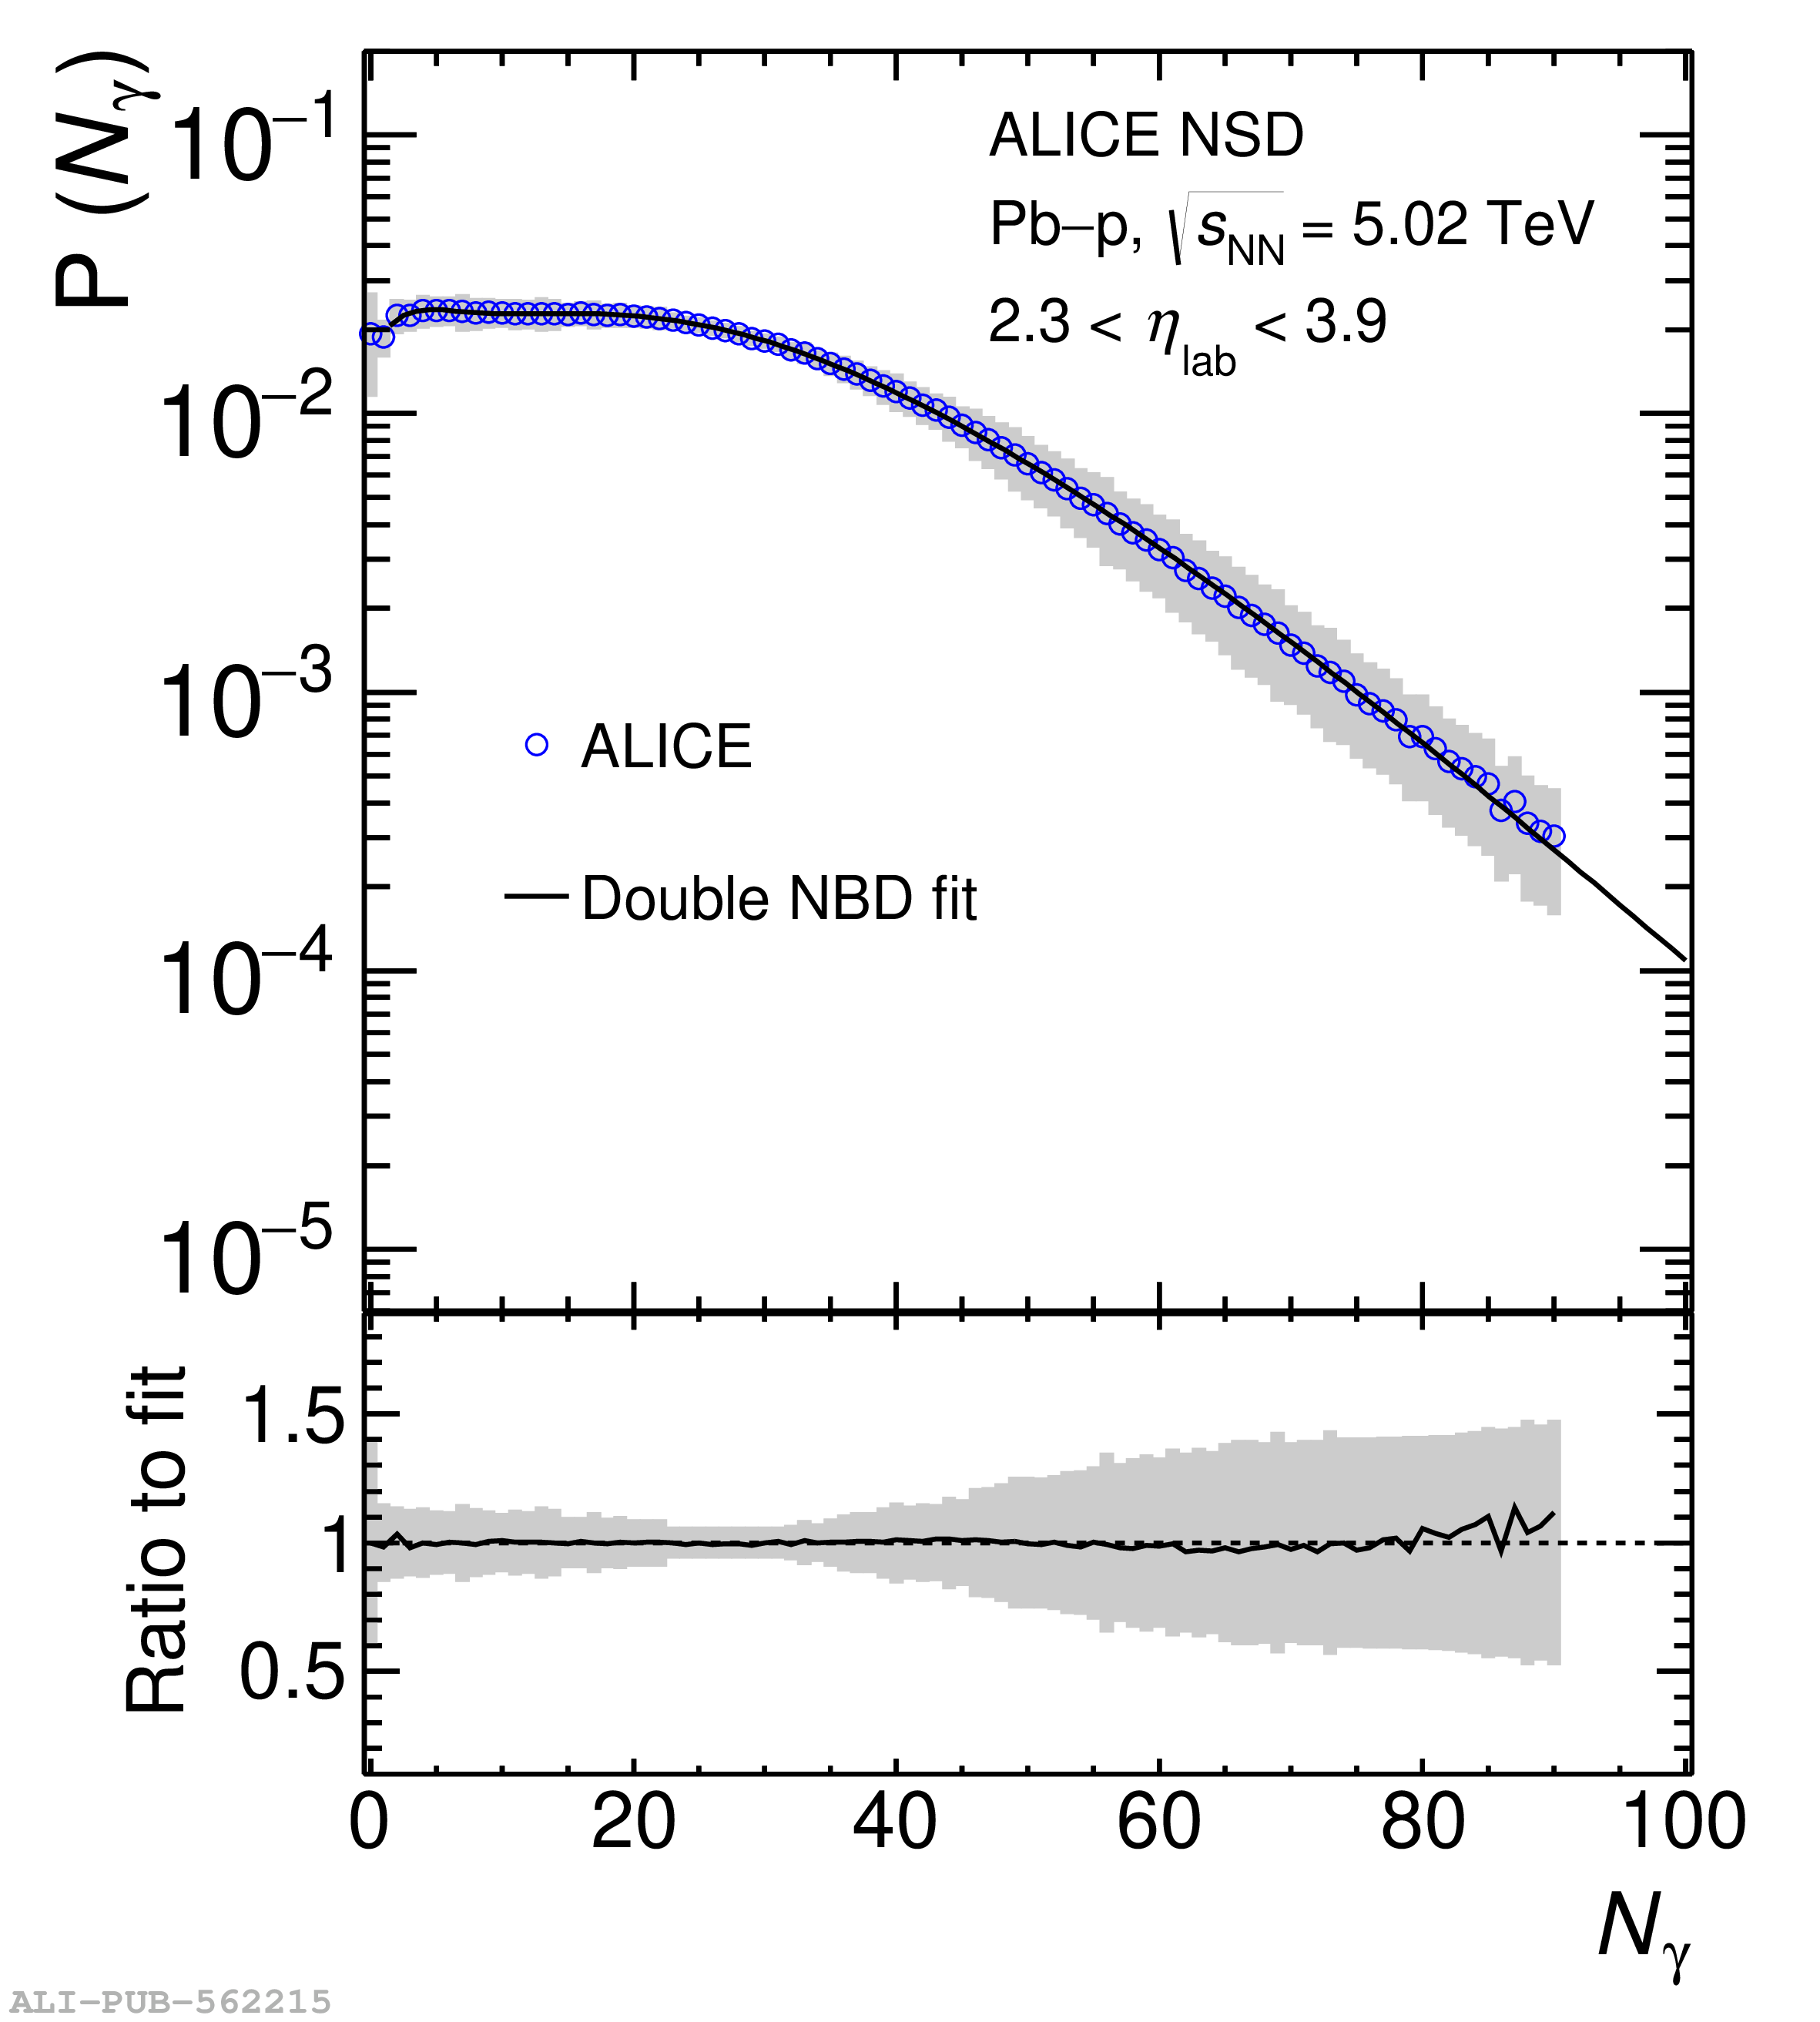 |
Figure 5
Top panels: Pseudorapidity distribution of inclusive photons measured within 2.3 $<$ $\etalab$ $<$ 3.9 in \pp (a), \pPb (b), and \Pbp (c) collisions at \fivenn. Results from various MC predictions are superimposed. Bottom panels: The ratios between MC results and data are shown. Shaded boxes represent the systematic uncertainties. |  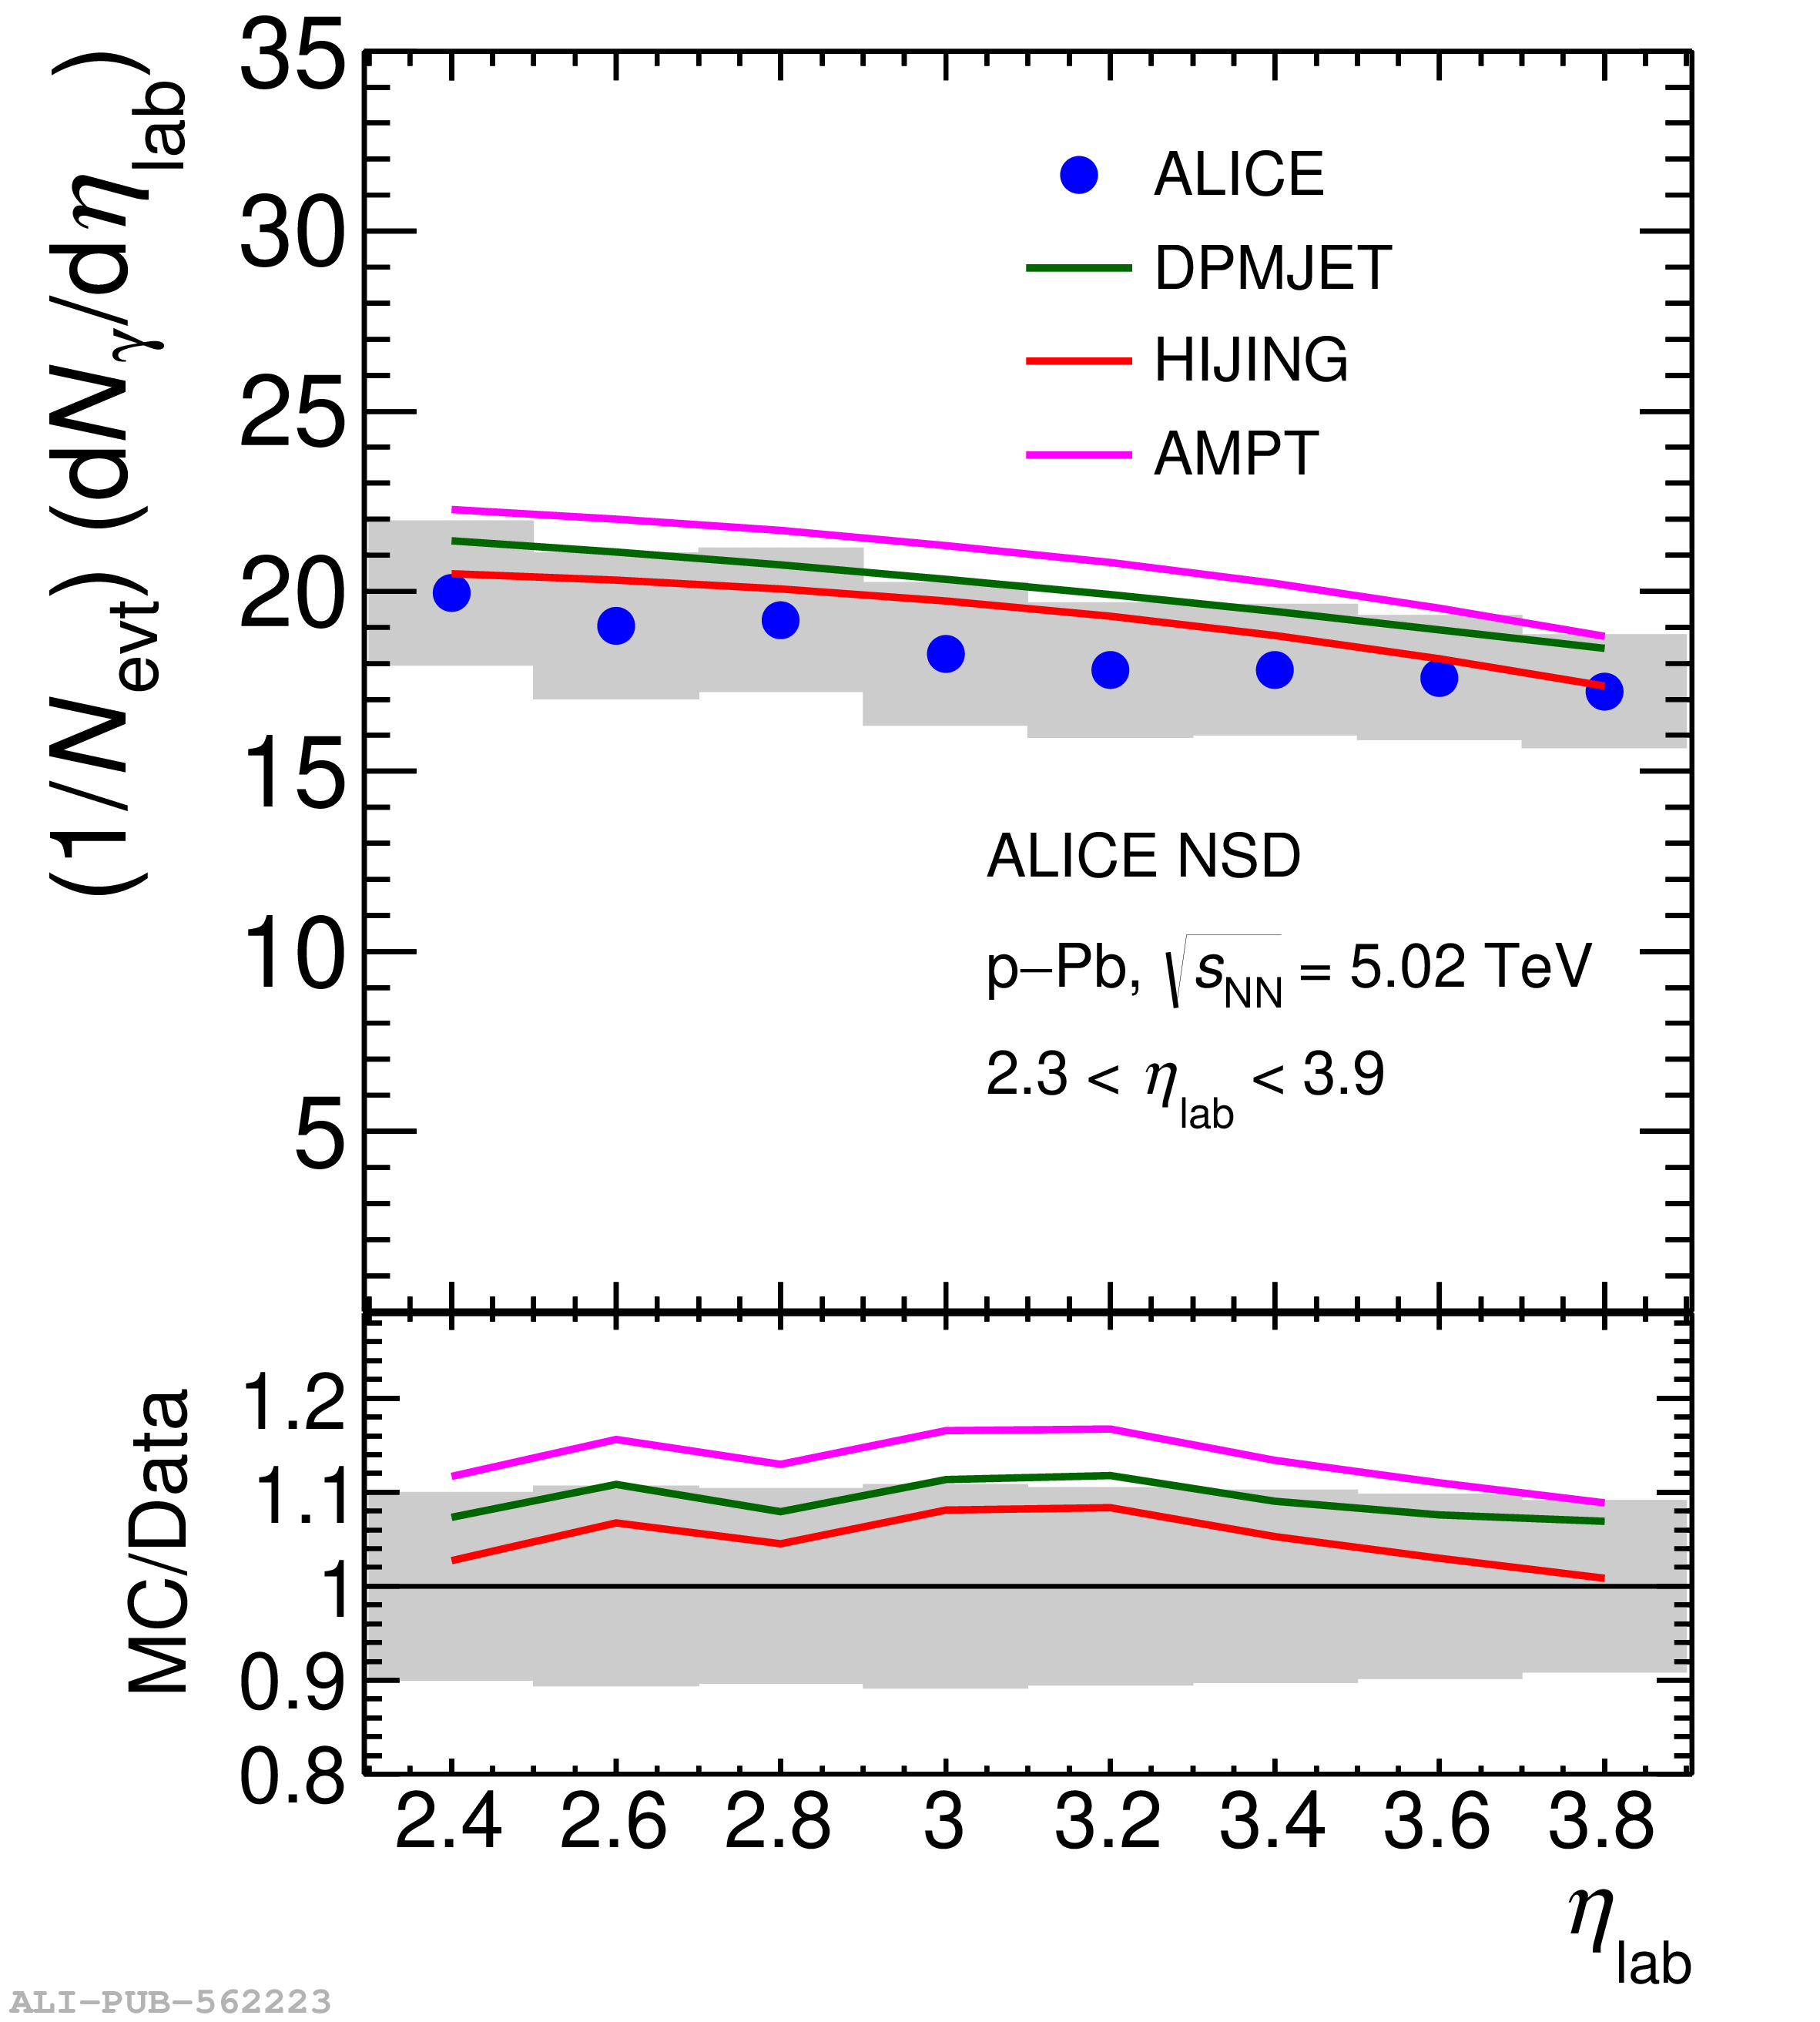 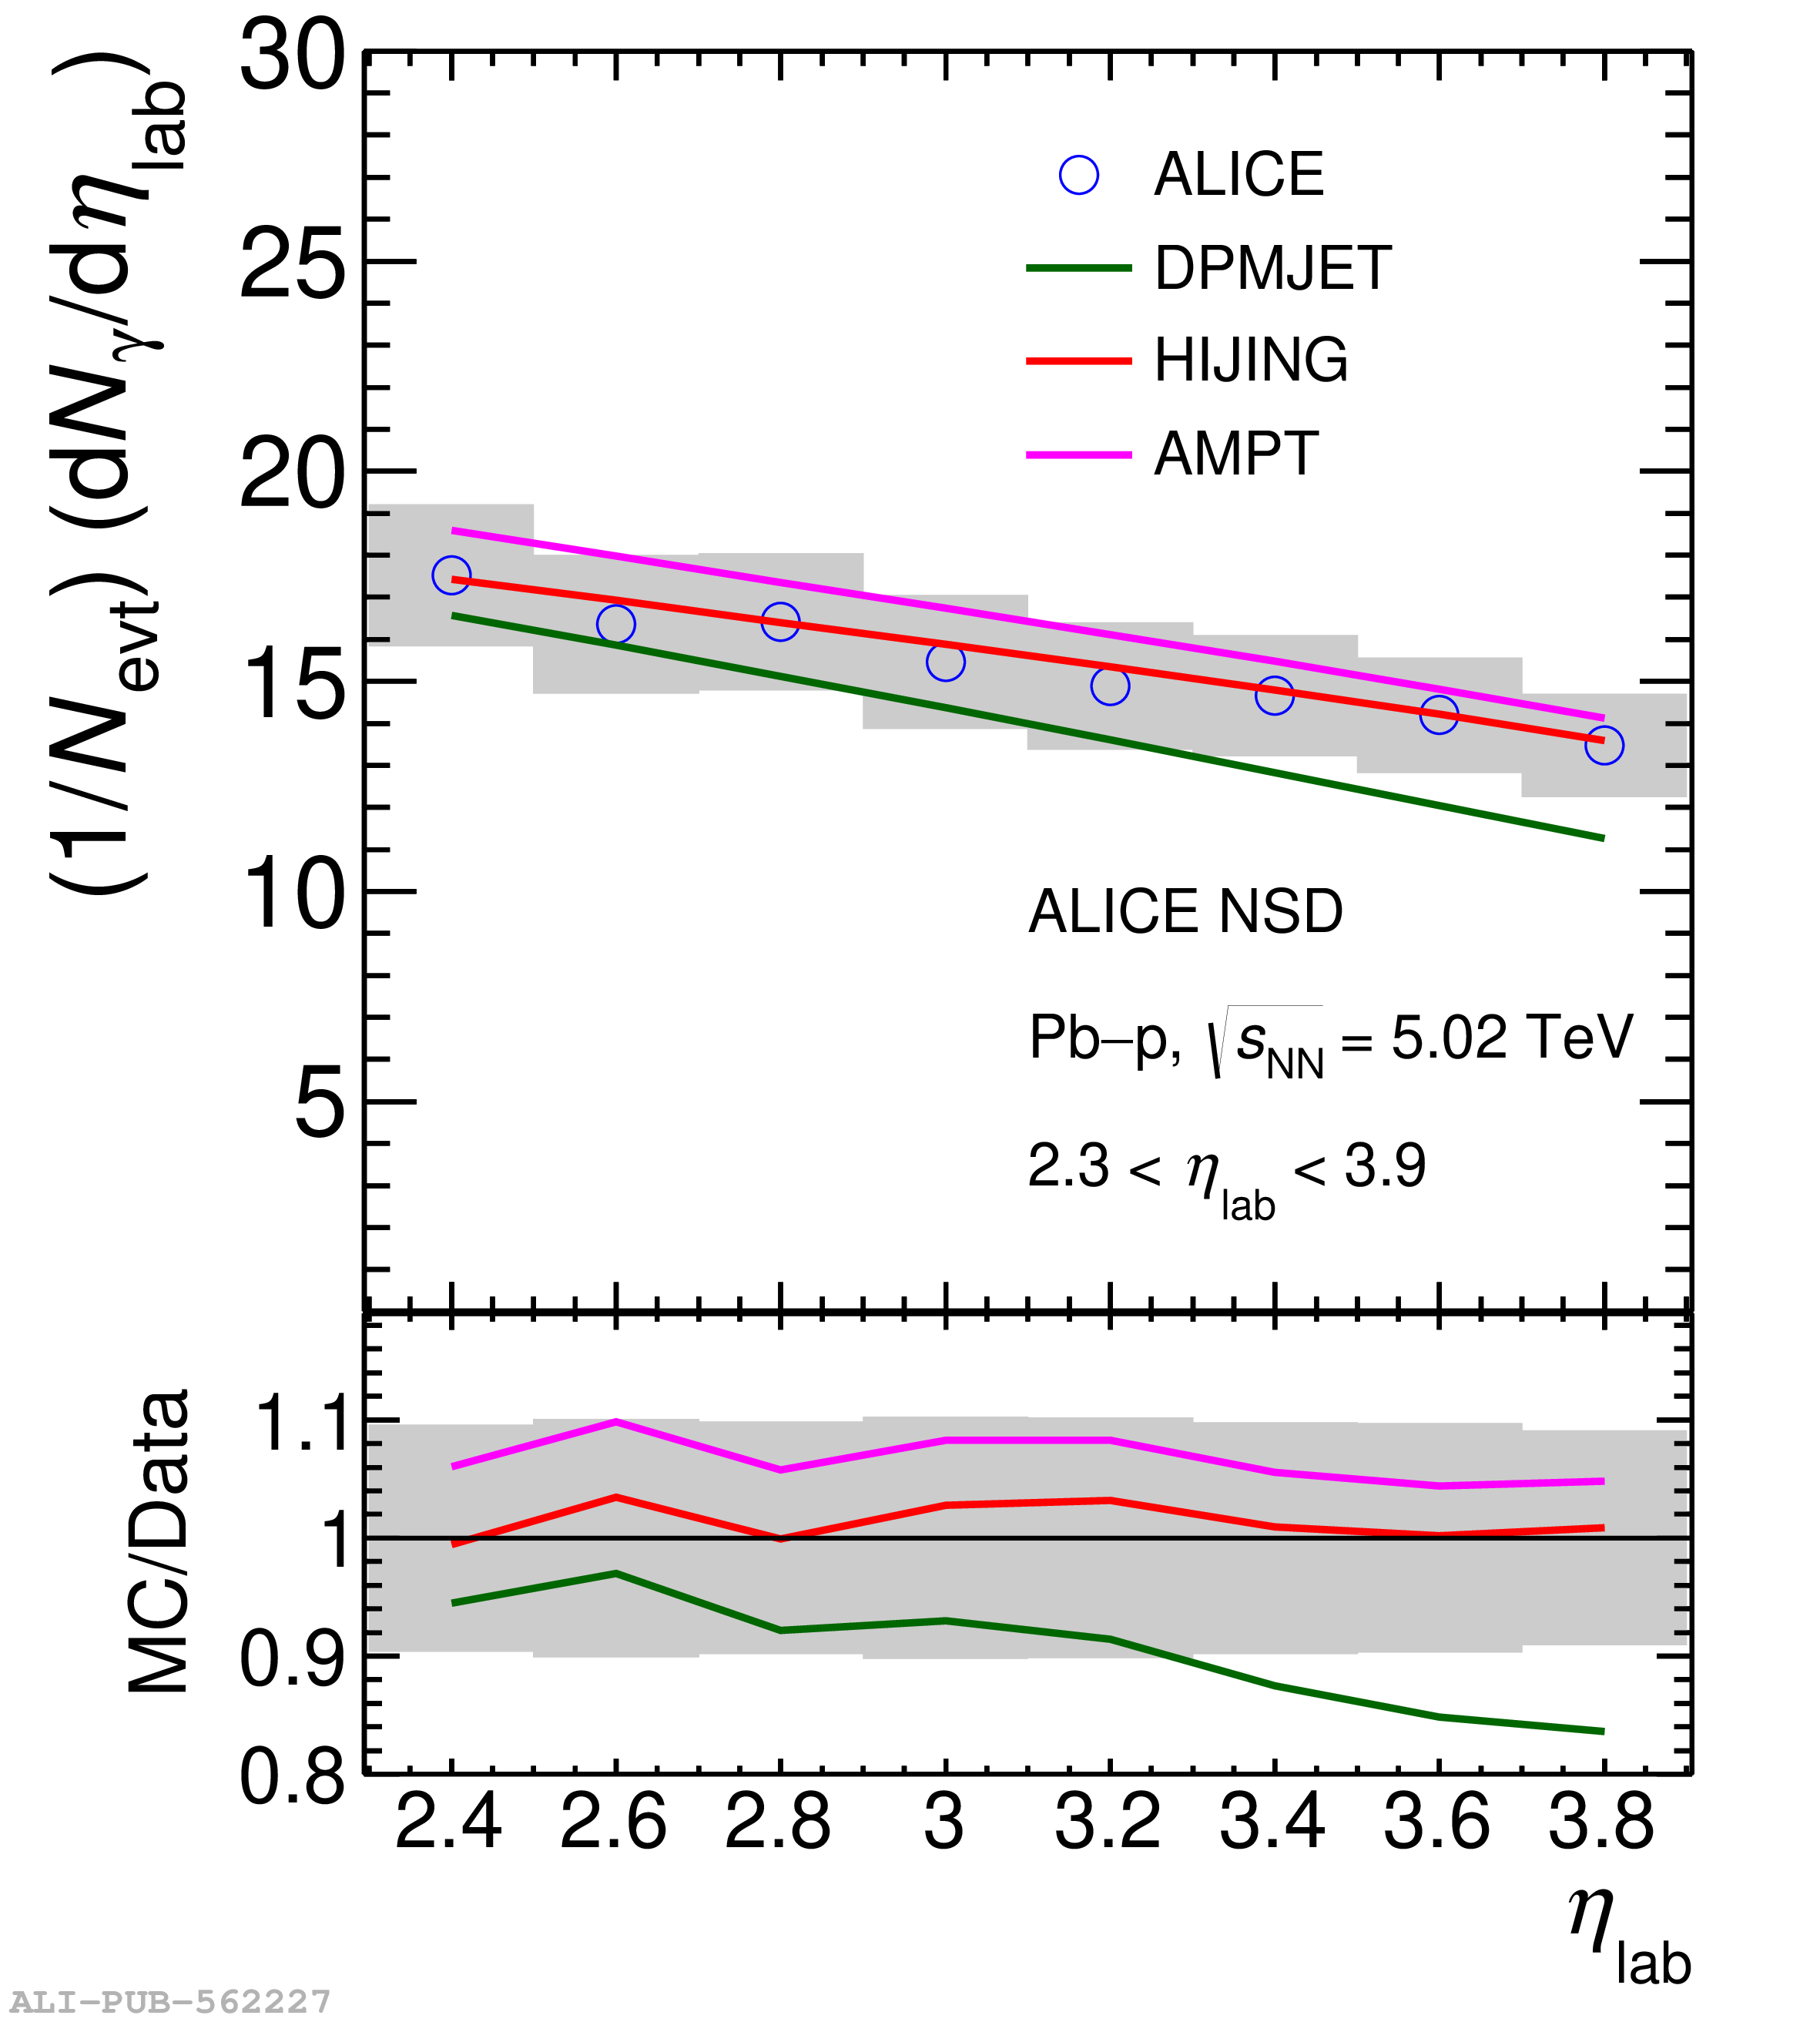 |
Figure 6
(a) Comparison of \dndetaphotonlab measured at forward rapidity in INEL pp collisions for various center-of-mass energies, (b) average photon multiplicity within 2.3 $< \etalab <$ 3.9 as a function of collision energy in INEL pp collisions. The results at 0.9, 2.76, and 7 \TeV are taken from Ref. . | 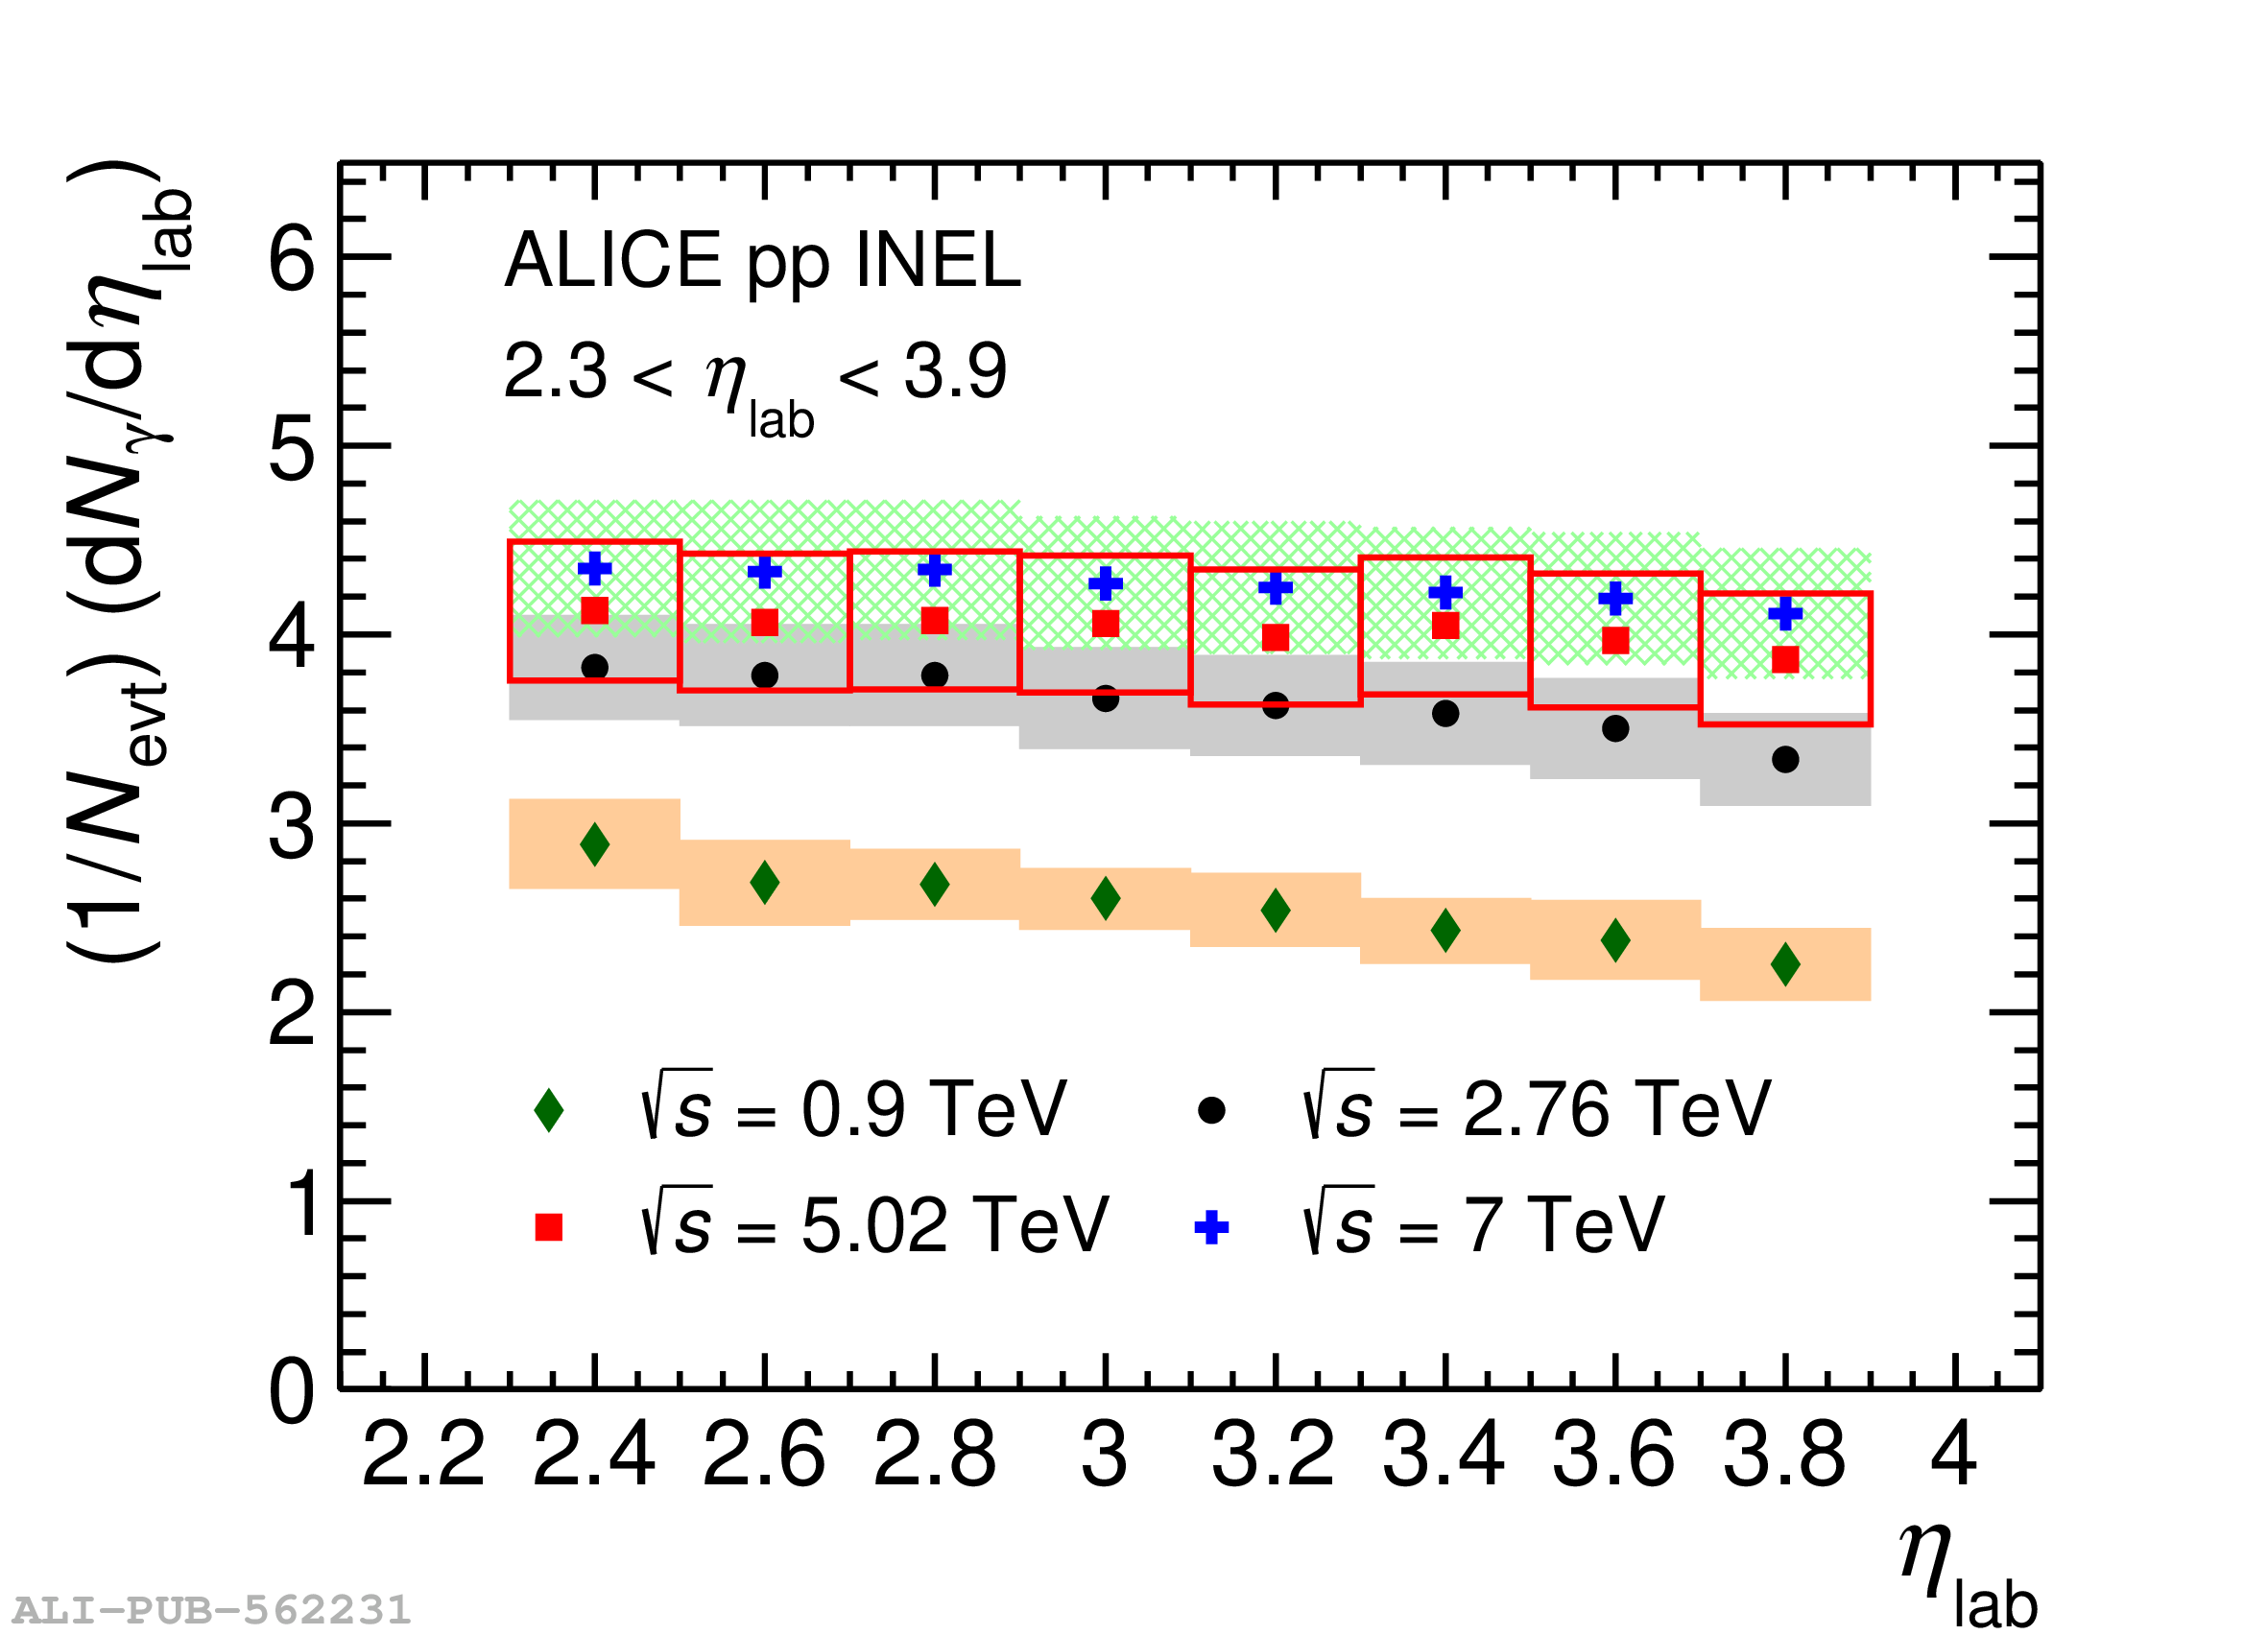 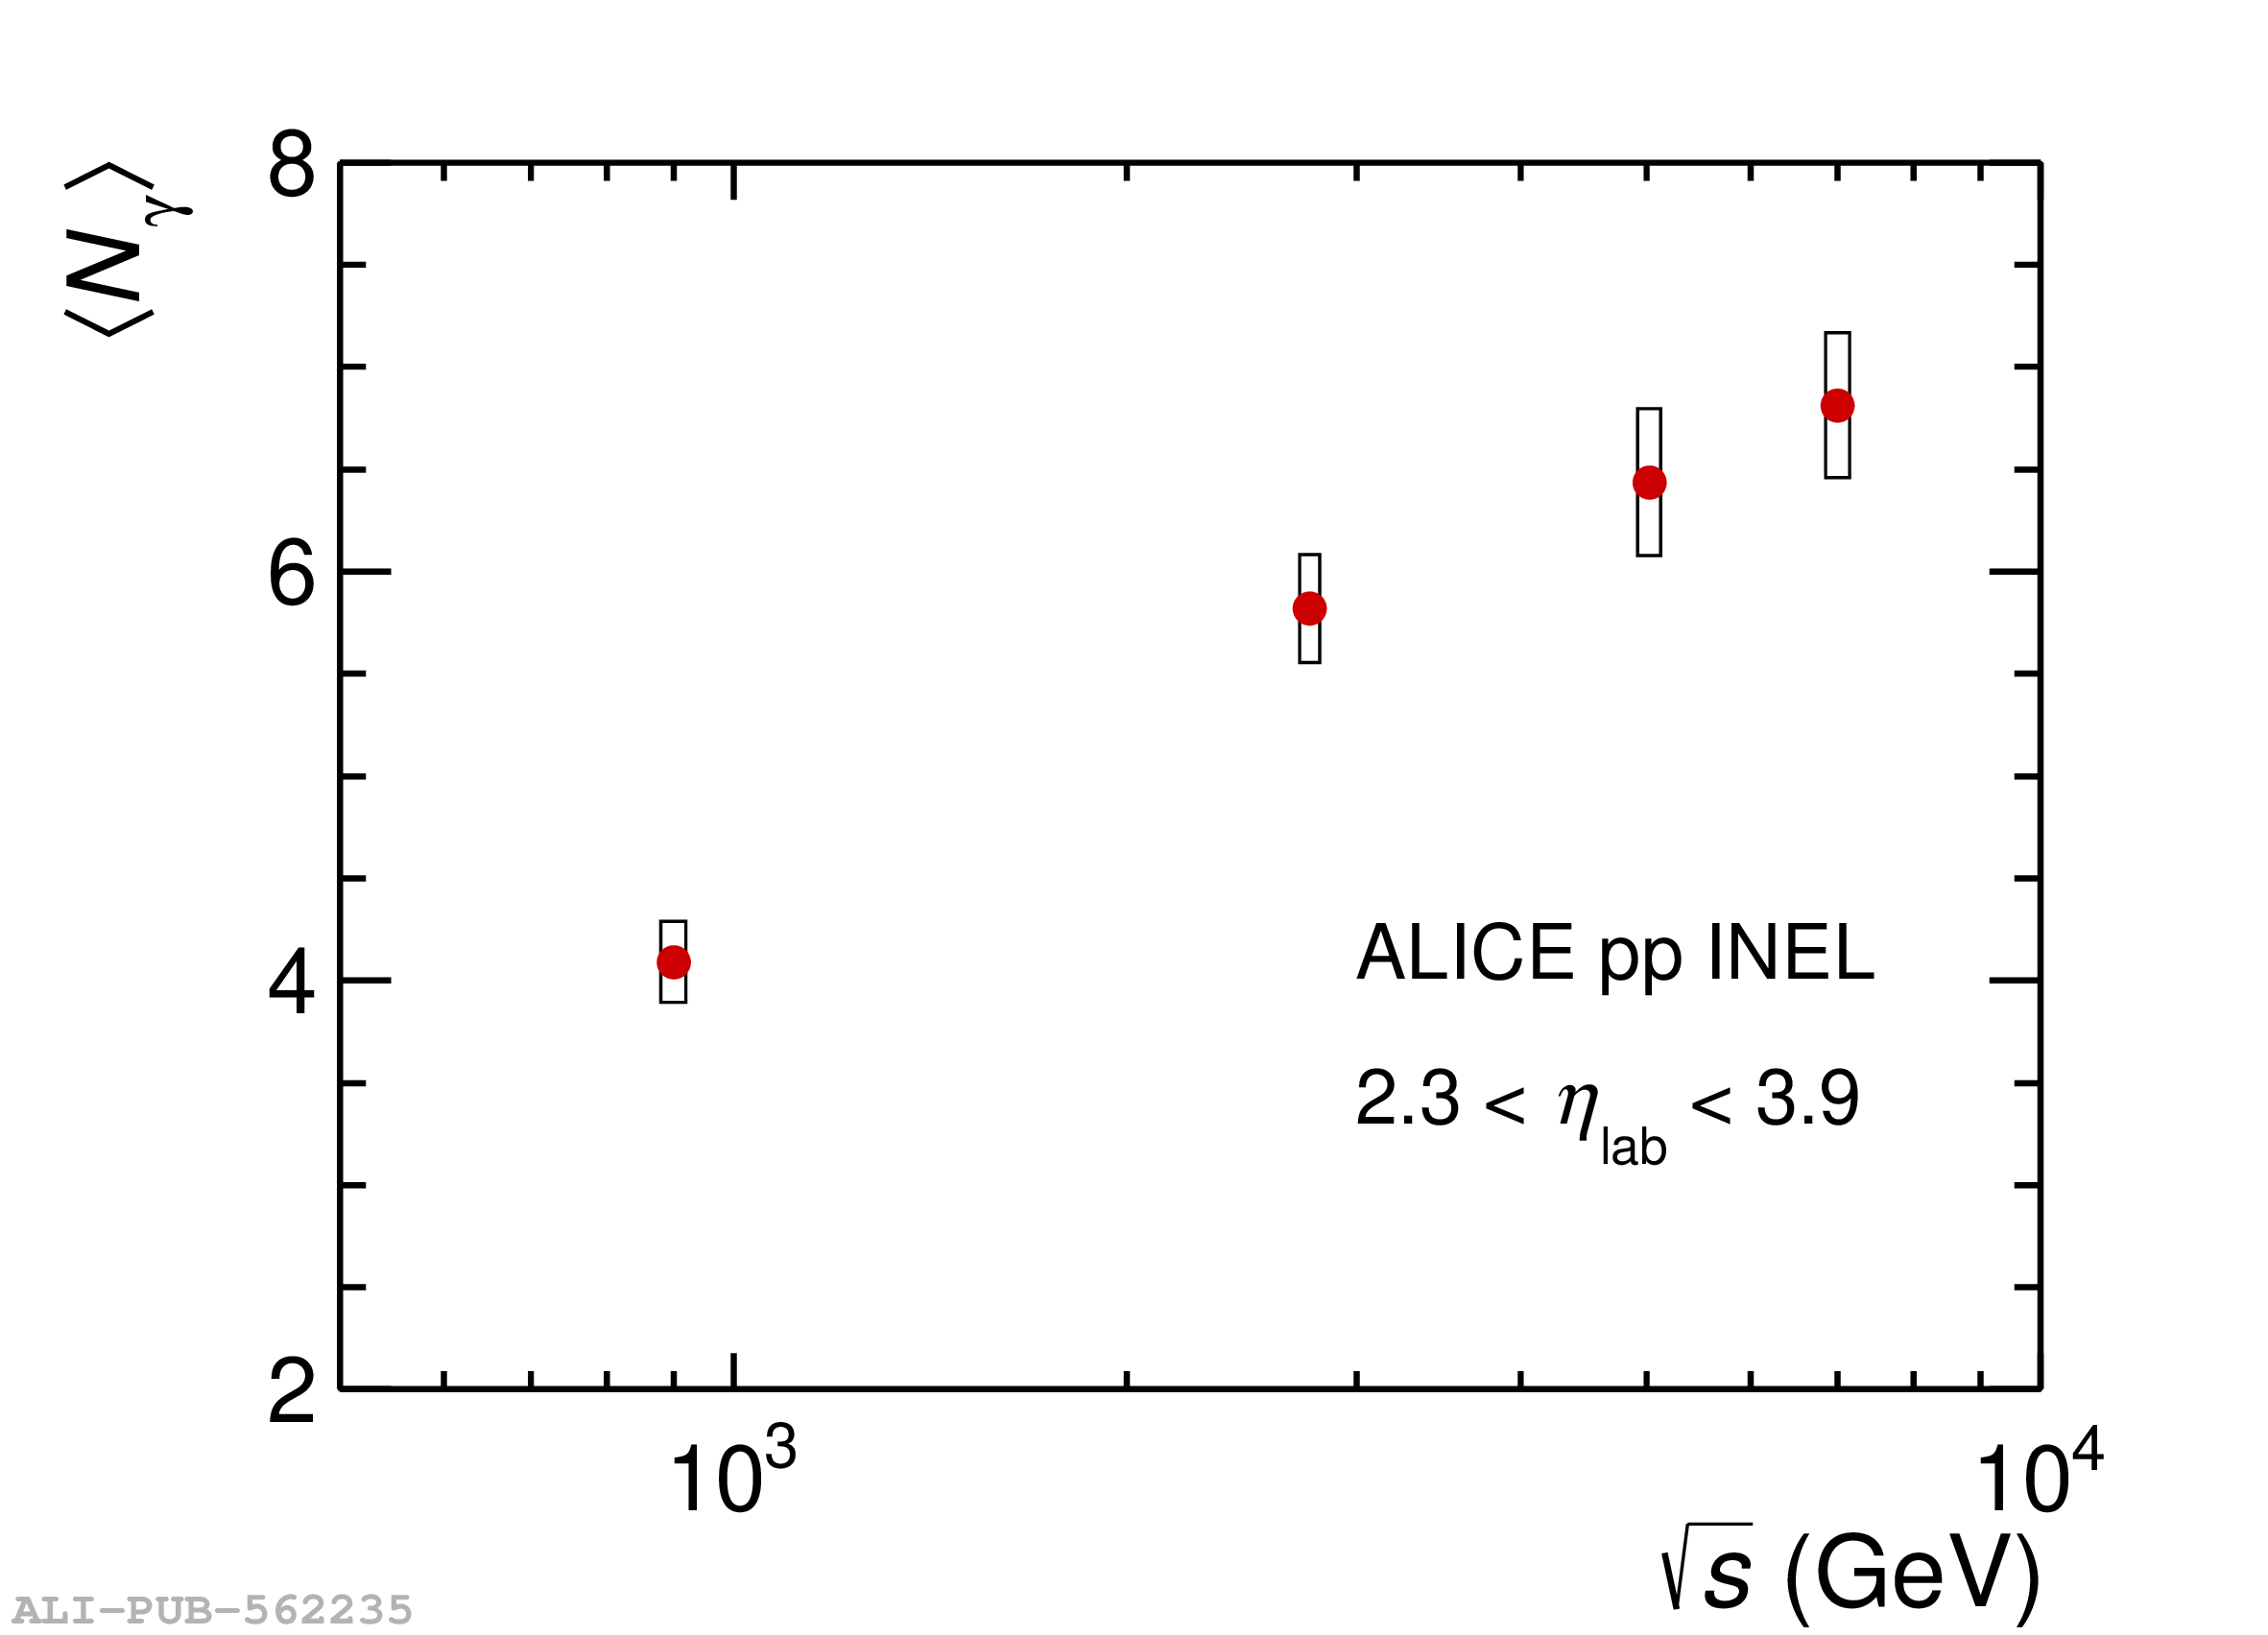 |
Figure 7
The pseudorapidity distributions of inclusive photons are compared with charged-particle measurements at midrapidity by ALICE in \pp collisions (a) and both ALICE and CMS in \pPb collisions at \fivenn (b). Mirrored data points of \pp and \Pbp results and predictions from various MC models are superimposed. | 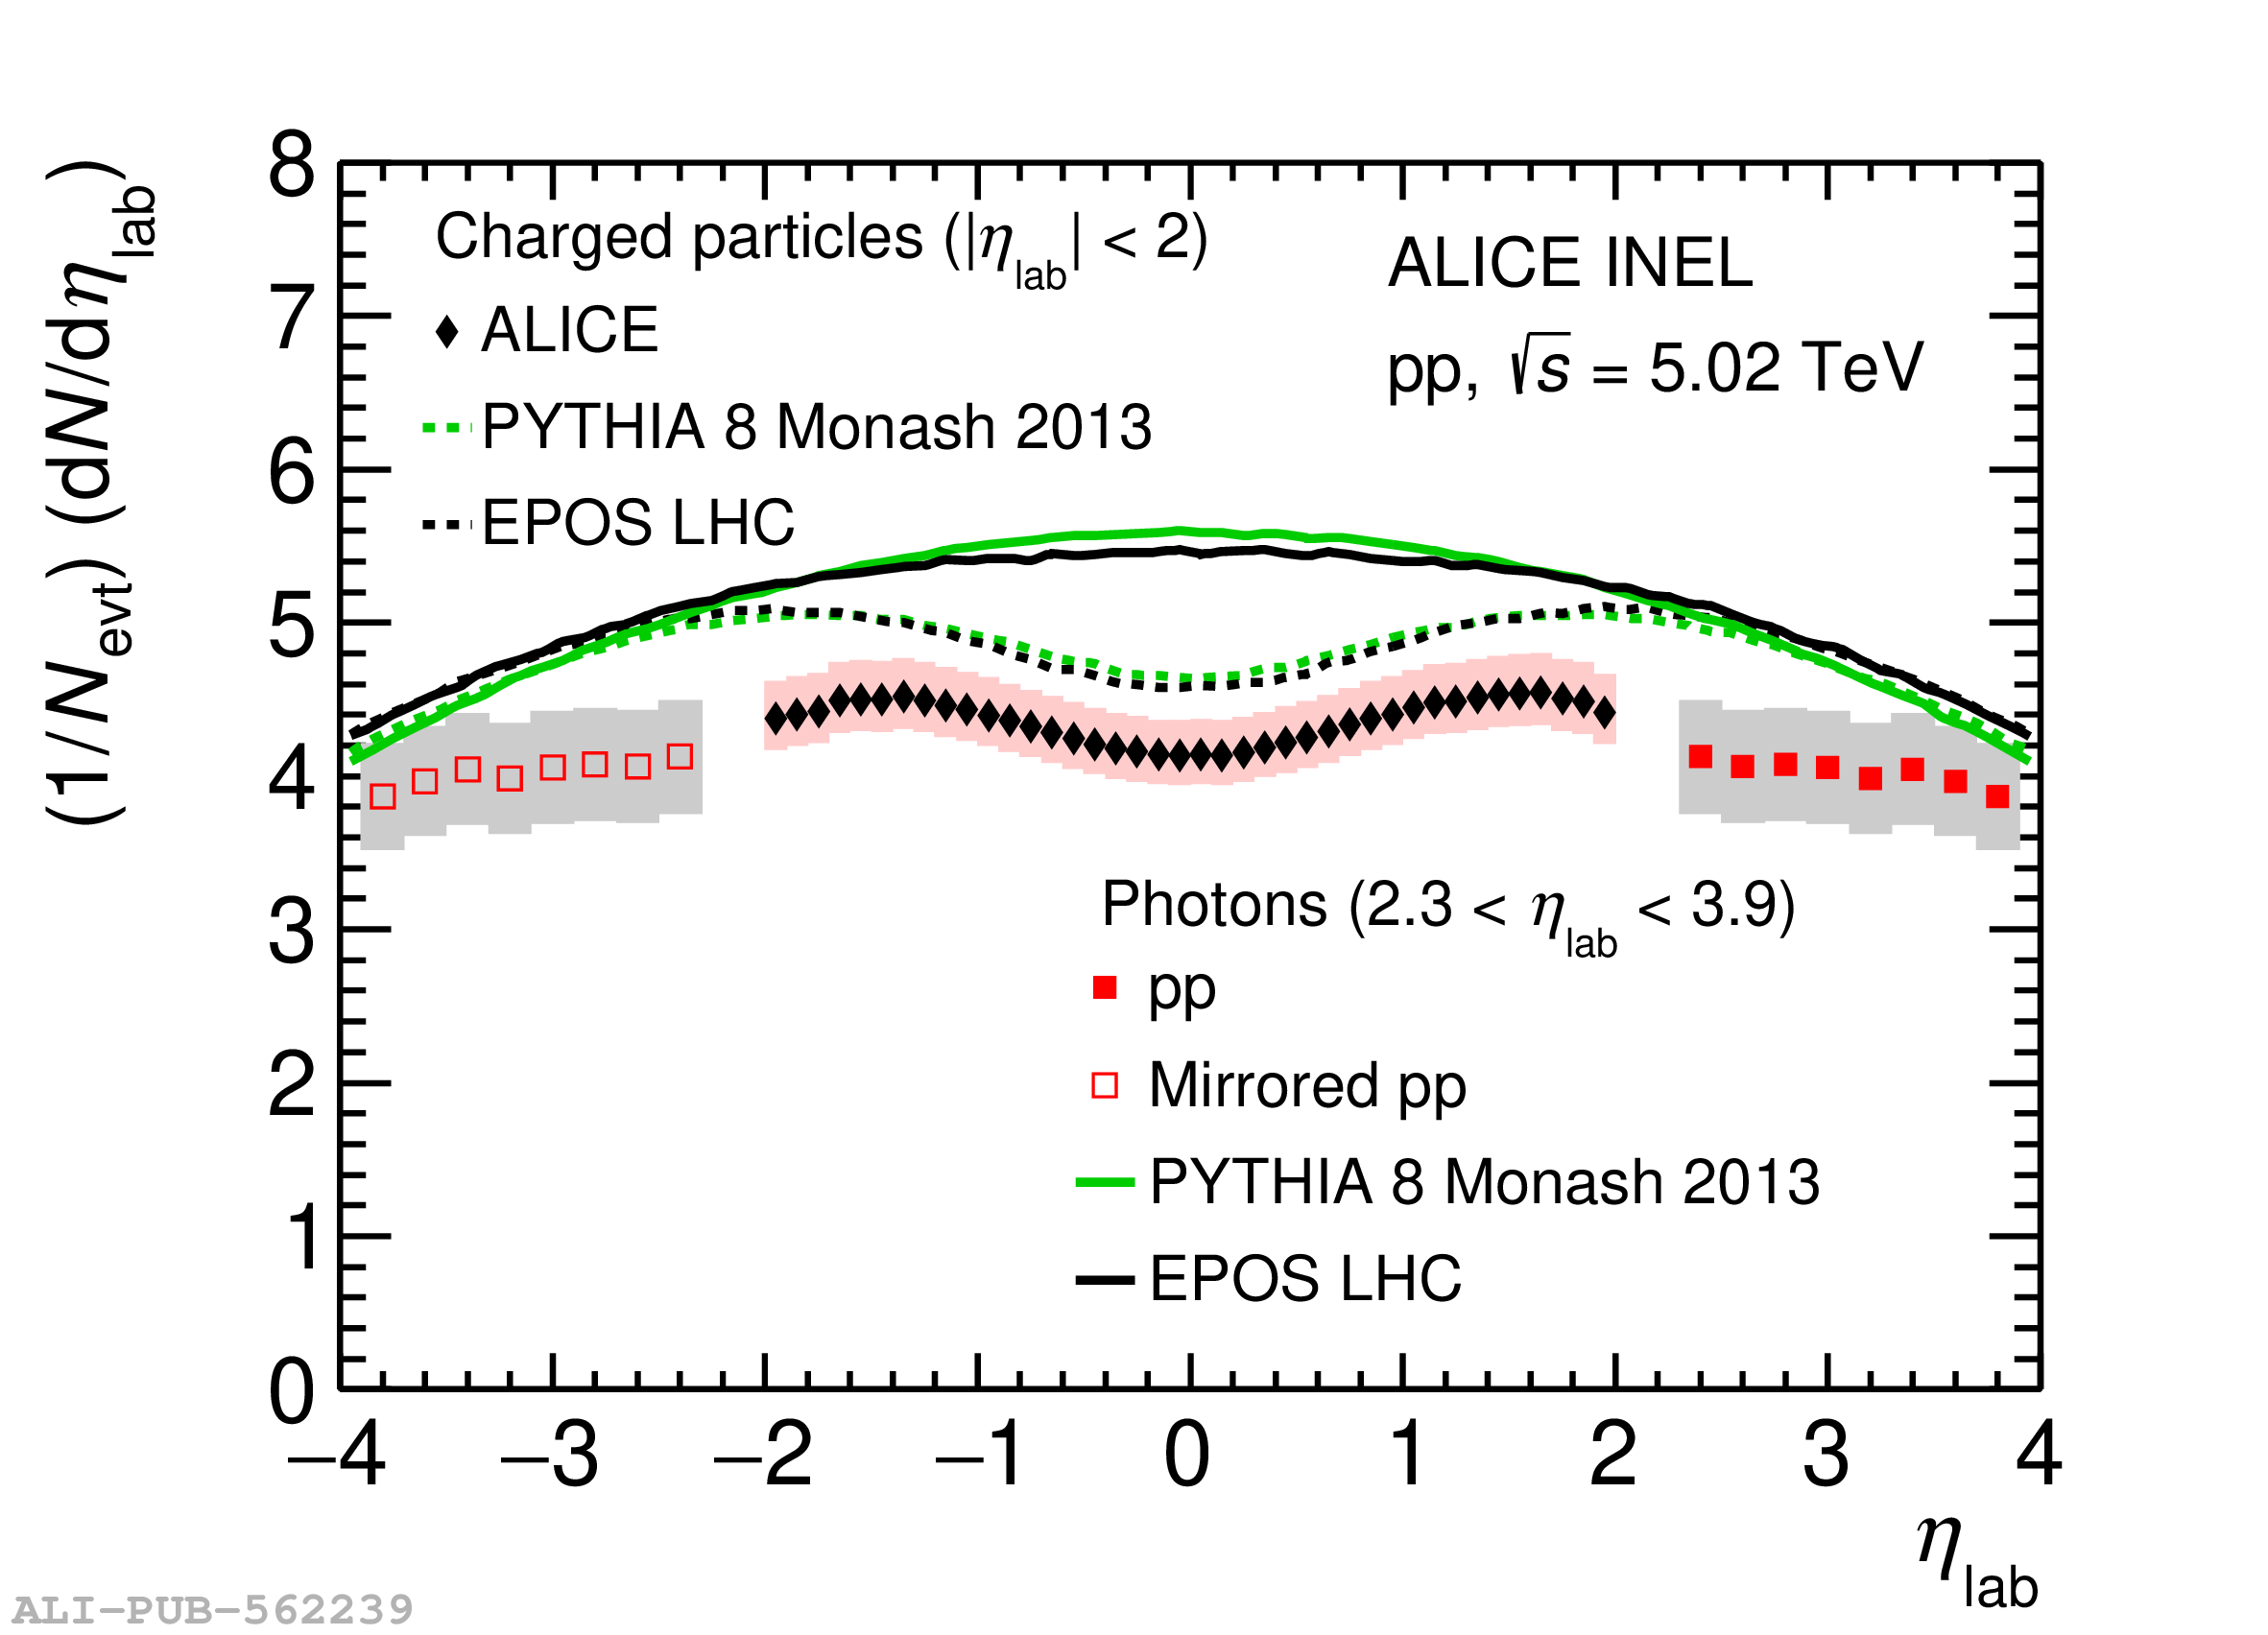 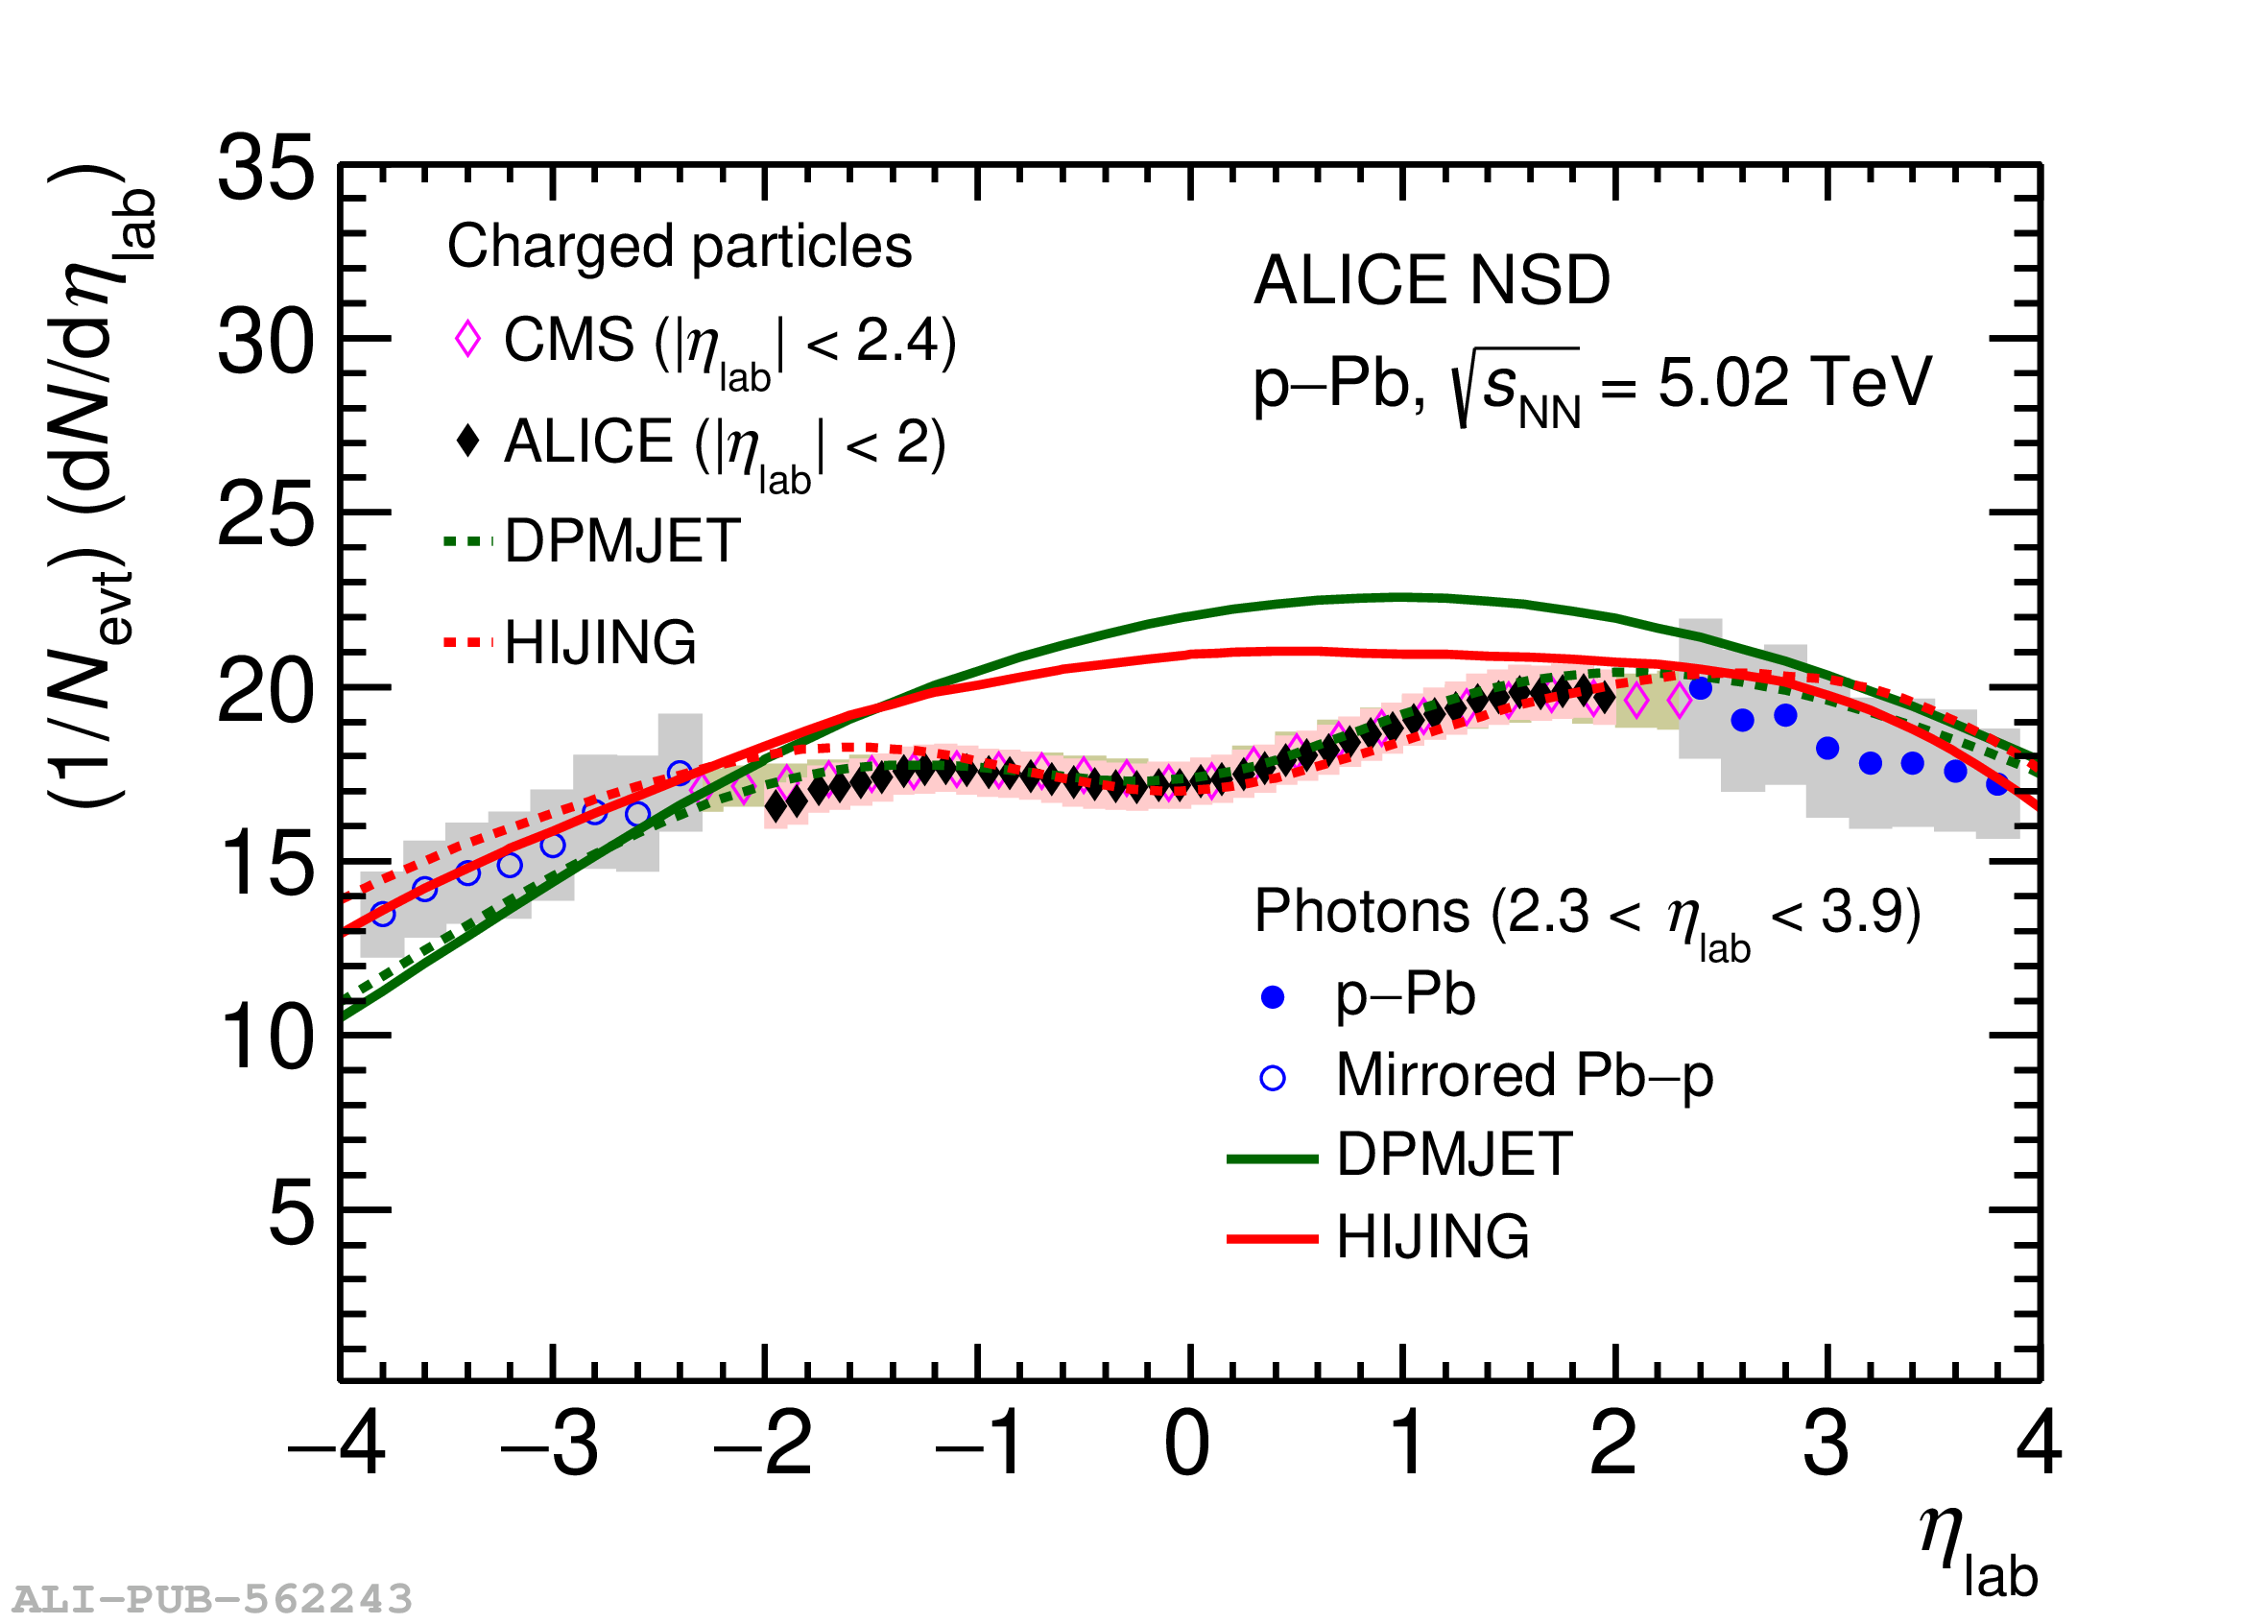 |

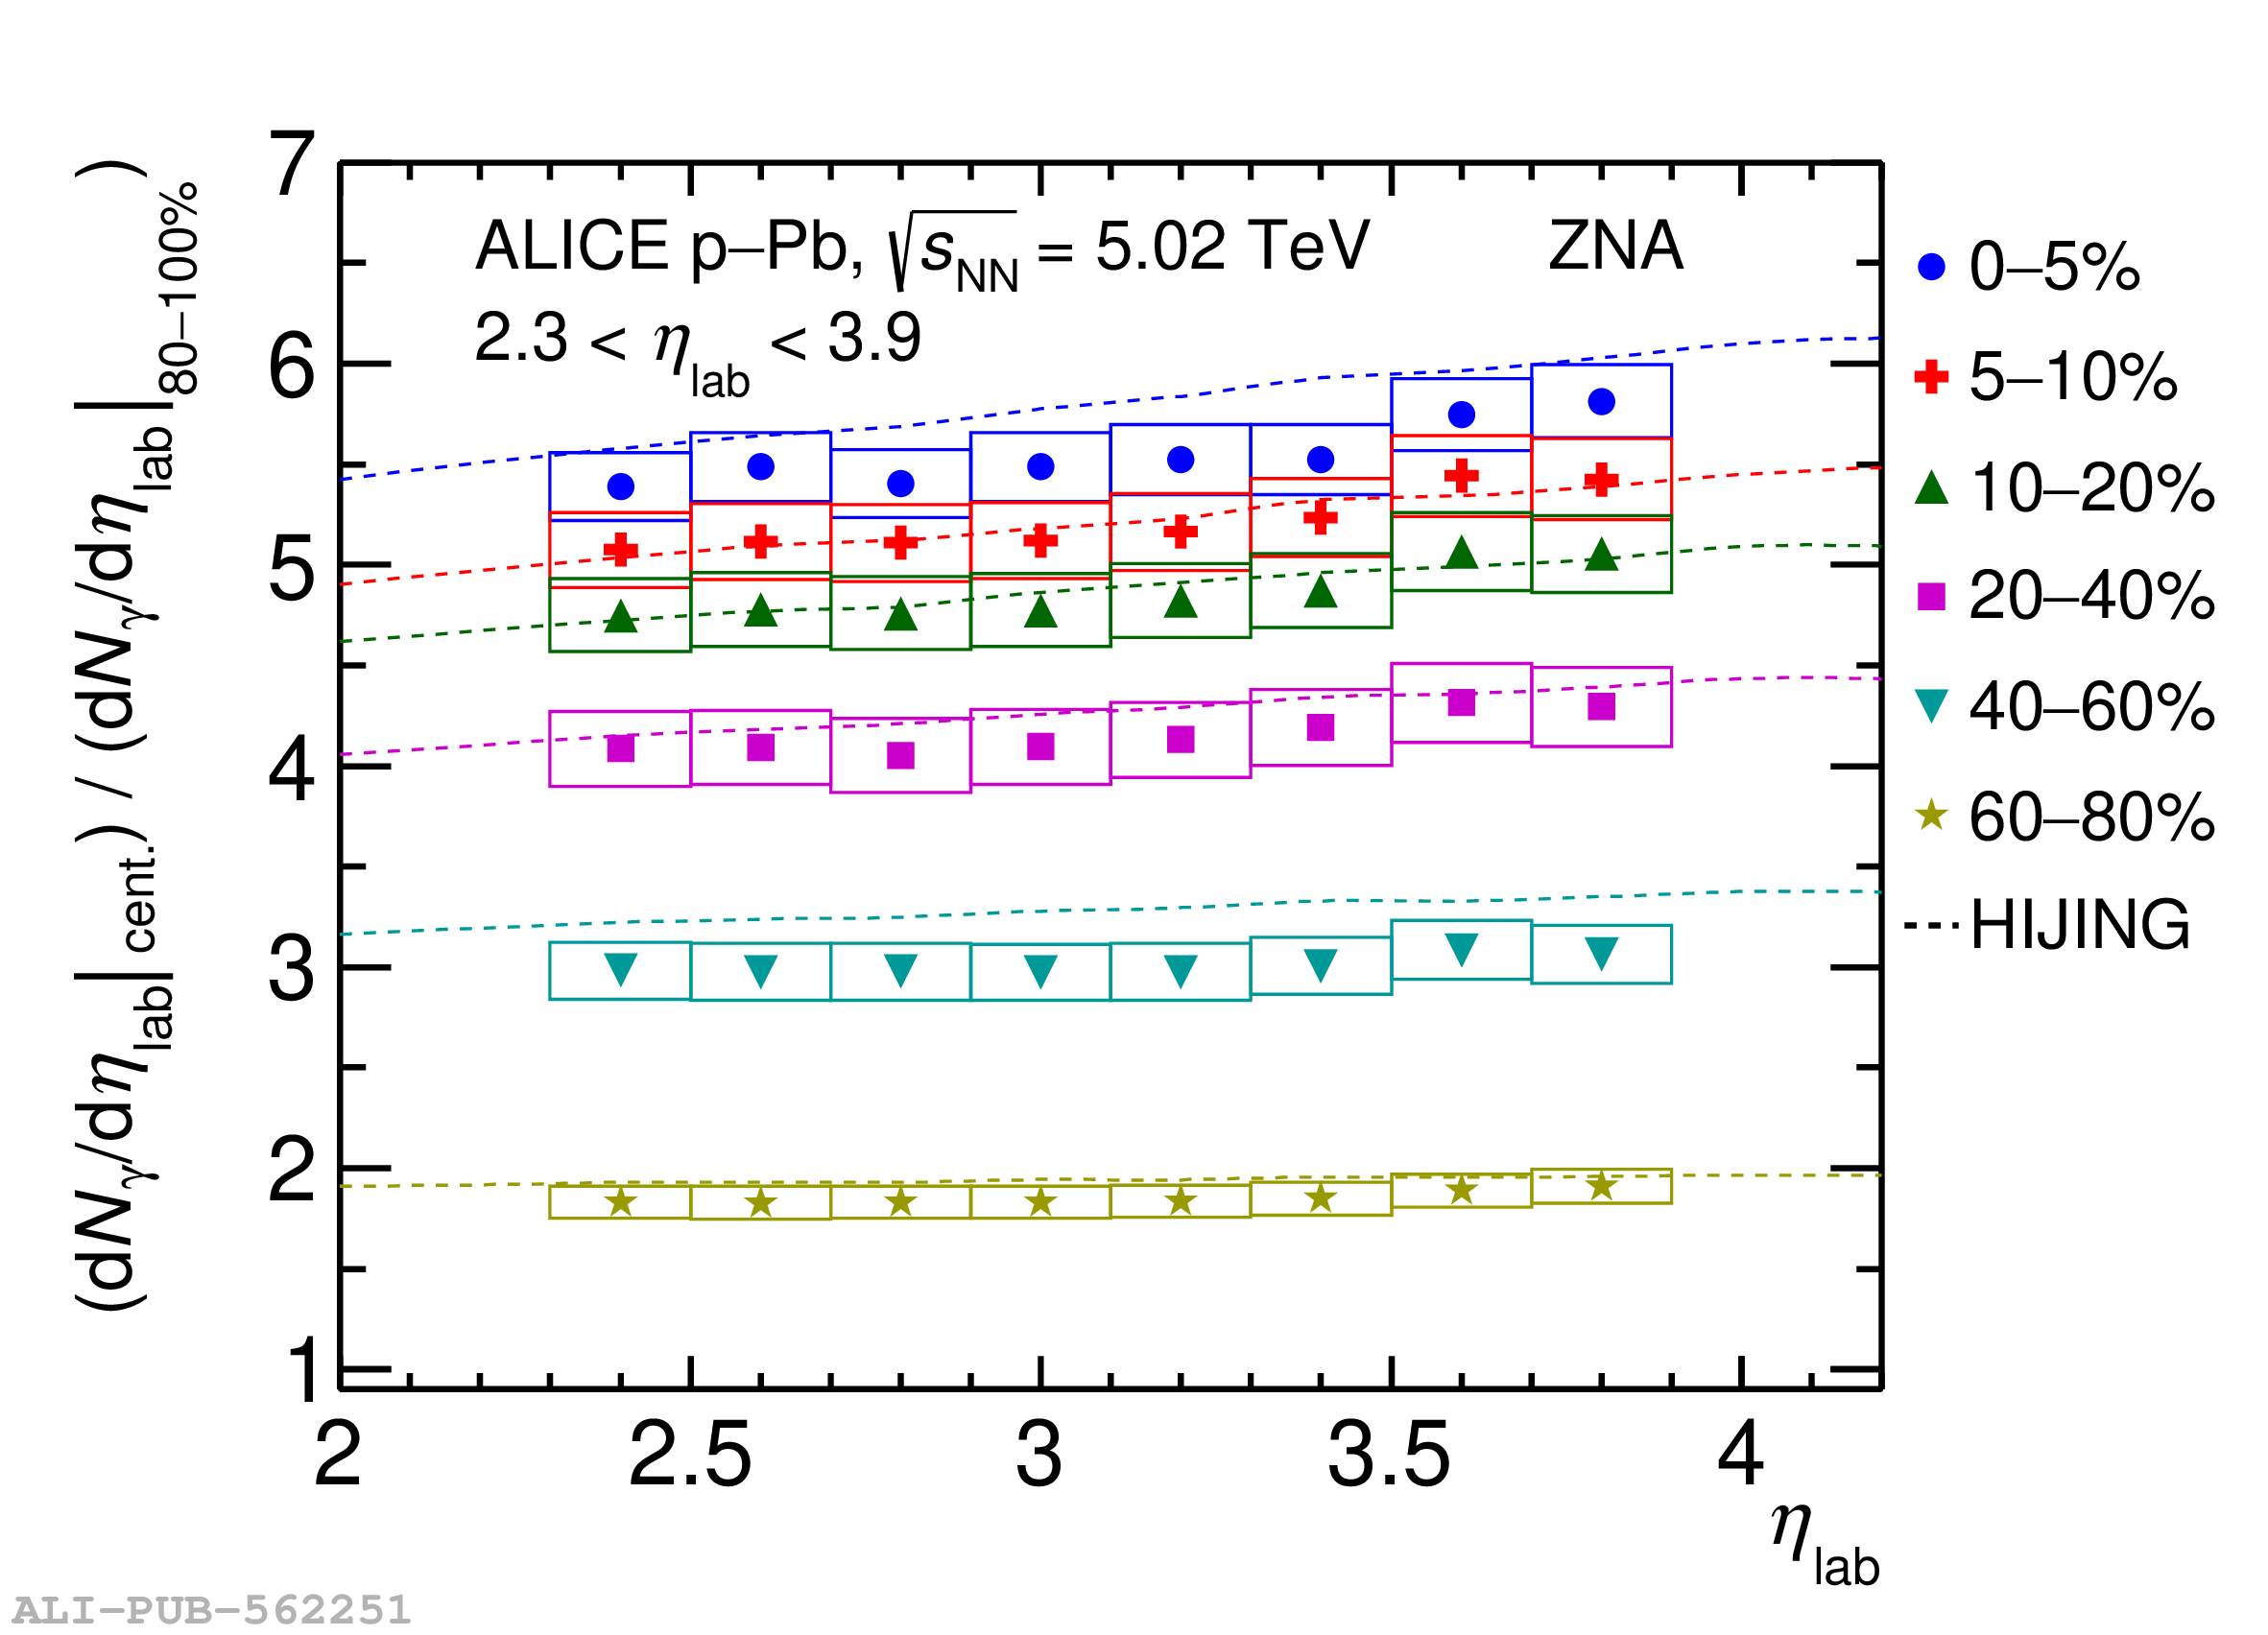
Figure 10
Pseudorapidity distribution of inclusive photons measured within 2.3 $<$ $\etalab$ $<$ 3.9 in \pPb collisions at \fivenn compared with the charged-particle measurements and to \hijing predictions for three centrality classes and for two centrality estimators: CL1 (top), \ZNA (bottom). | 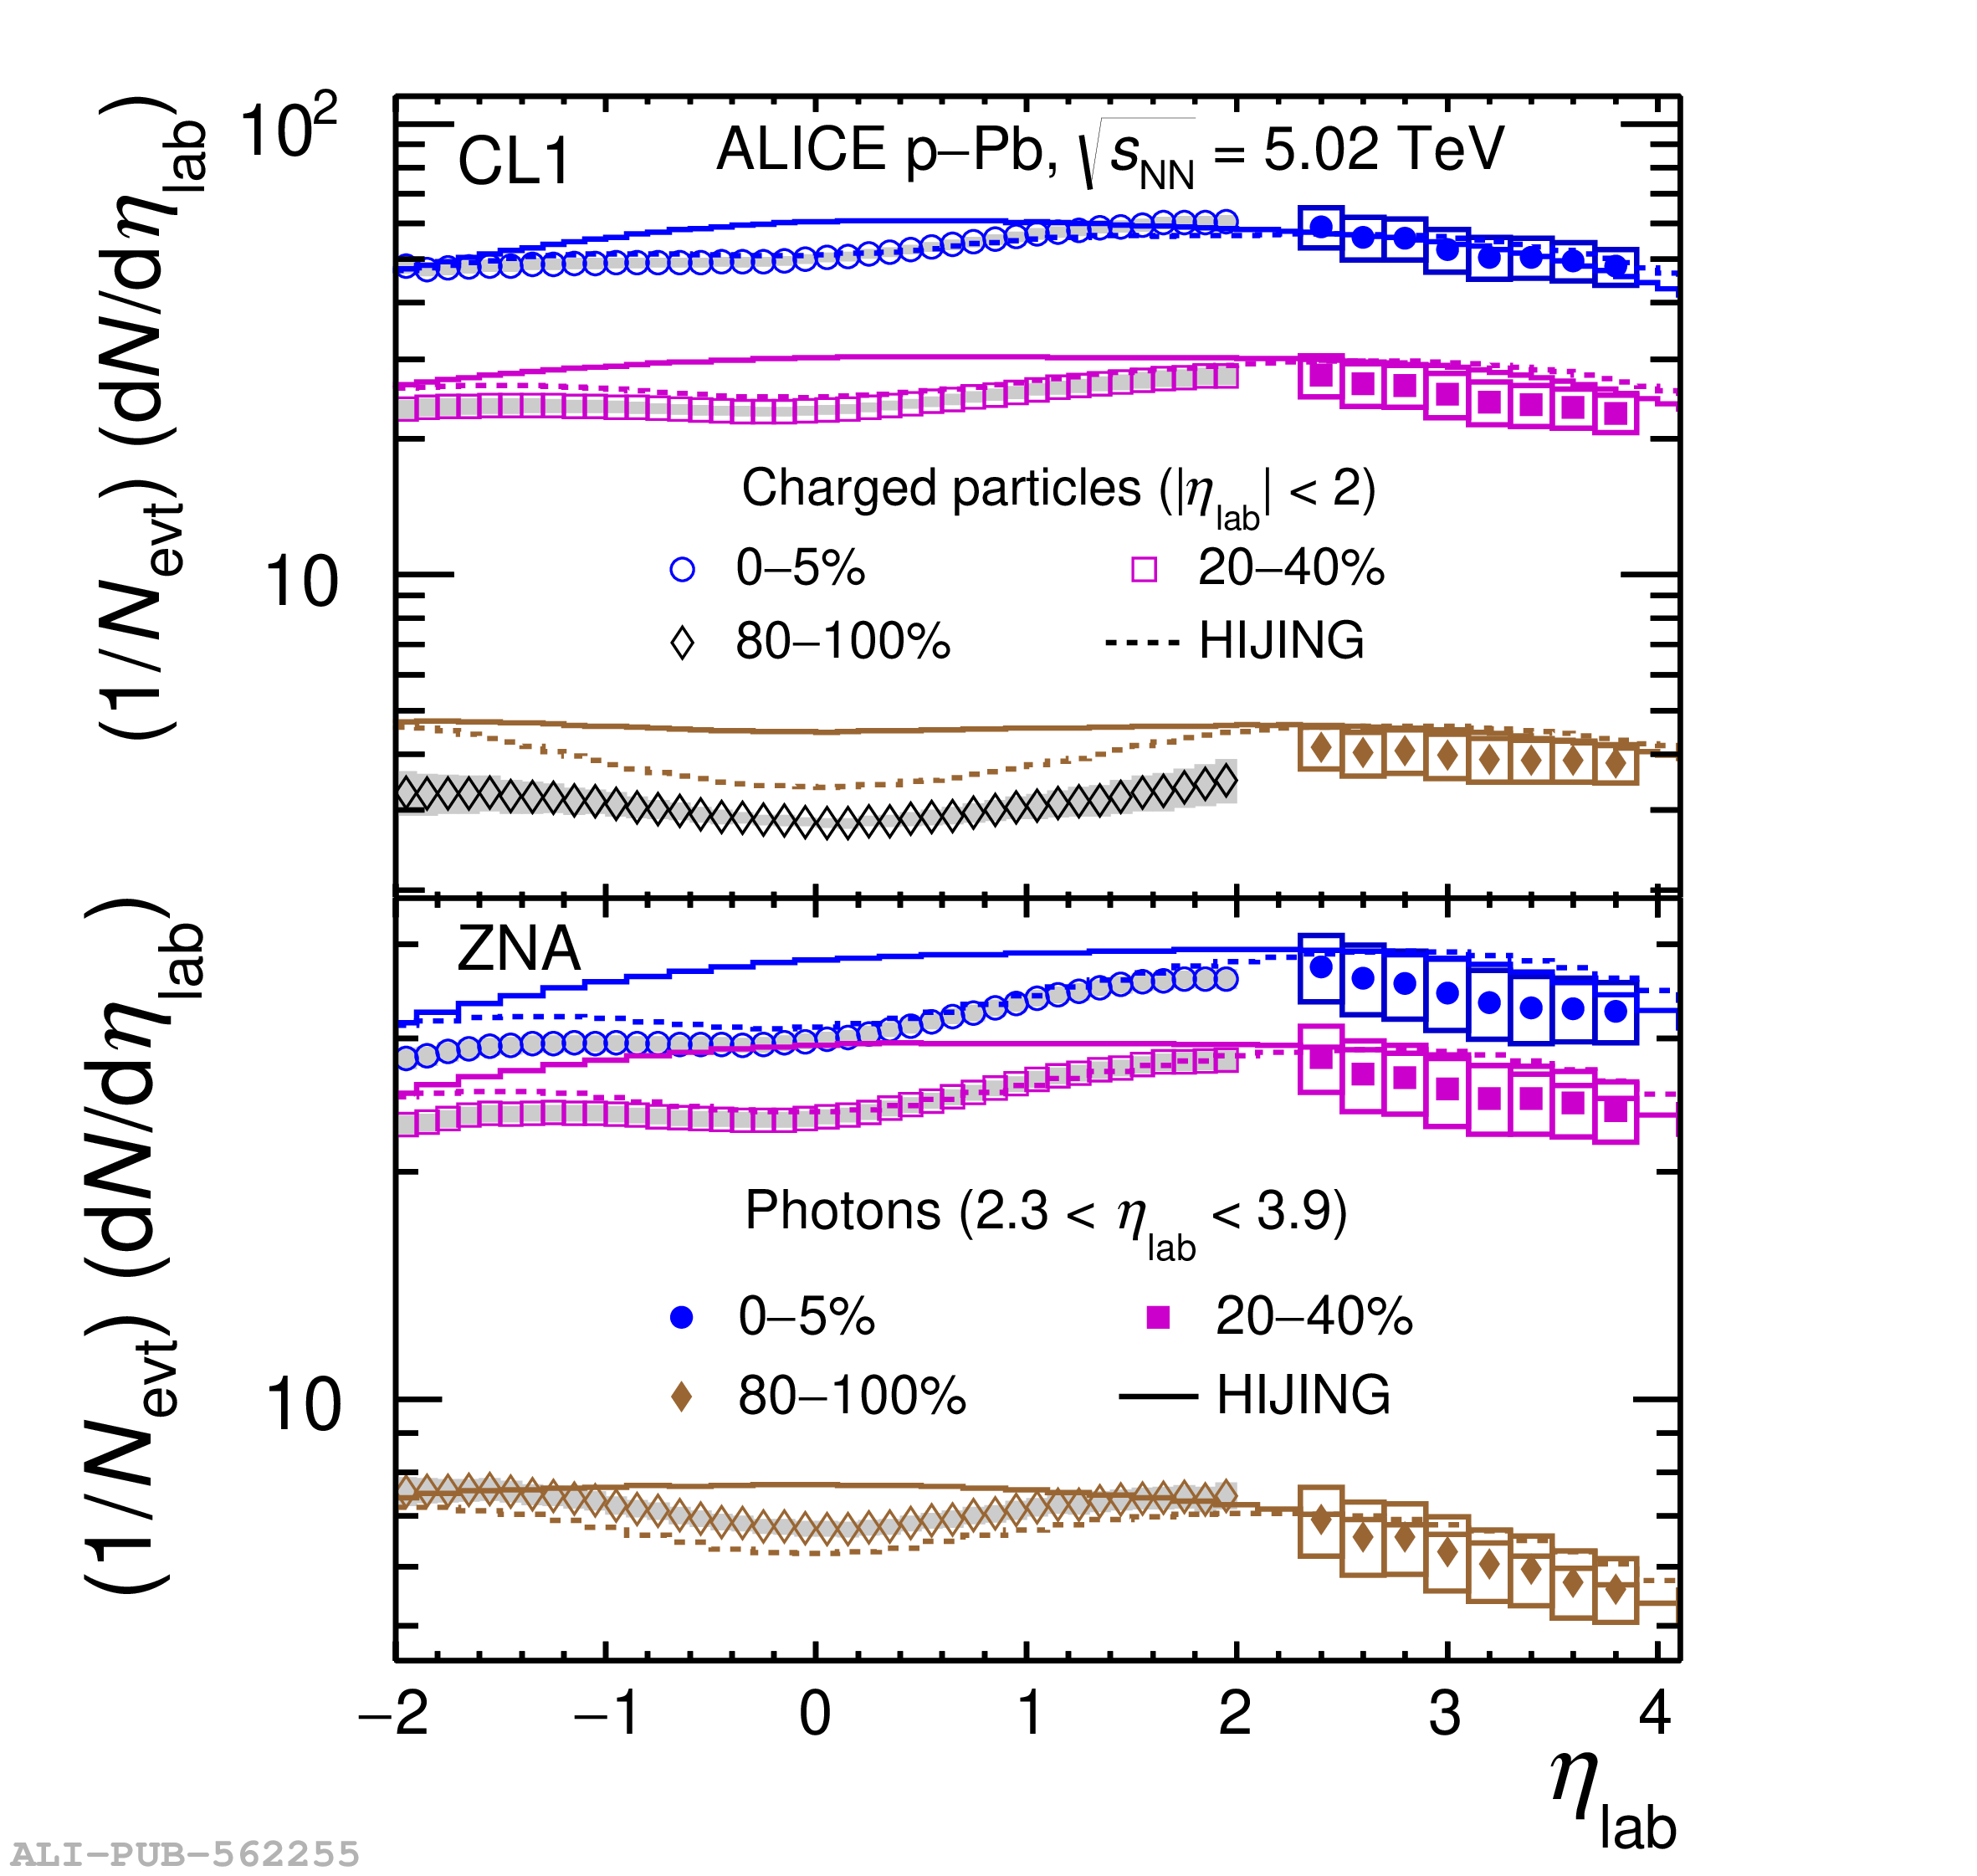 |
Figure 11
(a) The average photon multiplicity $\langle N_{\rm \gamma} \rangle$ within 2.3 $< \etalab <$ 3.9 as a function of the average number of participants for various centrality estimators in \pPb collisions at \fivenn. Values of $\langle N_{\rm \gamma} \rangle$/$\langle \Npart \rangle$ are shown as a function of $\langle \Npart \rangle$ (b) and $\langle N_{\rm \gamma} \rangle$ (c). The lines between the data points are to guide the eye. The data point for \pp collisions at \five is also included for reference. | 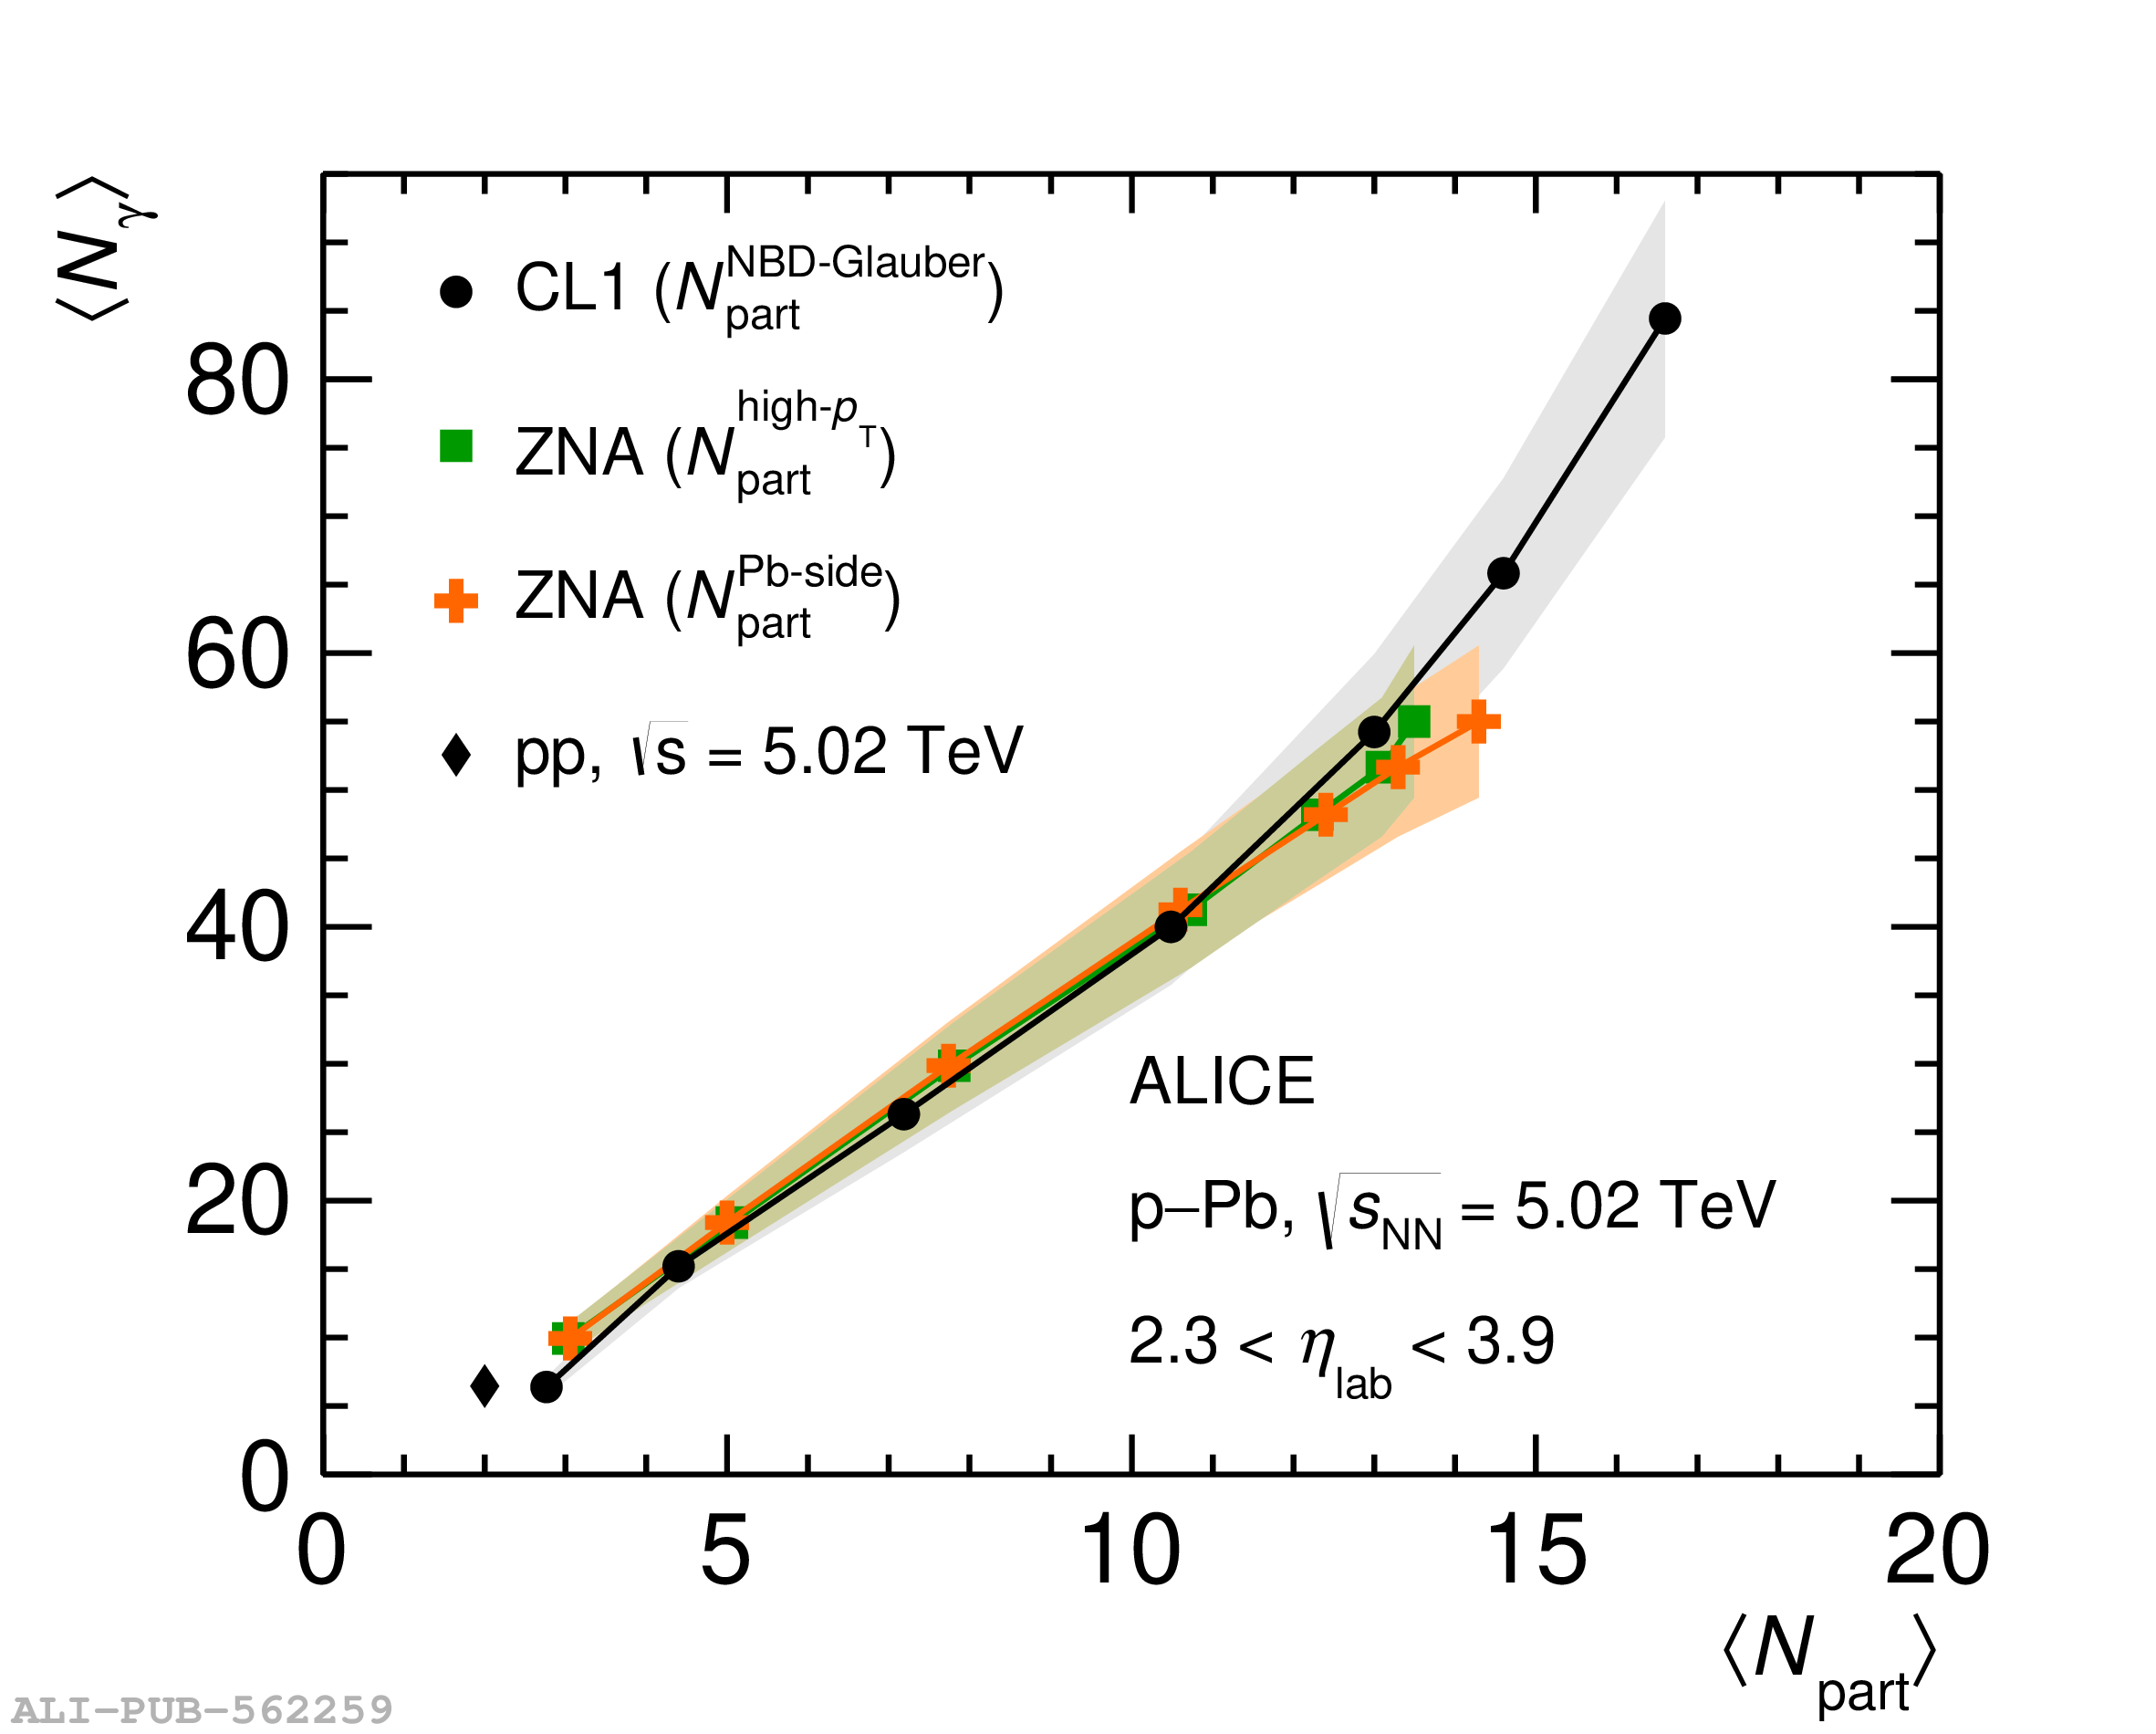 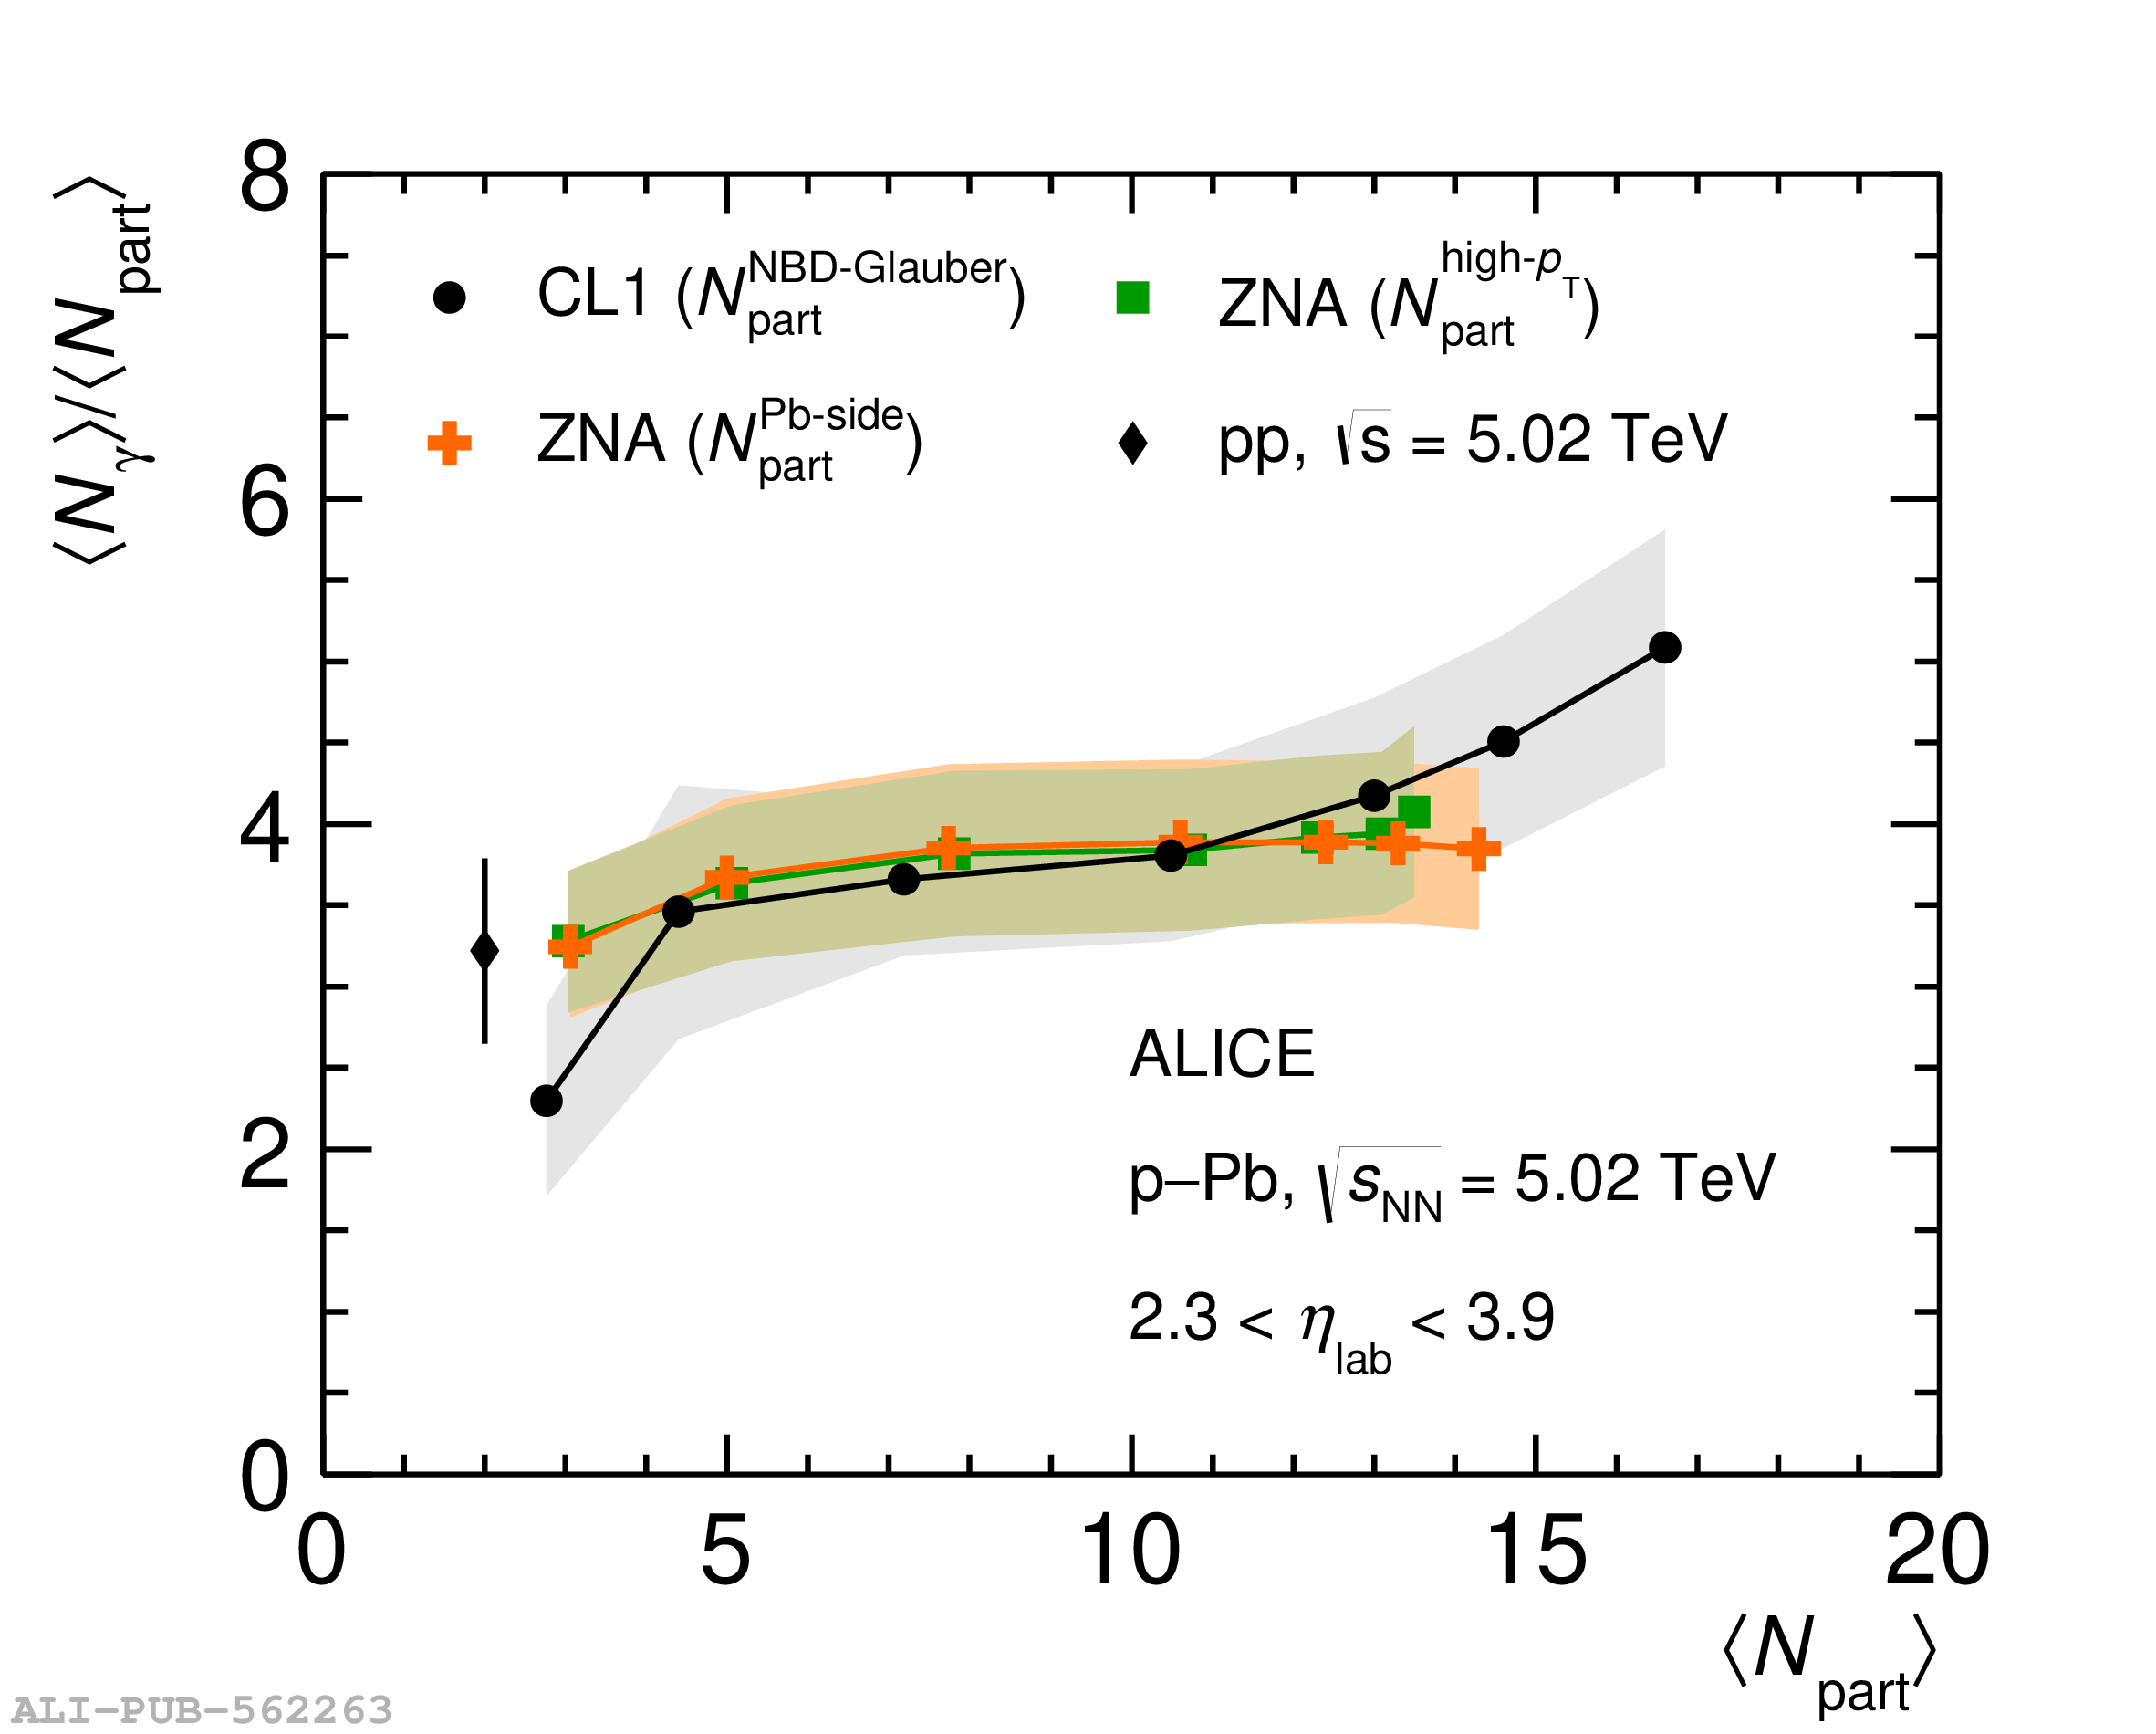 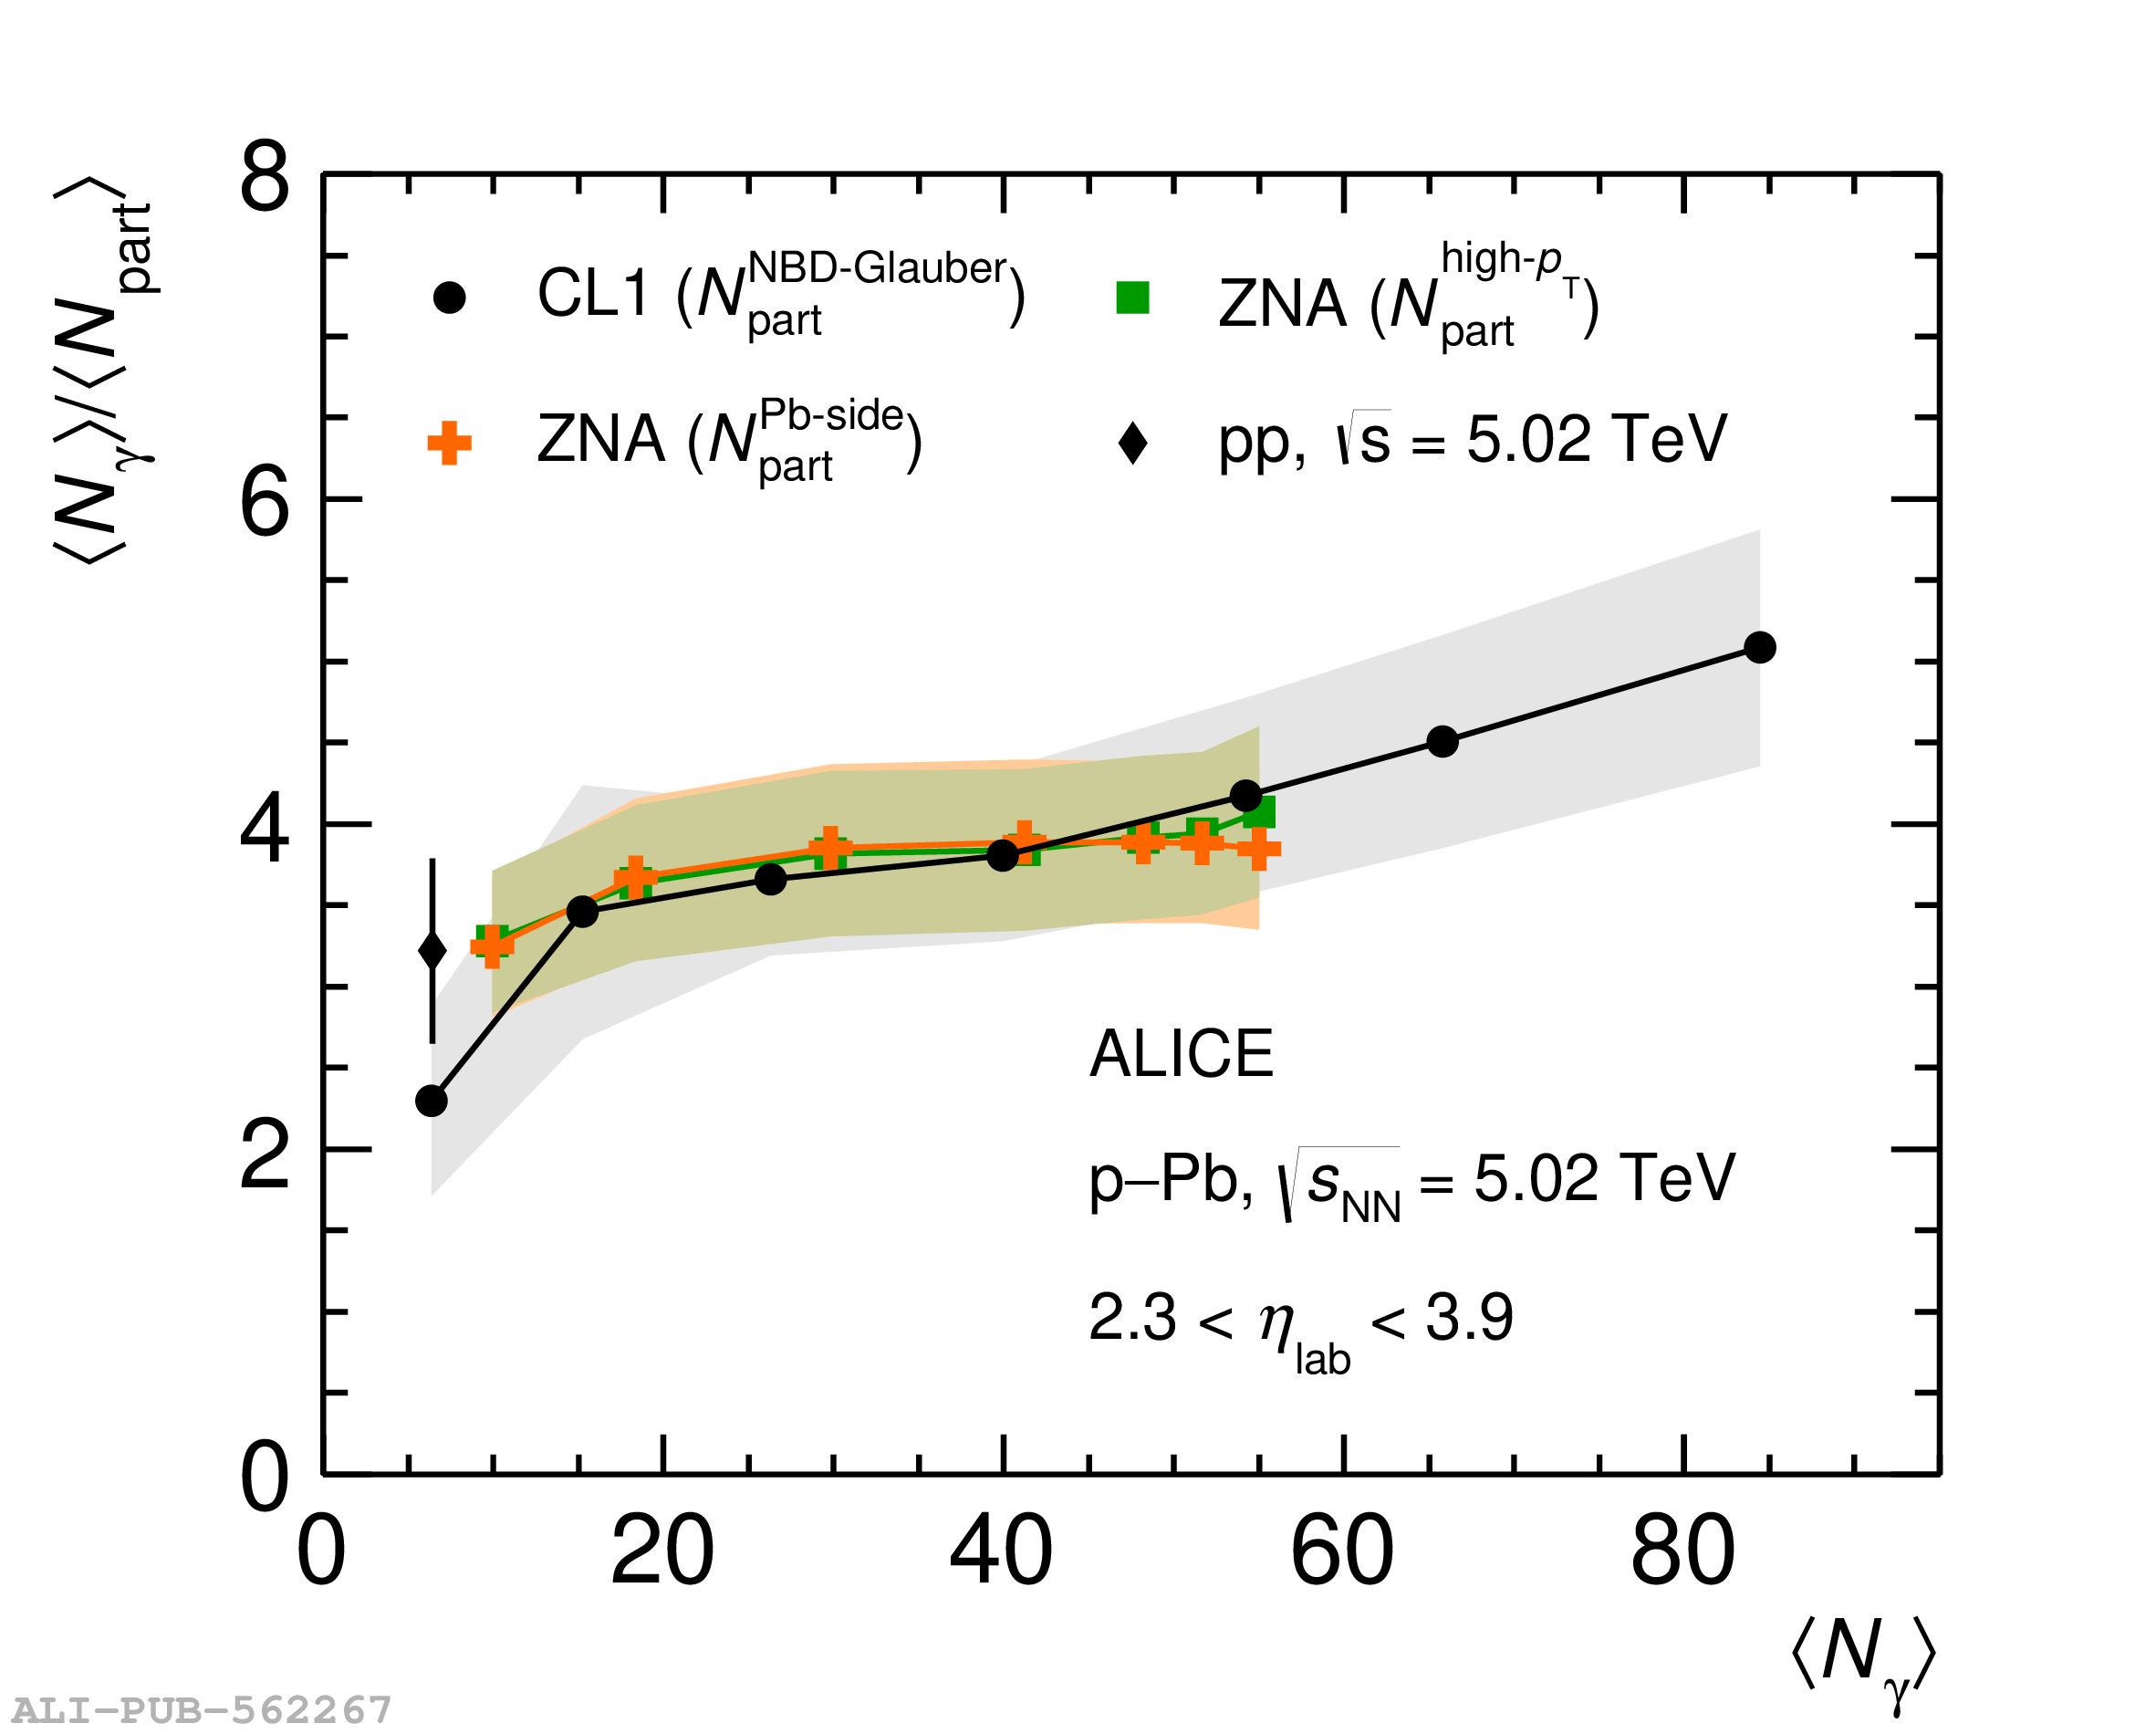 |
Figure A.1
The mean (a) and width (b) of the distribution of reconstructed photon multiplicity ($N_{\gamma\text-\rm like}$) as a function of true photon multiplicity ($N_{\gamma\text-\rm true}$) are presented for \pp collisions at \five. The dotted lines correspond to $N_{\gamma\text-\rm true}$ = 44 up to which the results are reported in the paper. | 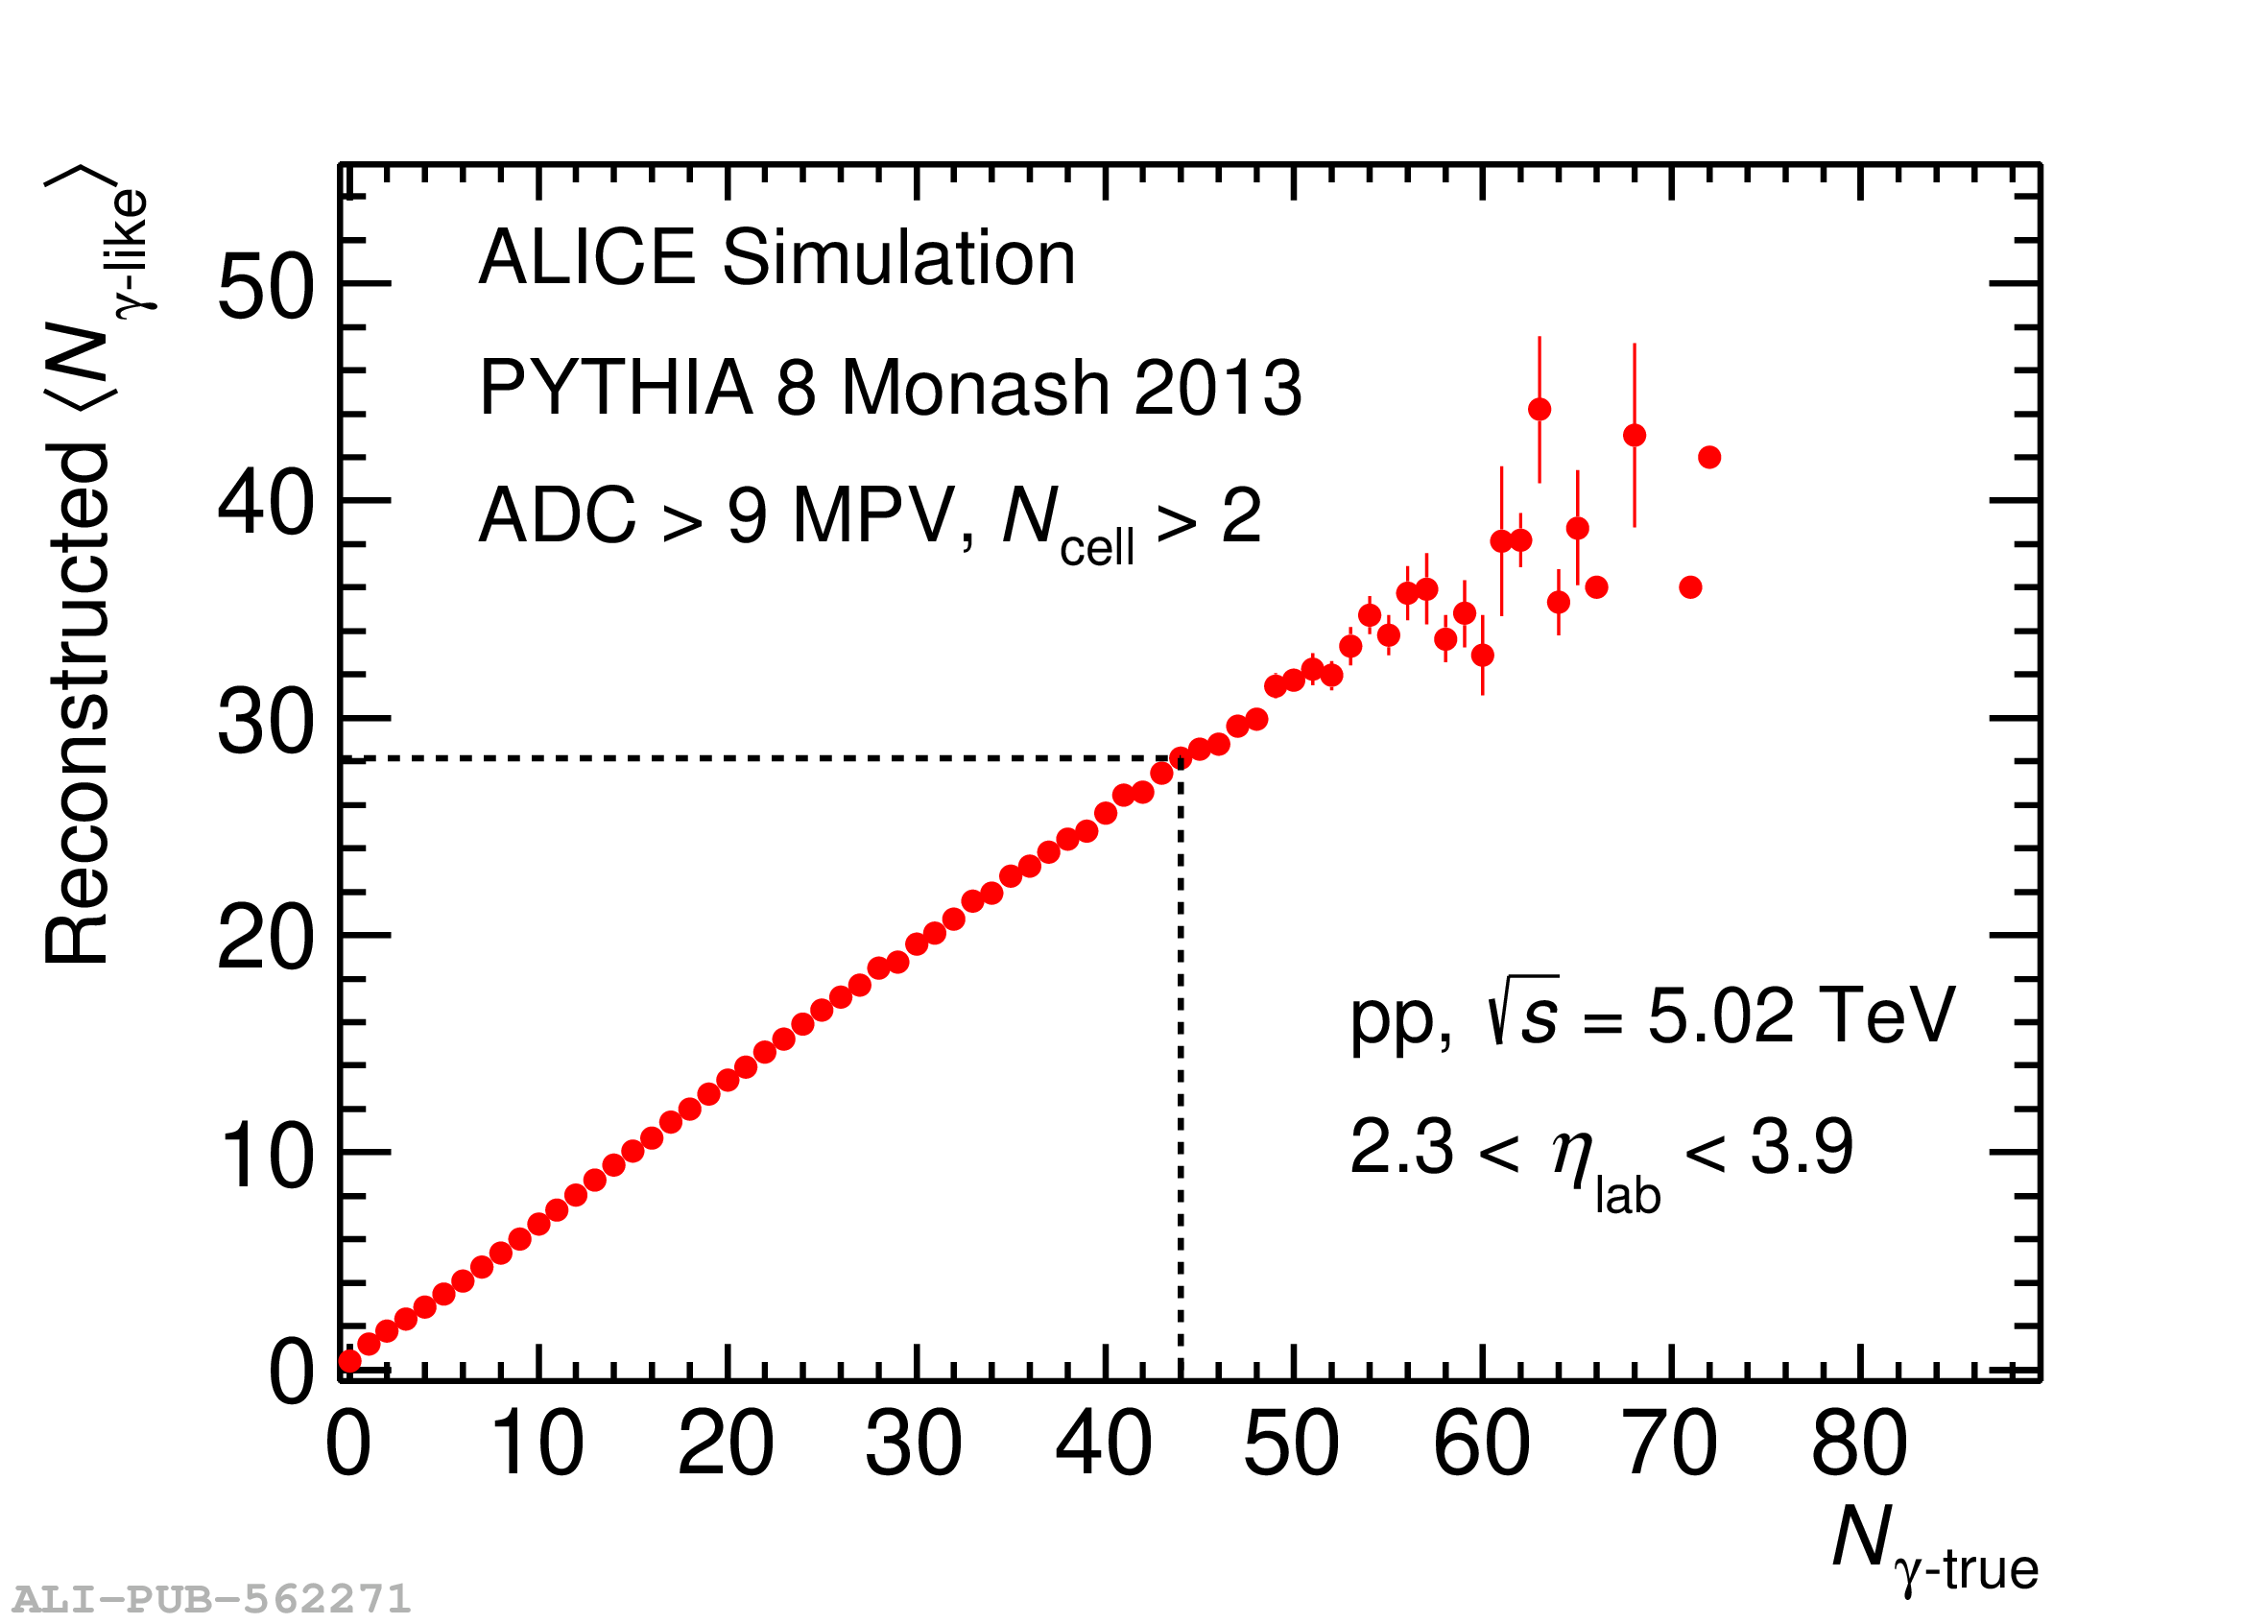 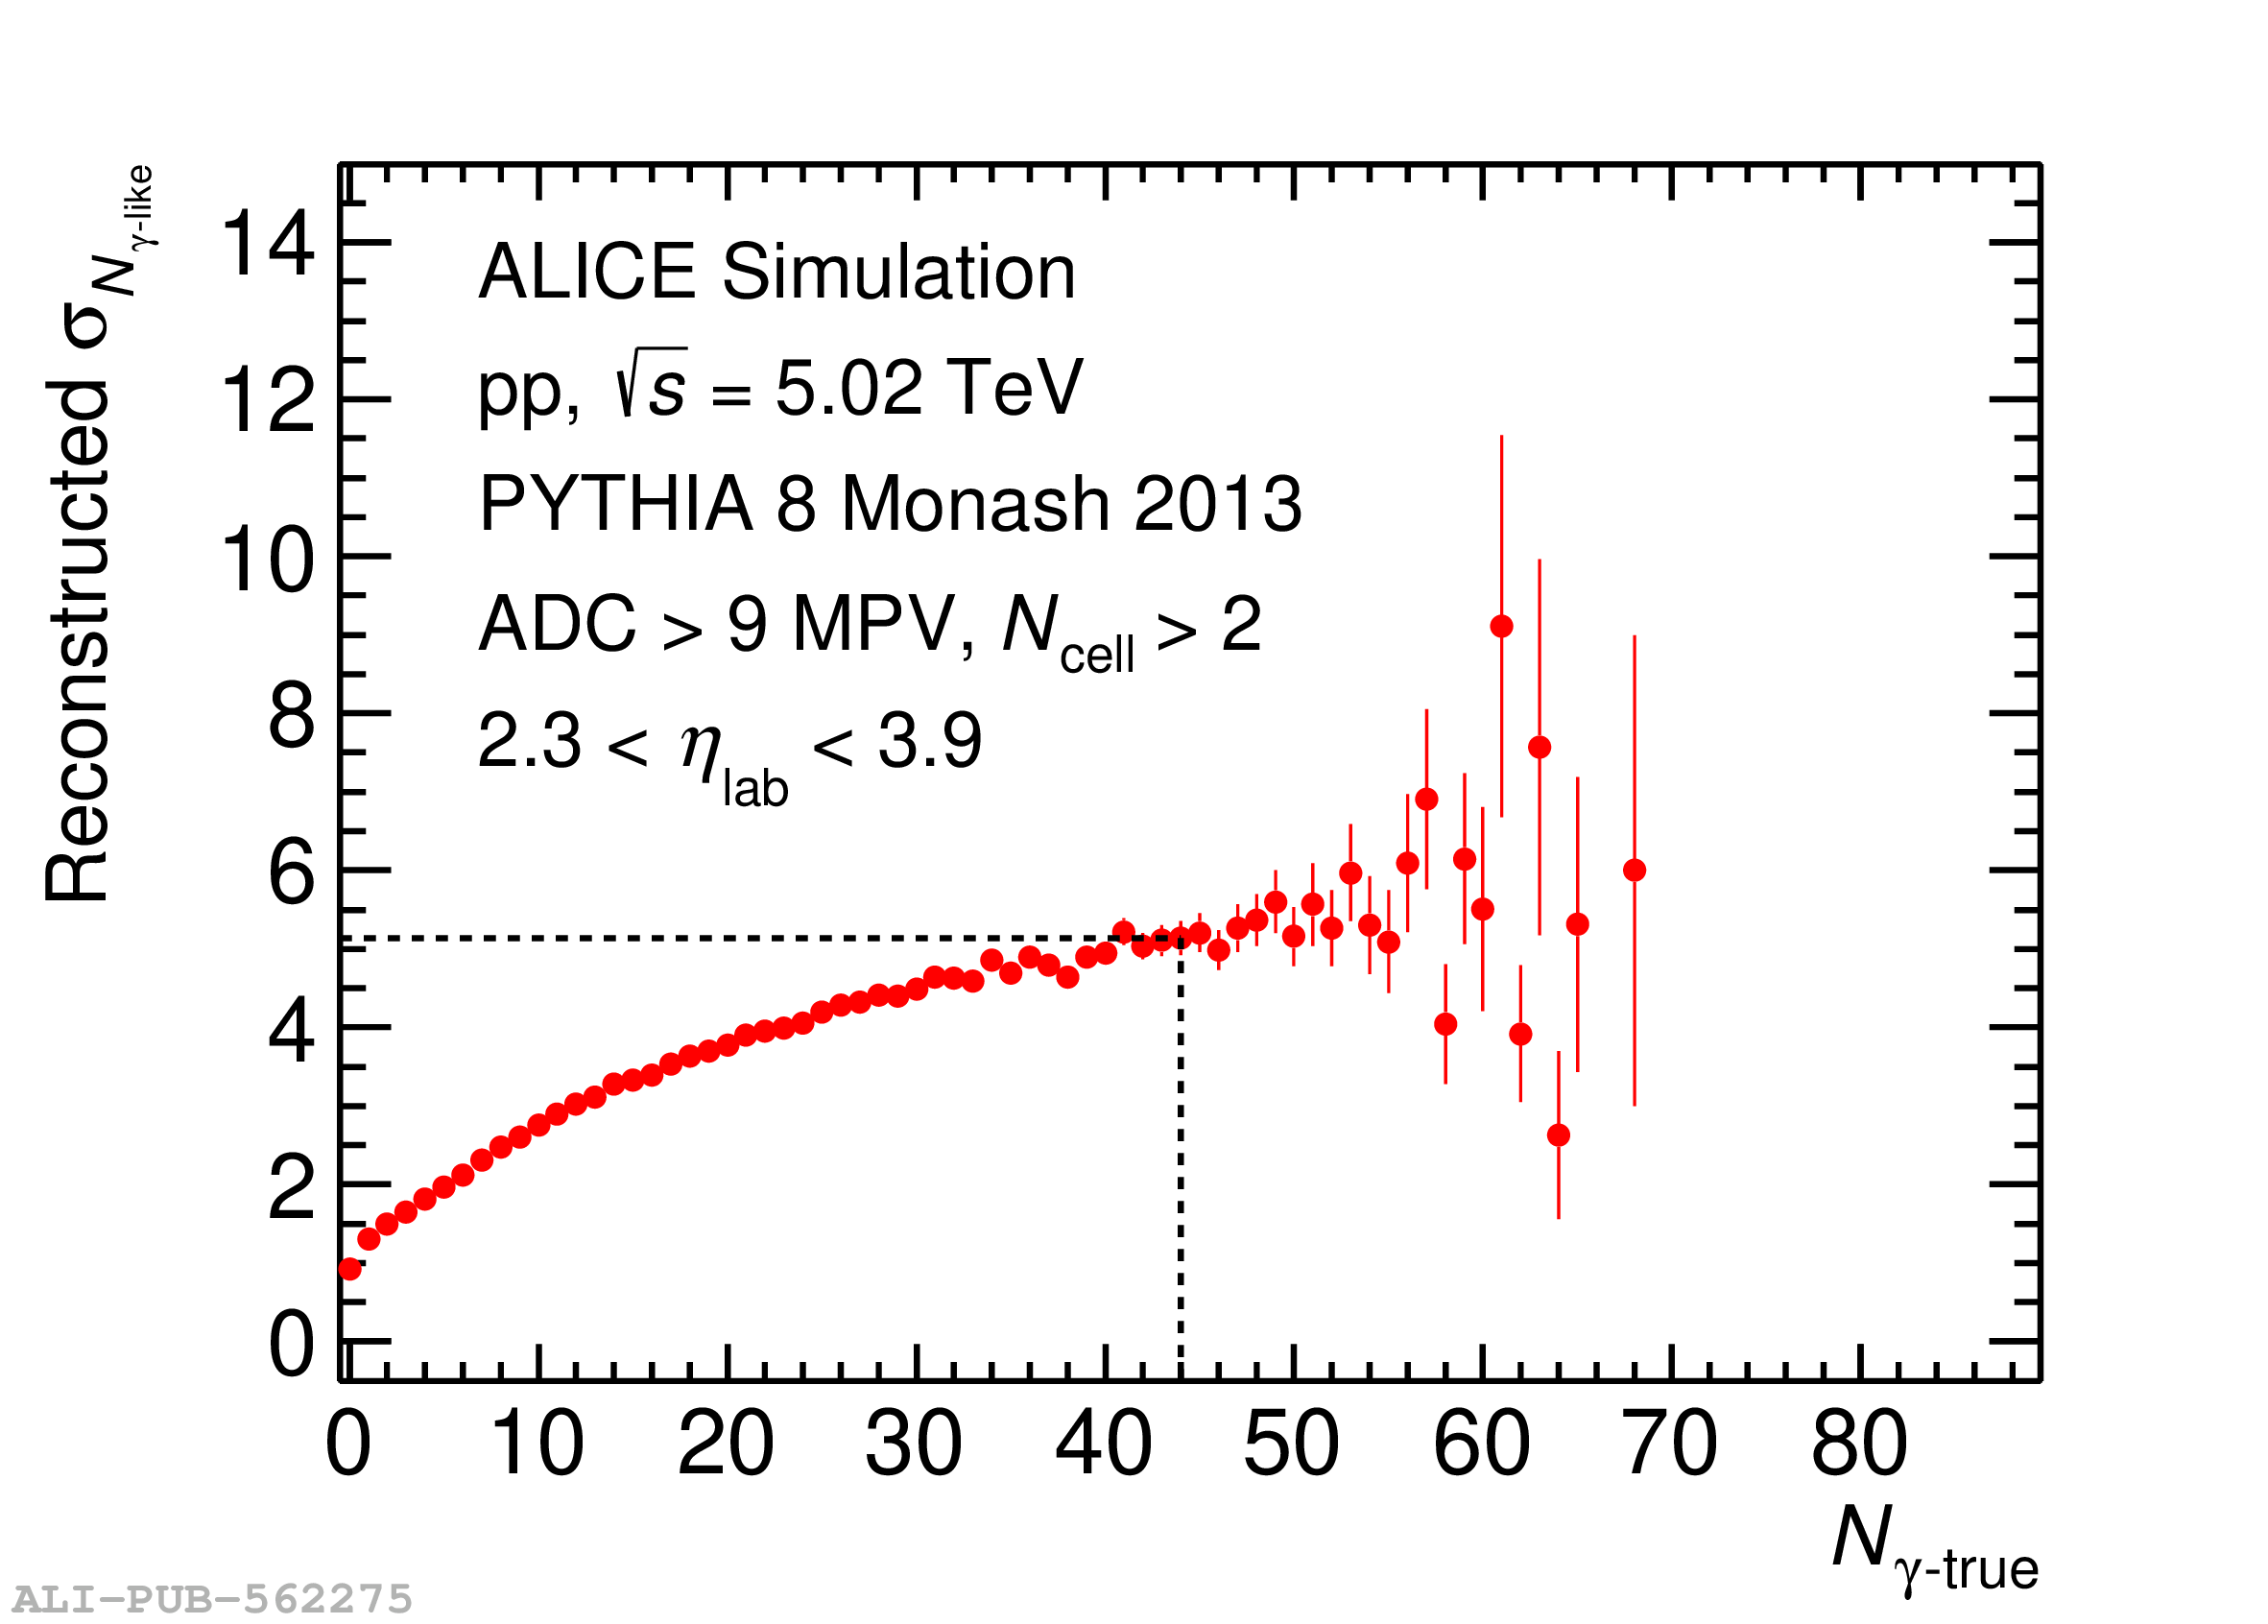 |
Figure A.2
The mean (a) and width (b) of the distribution of reconstructed photon multiplicity ($N_{\gamma\text-\rm like}$) as a function of true photon multiplicity ($N_{\gamma\text-\rm true}$) are presented for \pPb collisions at \fivenn. The dotted lines correspond to $N_{\gamma\text-\rm true}$ = 140 up to which the results are reported in the paper. | 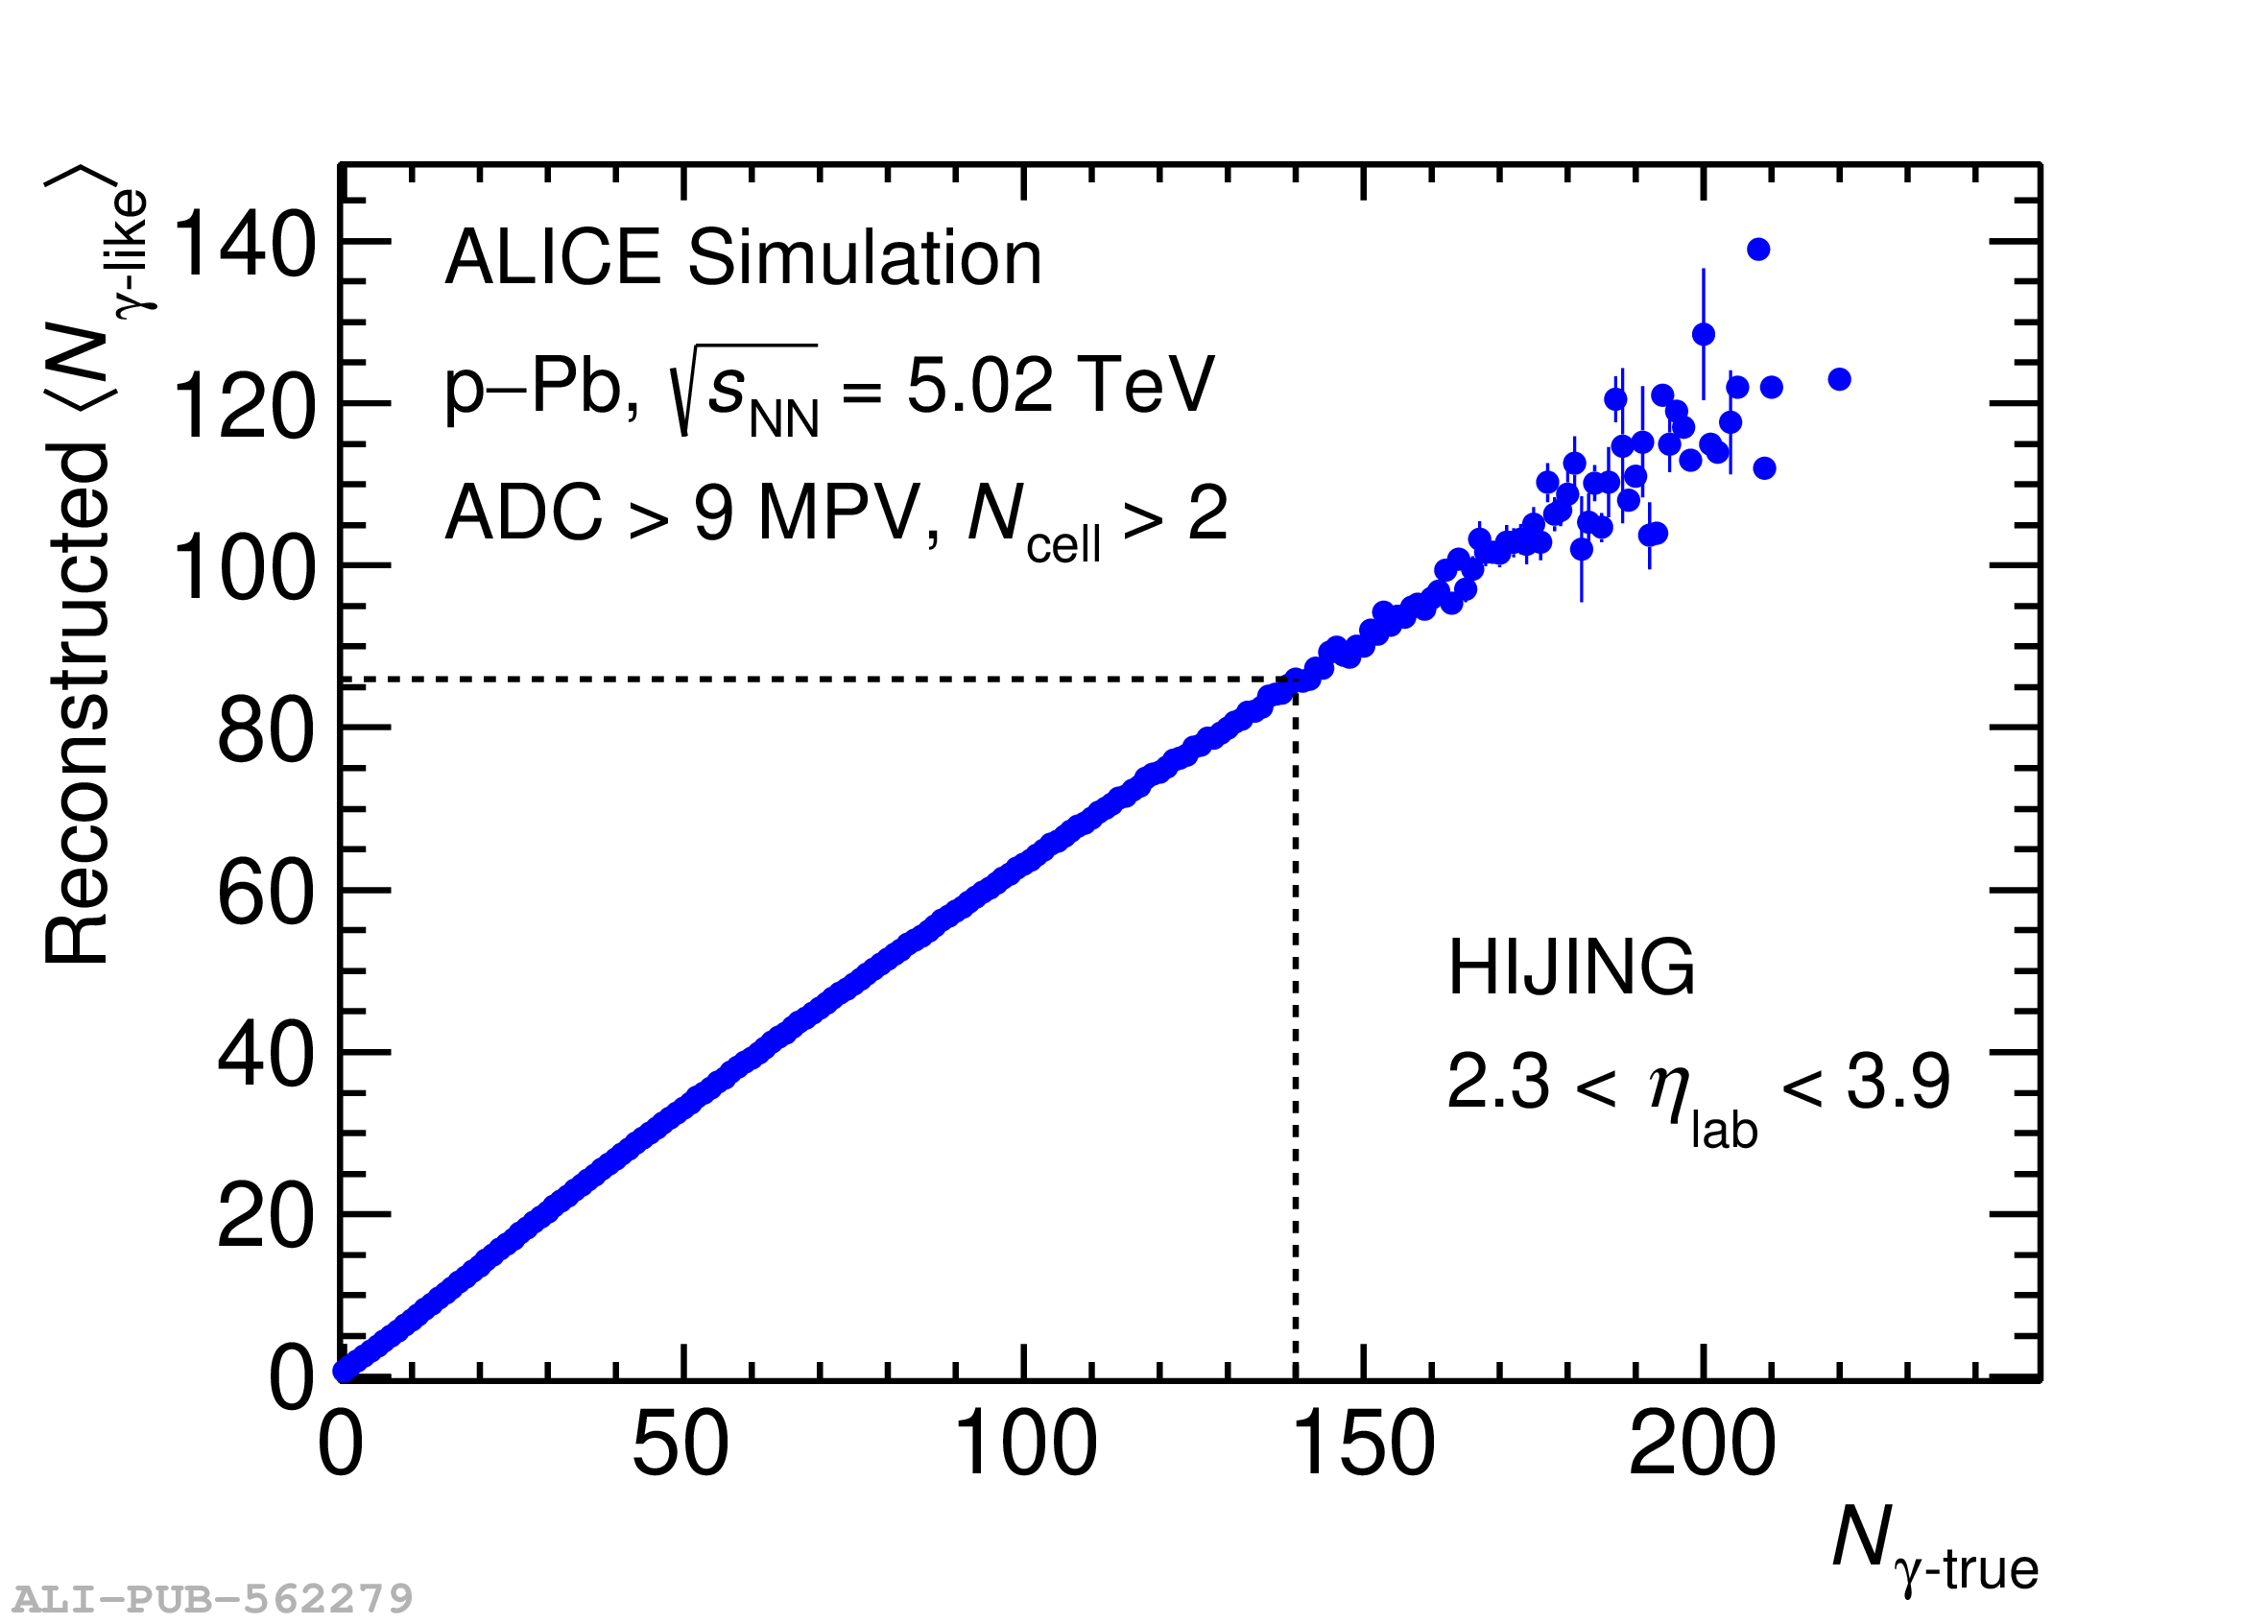  |