Left: exponential decay spectrum as a function of the proper decay length for $^{3}_{\Lambda}{\rm H}$, the blue points represent the measured yield, while the orange line represents the best fit to the measurement. Right: ${\rm B}_{\Lambda}$ measurement as a function of the proper decay length. Only statistical uncertainties are shown; see the text for a description of the determination of the systematic uncertainties. The fit probability computed with a Pearson test is reported. | 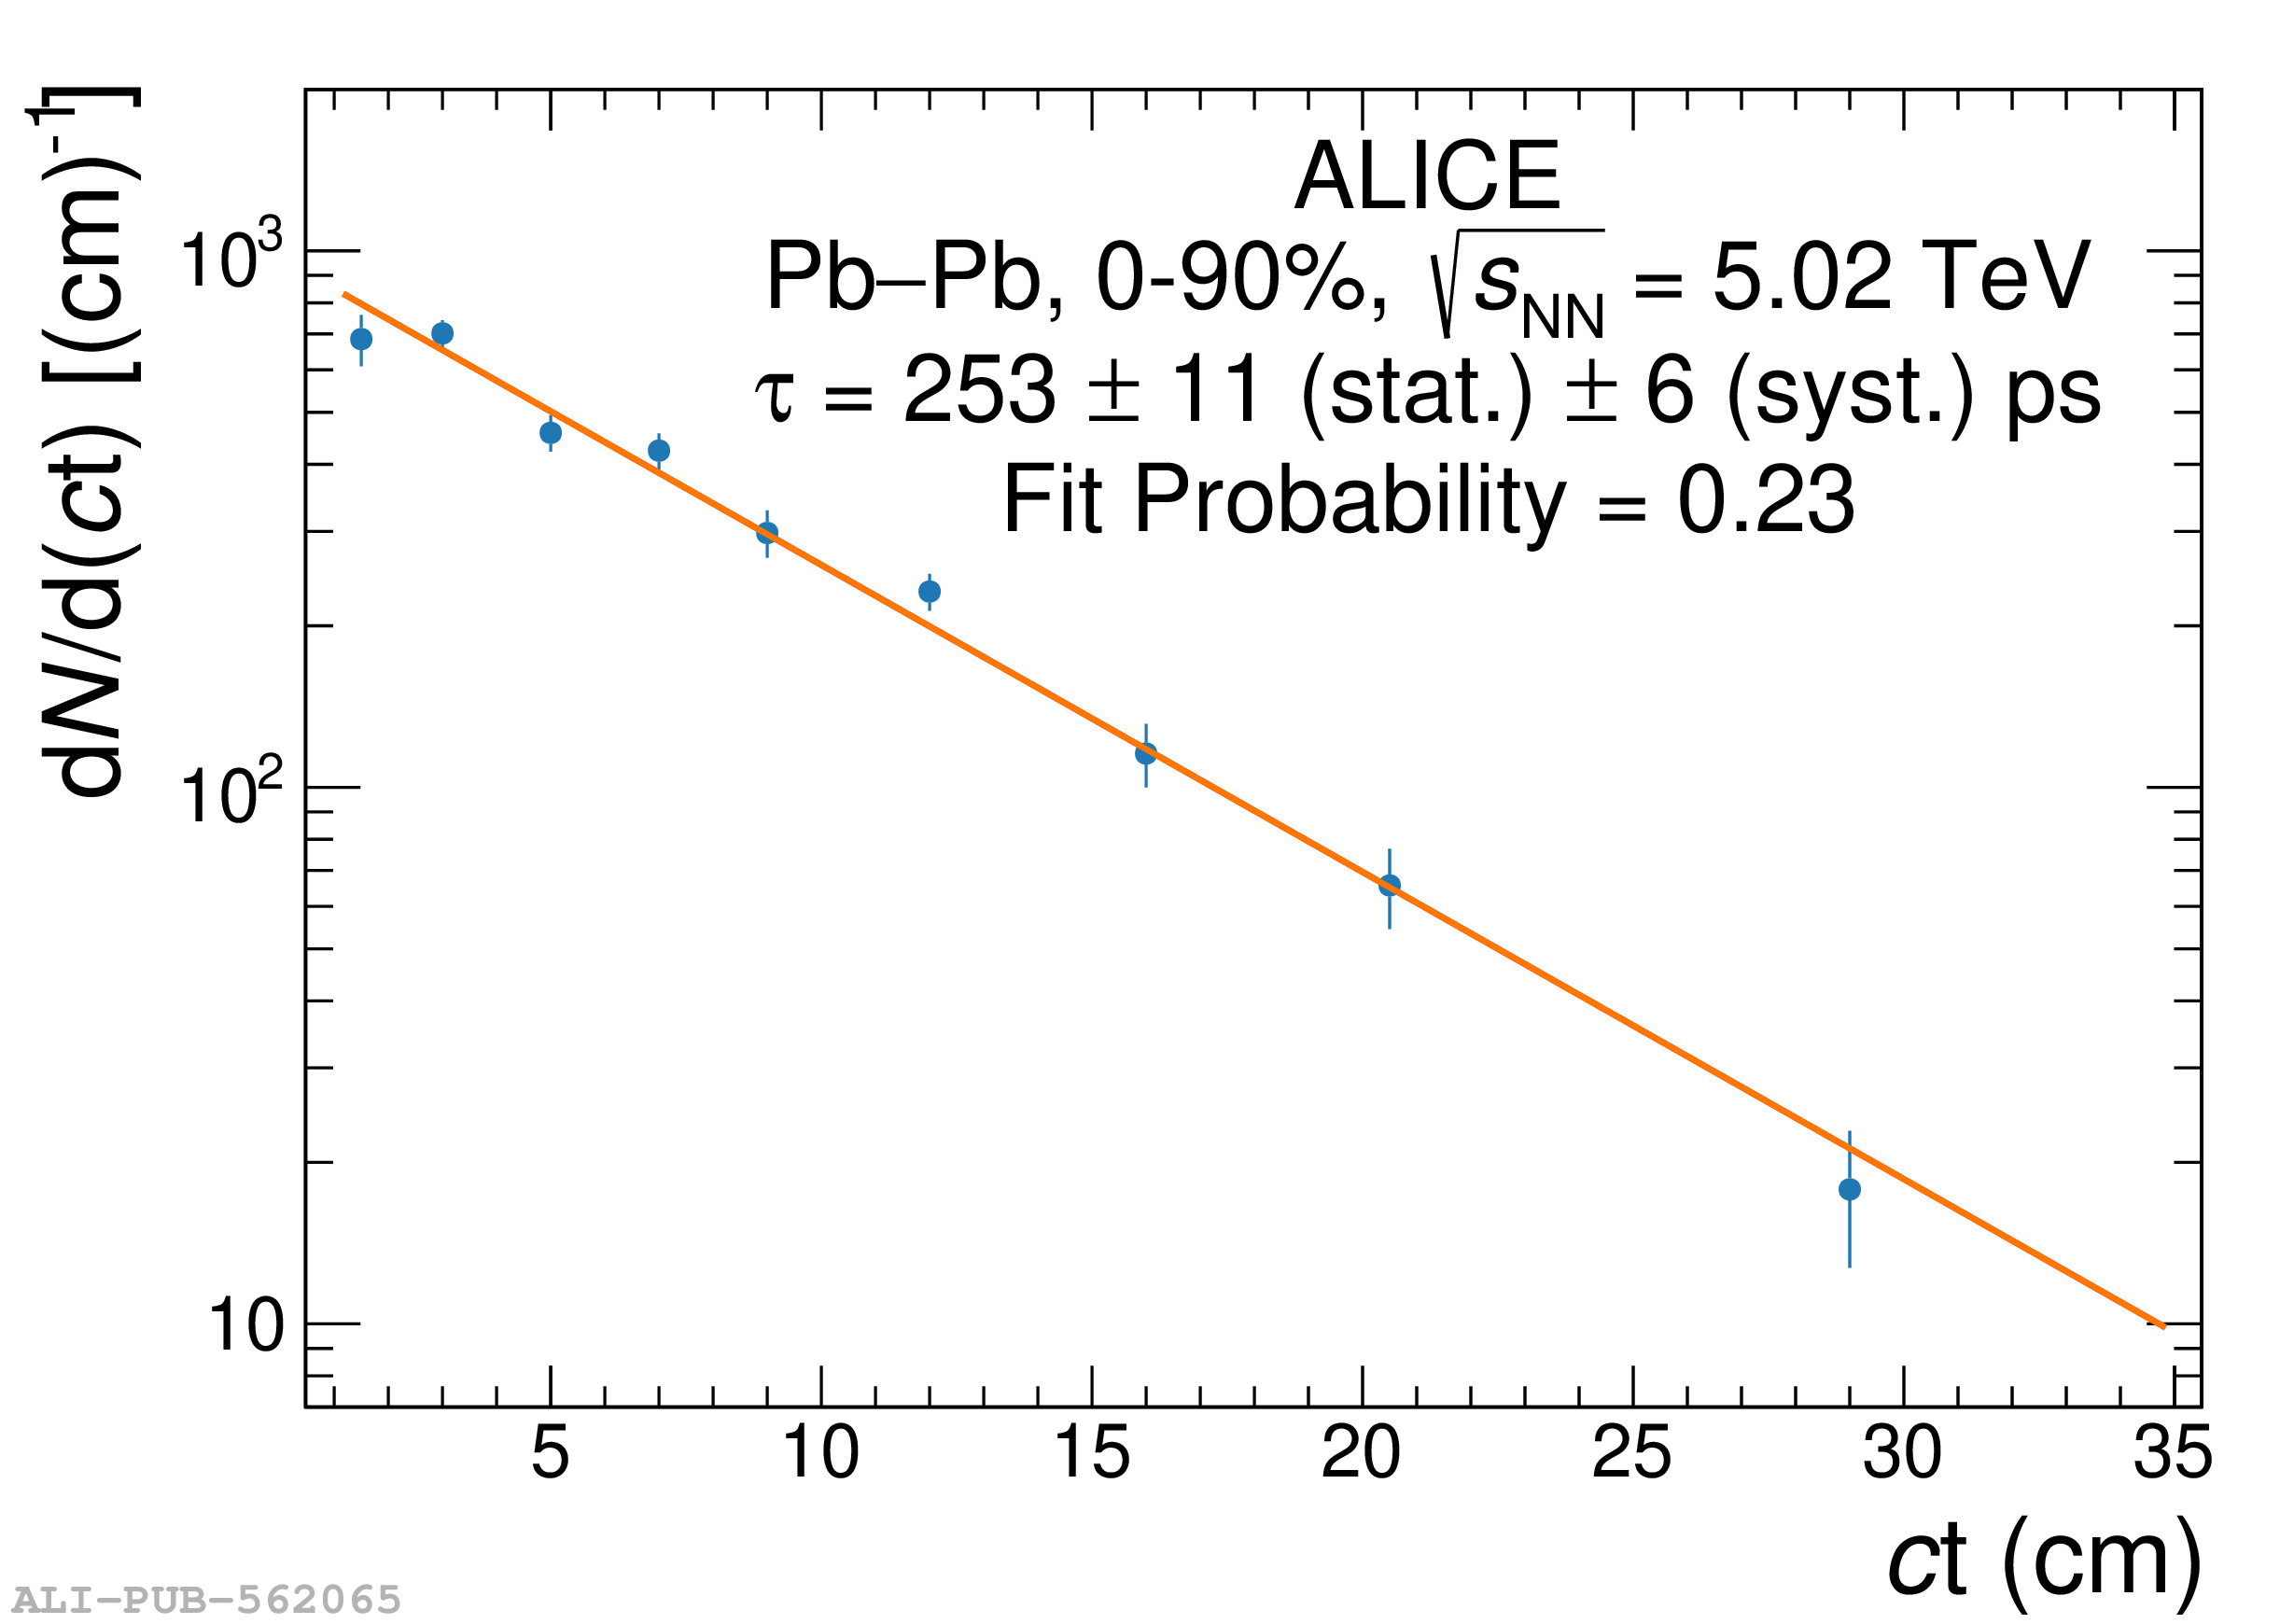 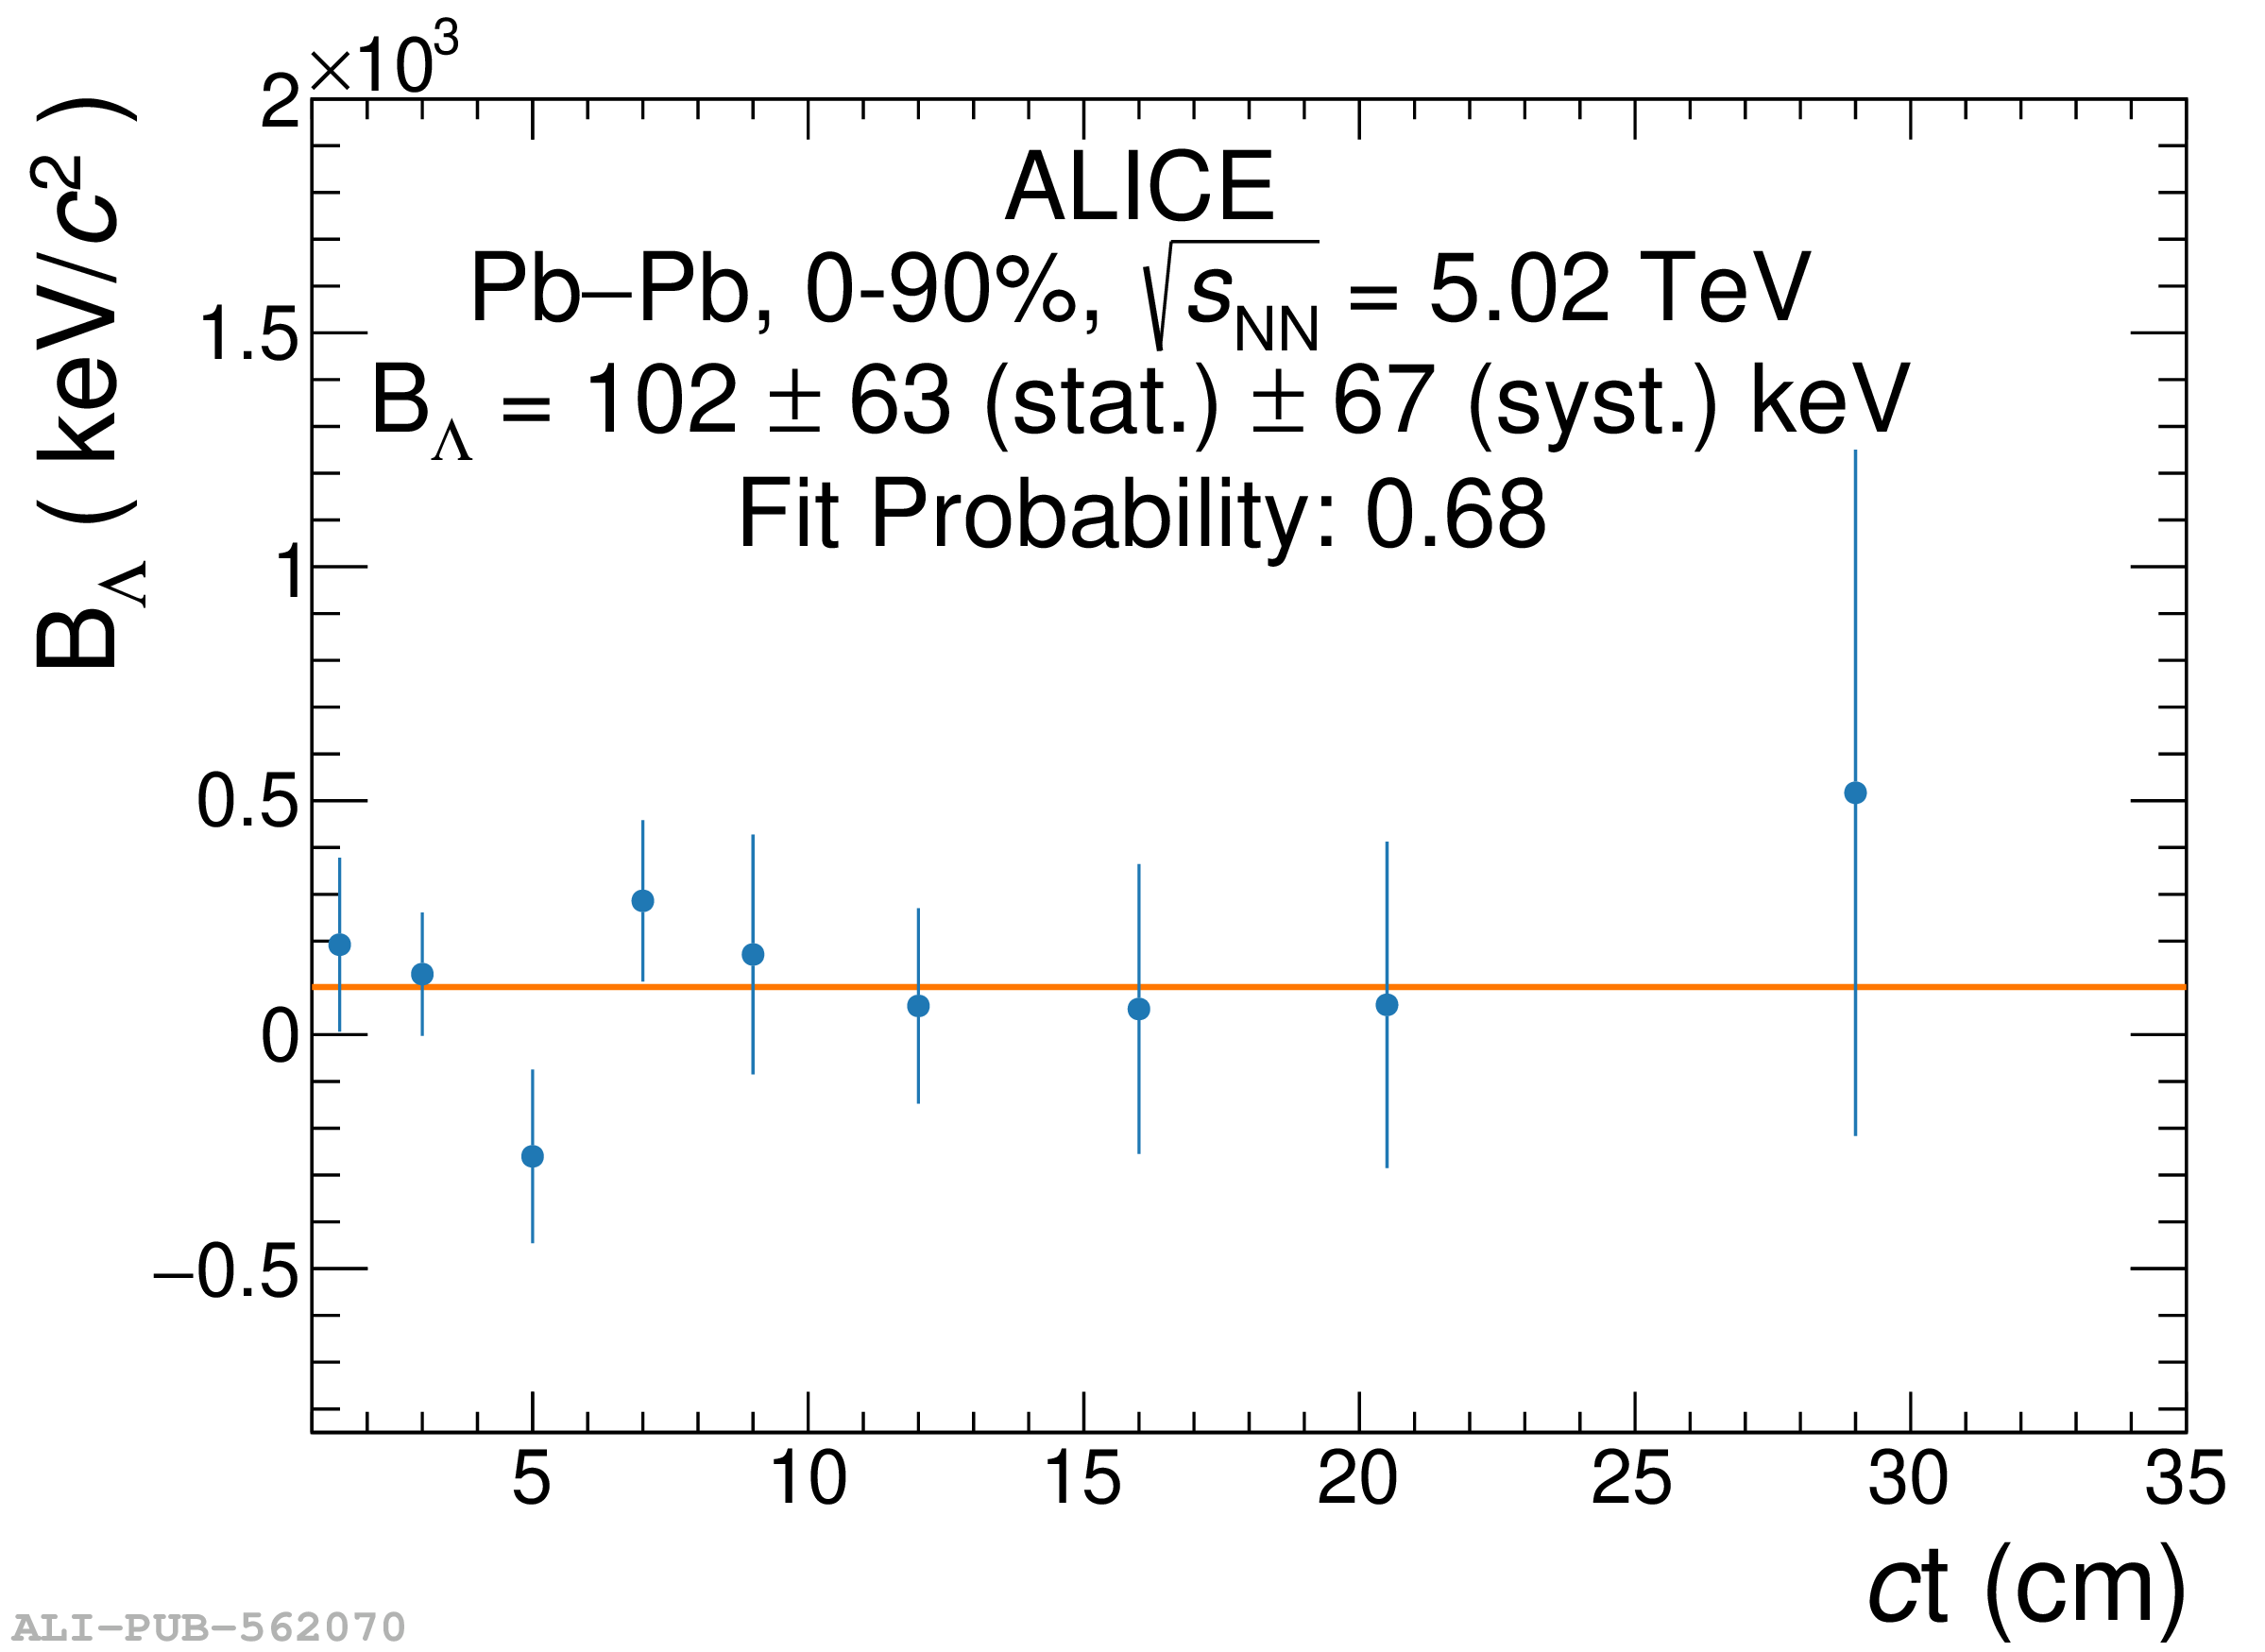 |