The most precise measurements to date of the $^{3}_{\Lambda}\mathrm H$ lifetime $\tau$ and $\Lambda$ separation energy ${\rm B}_{\Lambda}$ are obtained using the data sample of Pb-Pb collisions at $\sqrt{s_{\mathrm{NN}}}=$ 5.02 TeV collected by ALICE at the LHC. The $^{3}_{\Lambda}\mathrm H$ is reconstructed via its charged two-body mesonic decay channel ($^{3}_{\Lambda}\mathrm{H} \rightarrow$ $^3$He + $\pi^-$ and the charge-conjugate process). The measured values $\tau = [253 \pm 11 \text{ (stat.)} \pm 6 \text{ (syst.)}]$ ps and ${\rm B}_{\Lambda}= [102 \pm 63 \text{ (stat.)} \pm 67 \text{ (syst.)}]$ keV are compatible with predictions from effective field theories and confirm that the $^{3}_{\Lambda}\mathrm H$ structure is consistent with a weakly-bound system.
Phys. Rev. Lett. 131 (2023) 102302
HEP Data
e-Print: arXiv:2209.07360 | PDF | inSPIRE
CERN-EP-2022-188
Figure group
Figure 1
Left: exponential decay spectrum as a function of the proper decay length for $^{3}_{\Lambda}{\rm H}$, the blue points represent the measured yield, while the orange line represents the best fit to the measurement. Right: ${\rm B}_{\Lambda}$ measurement as a function of the proper decay length. Only statistical uncertainties are shown; see the text for a description of the determination of the systematic uncertainties. The fit probability computed with a Pearson test is reported. | 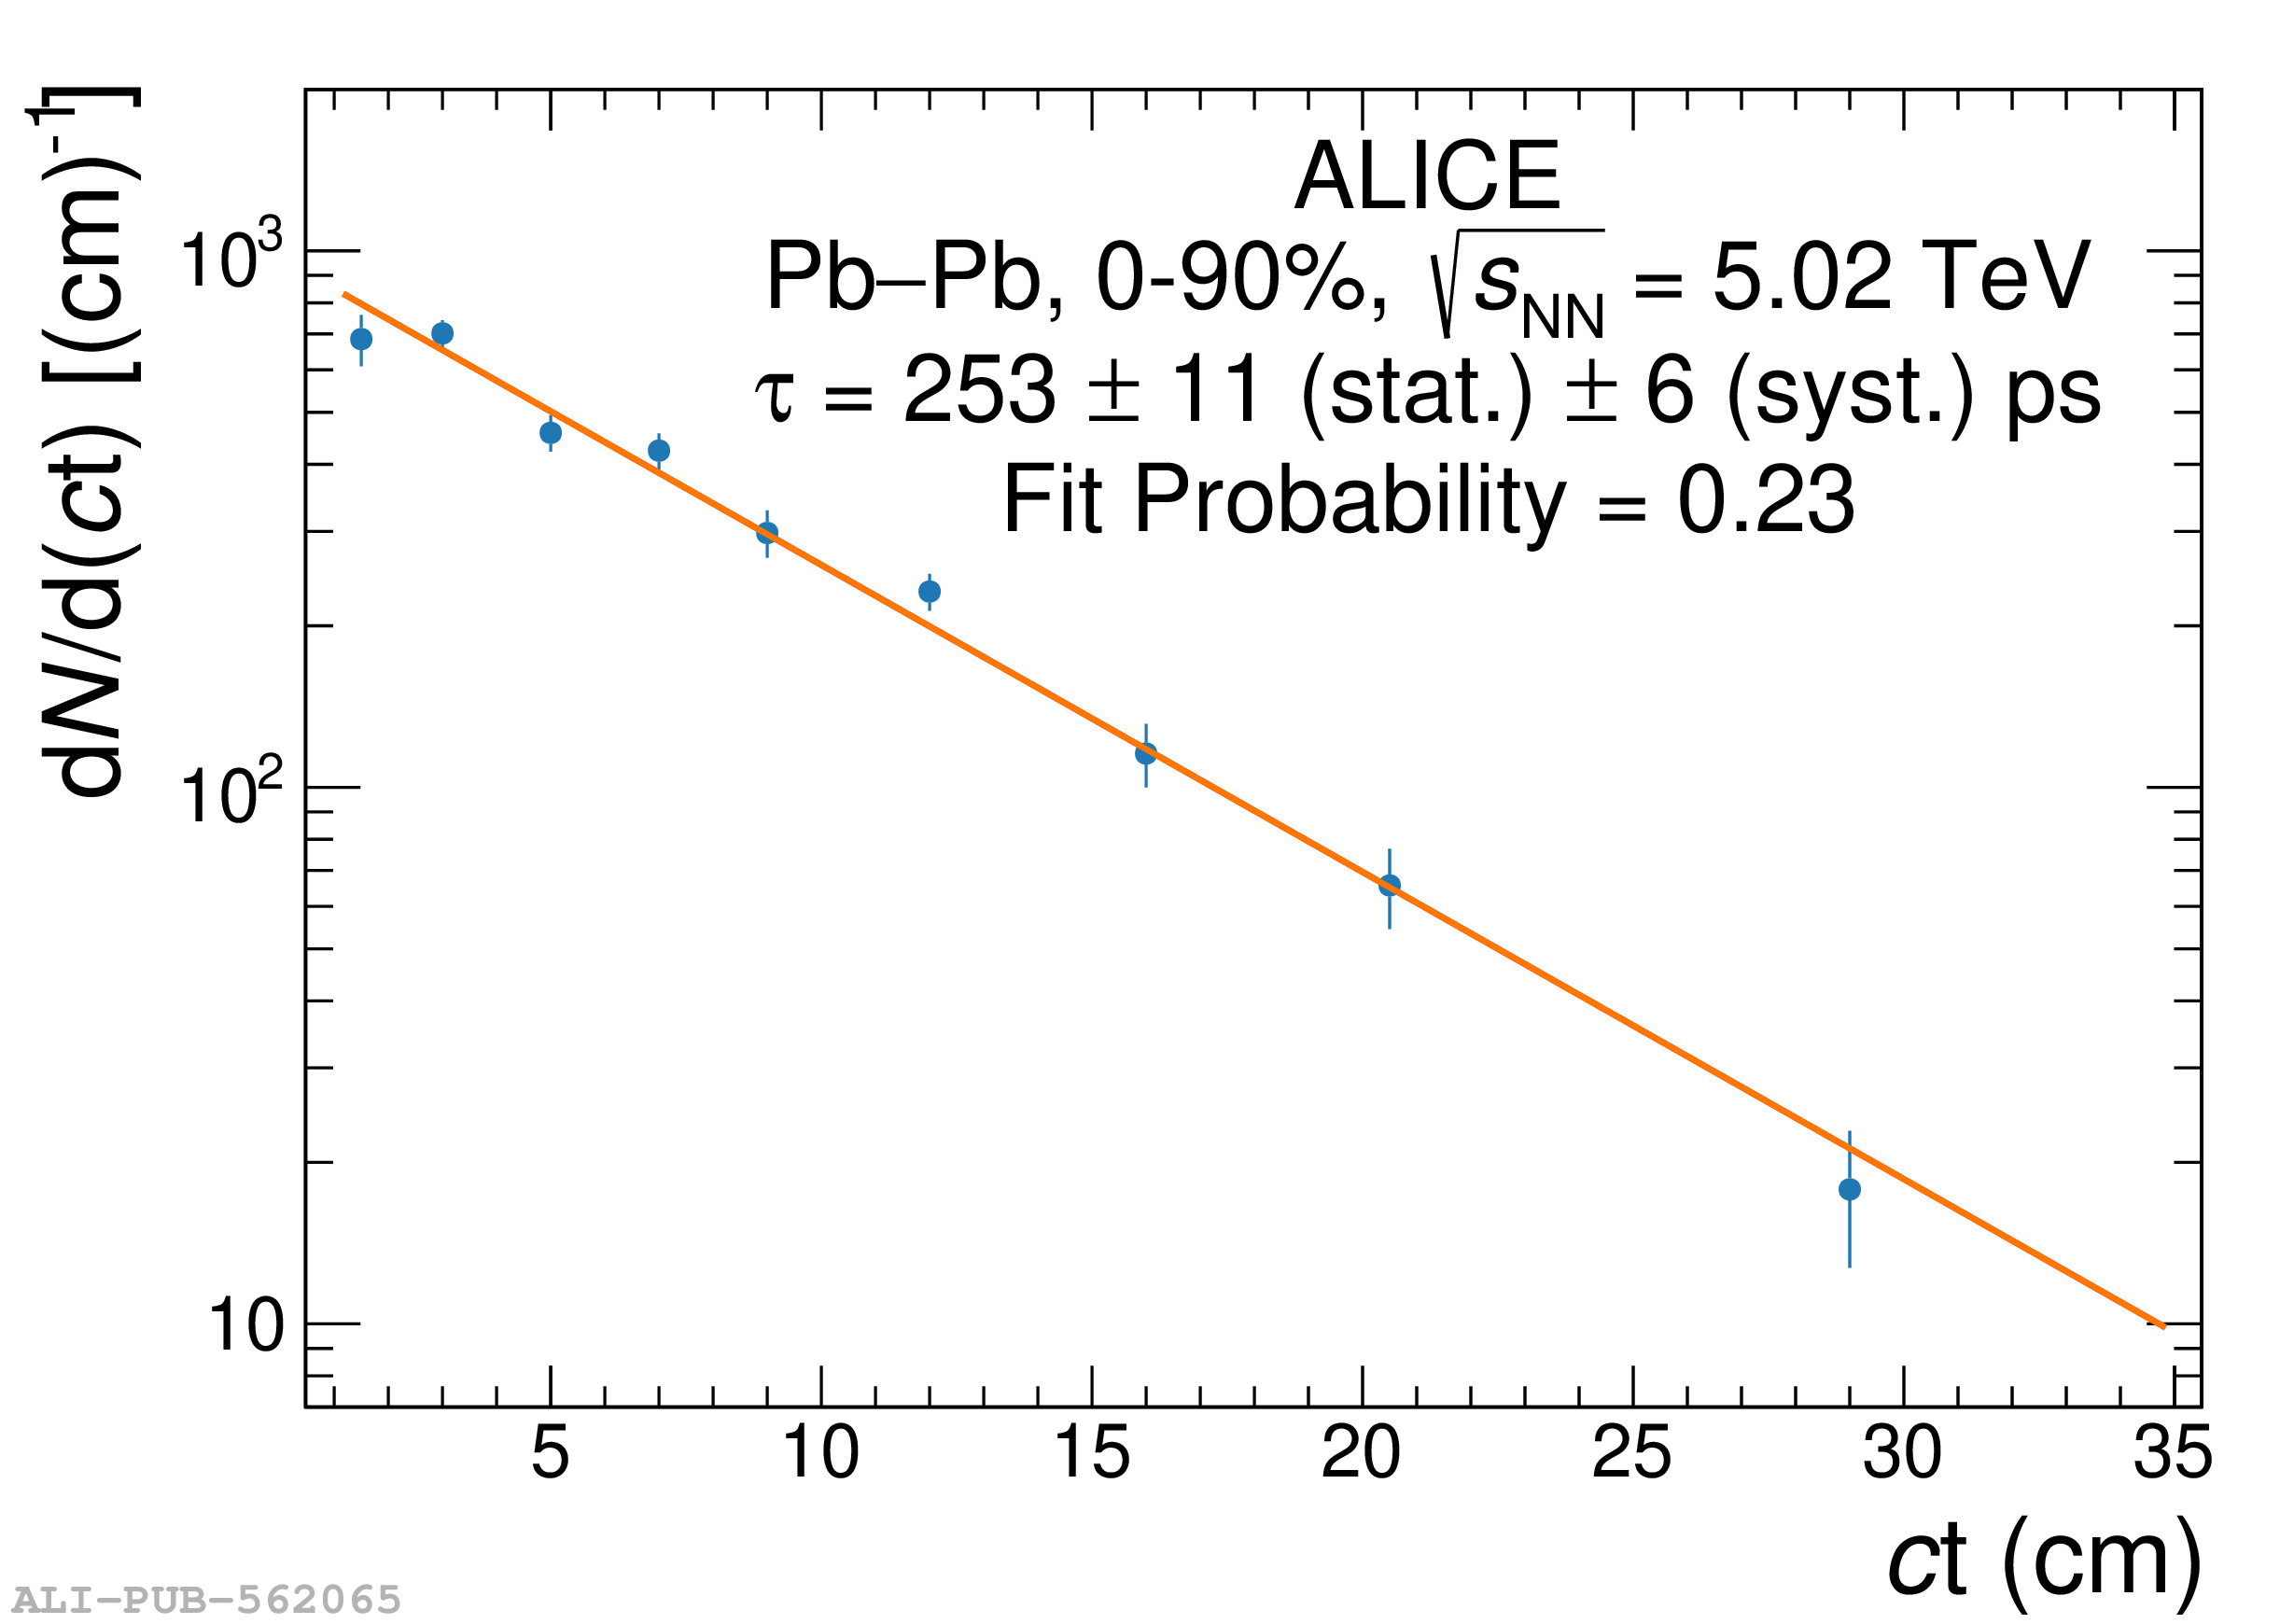 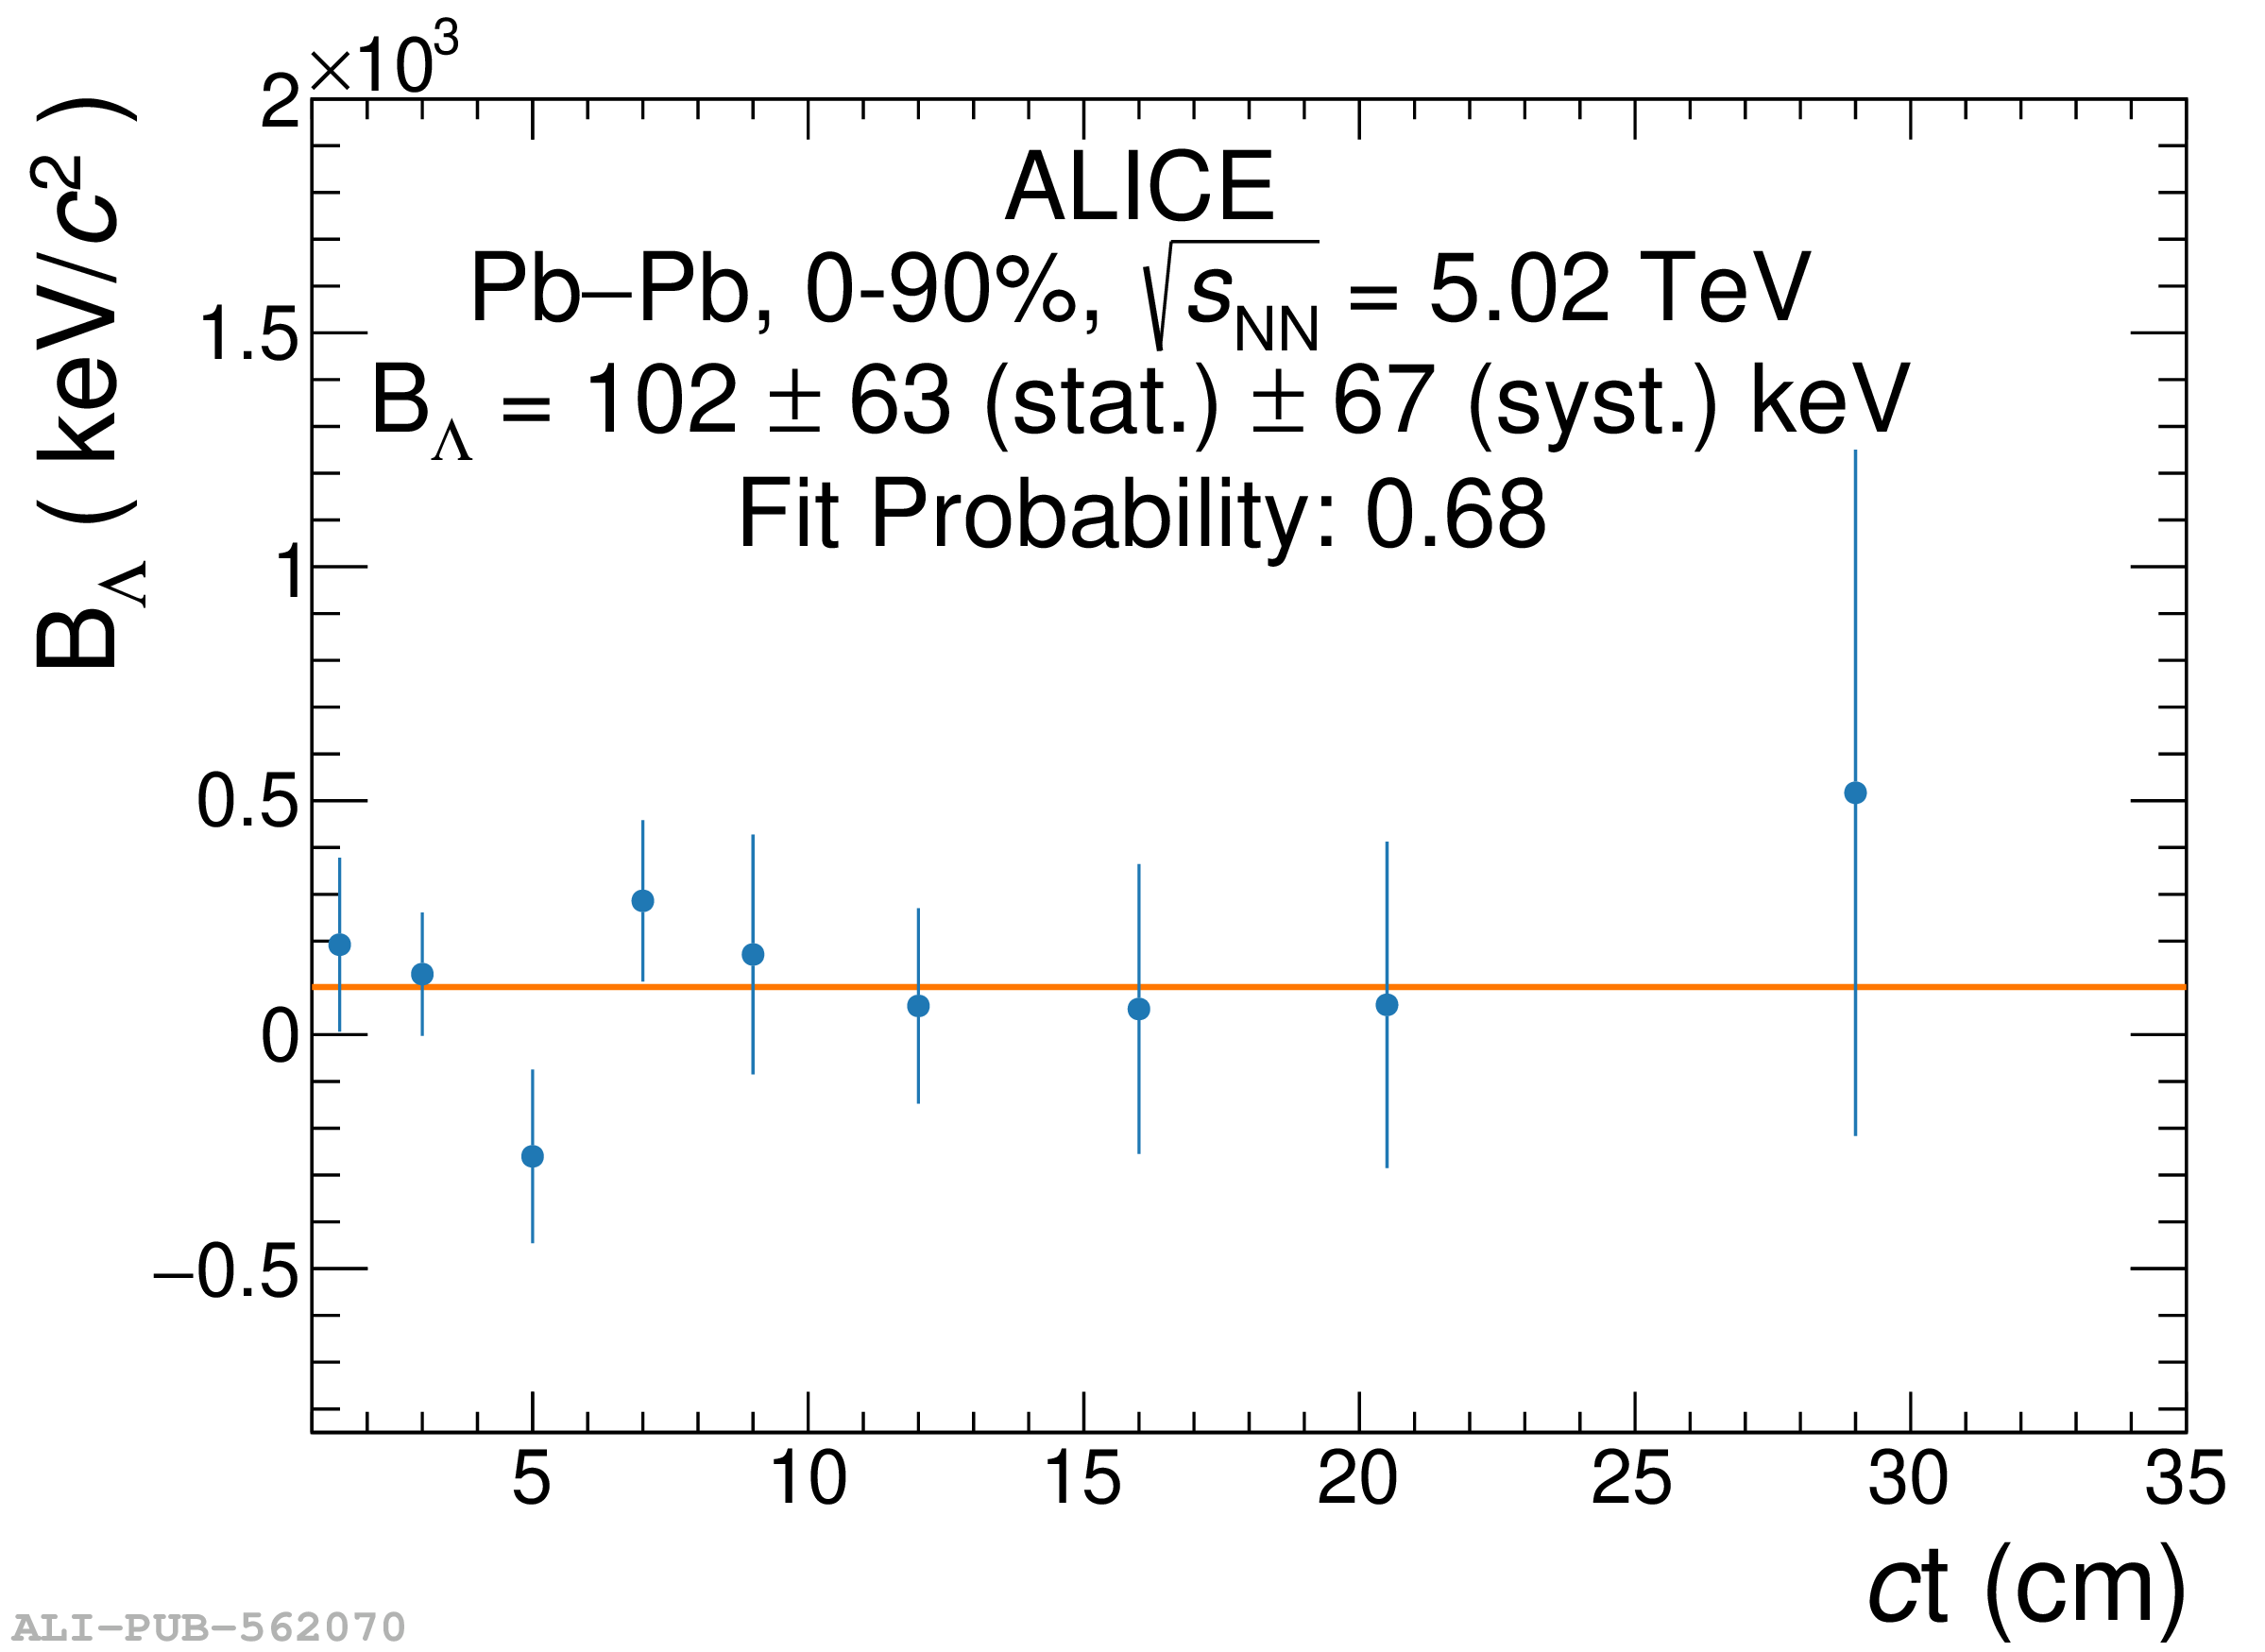 |
Figure 2
The $^{3}_{\Lambda}{\rm H}$ lifetime relative to the free $\Lambda$ lifetime as a function of the ${\rm B}_{\Lambda}$ for pionless EFT (green), $\chi$EFT (light blue), and the original $\pi$ exchange calculations (blue). The red point represents the measurement presented in this Letter with the statistical and total uncertainties depicted with lines and an ellipse, respectively. | 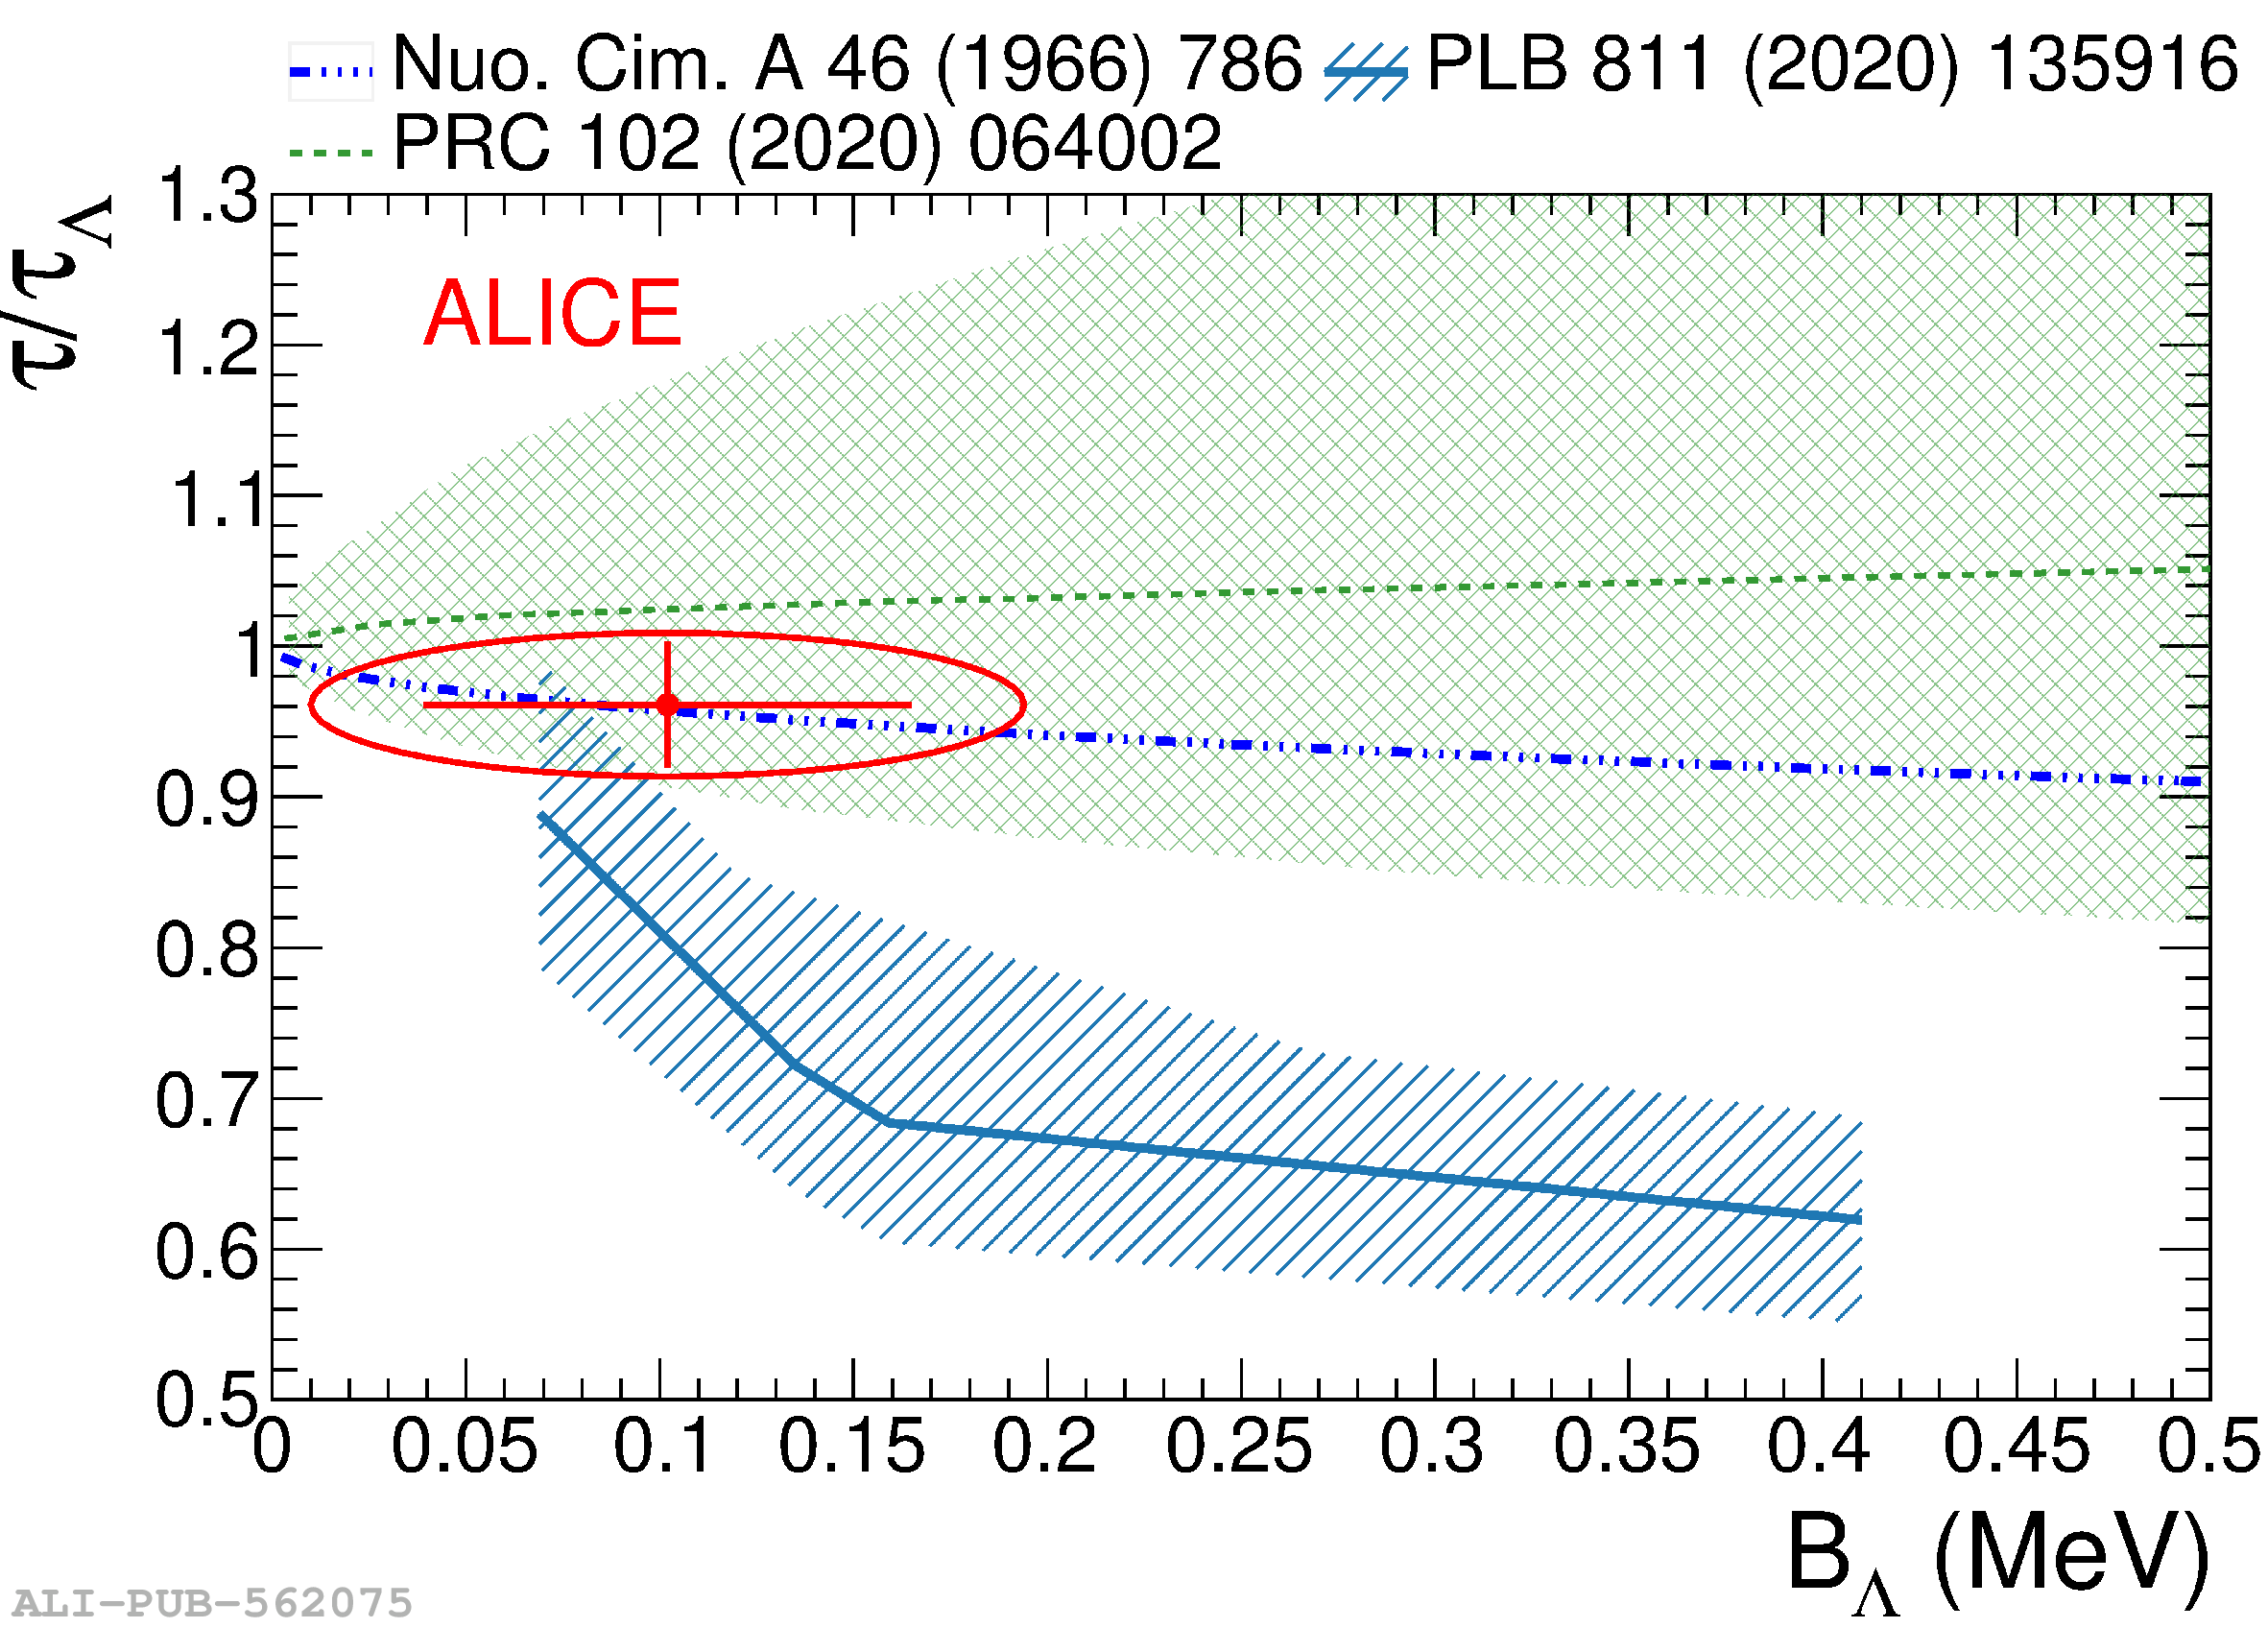 |
Figure 3
Collection of the $^{3}_{\Lambda}{\rm H}$ lifetime (left) and ${\rm B}_{\Lambda}$ (right) measurements obtained with different experimental techniques. The horizontal lines and boxes are the statistical and systematic uncertainties, respectively. The dashed and dash-dotted lines are the corresponding theoretical predictions. Two predictions are reported in: prediction A assumes ${\rm B}_{\Lambda} = 130$ keV, while prediction B assumes ${\rm B}_{\Lambda} = 69$ keV. |  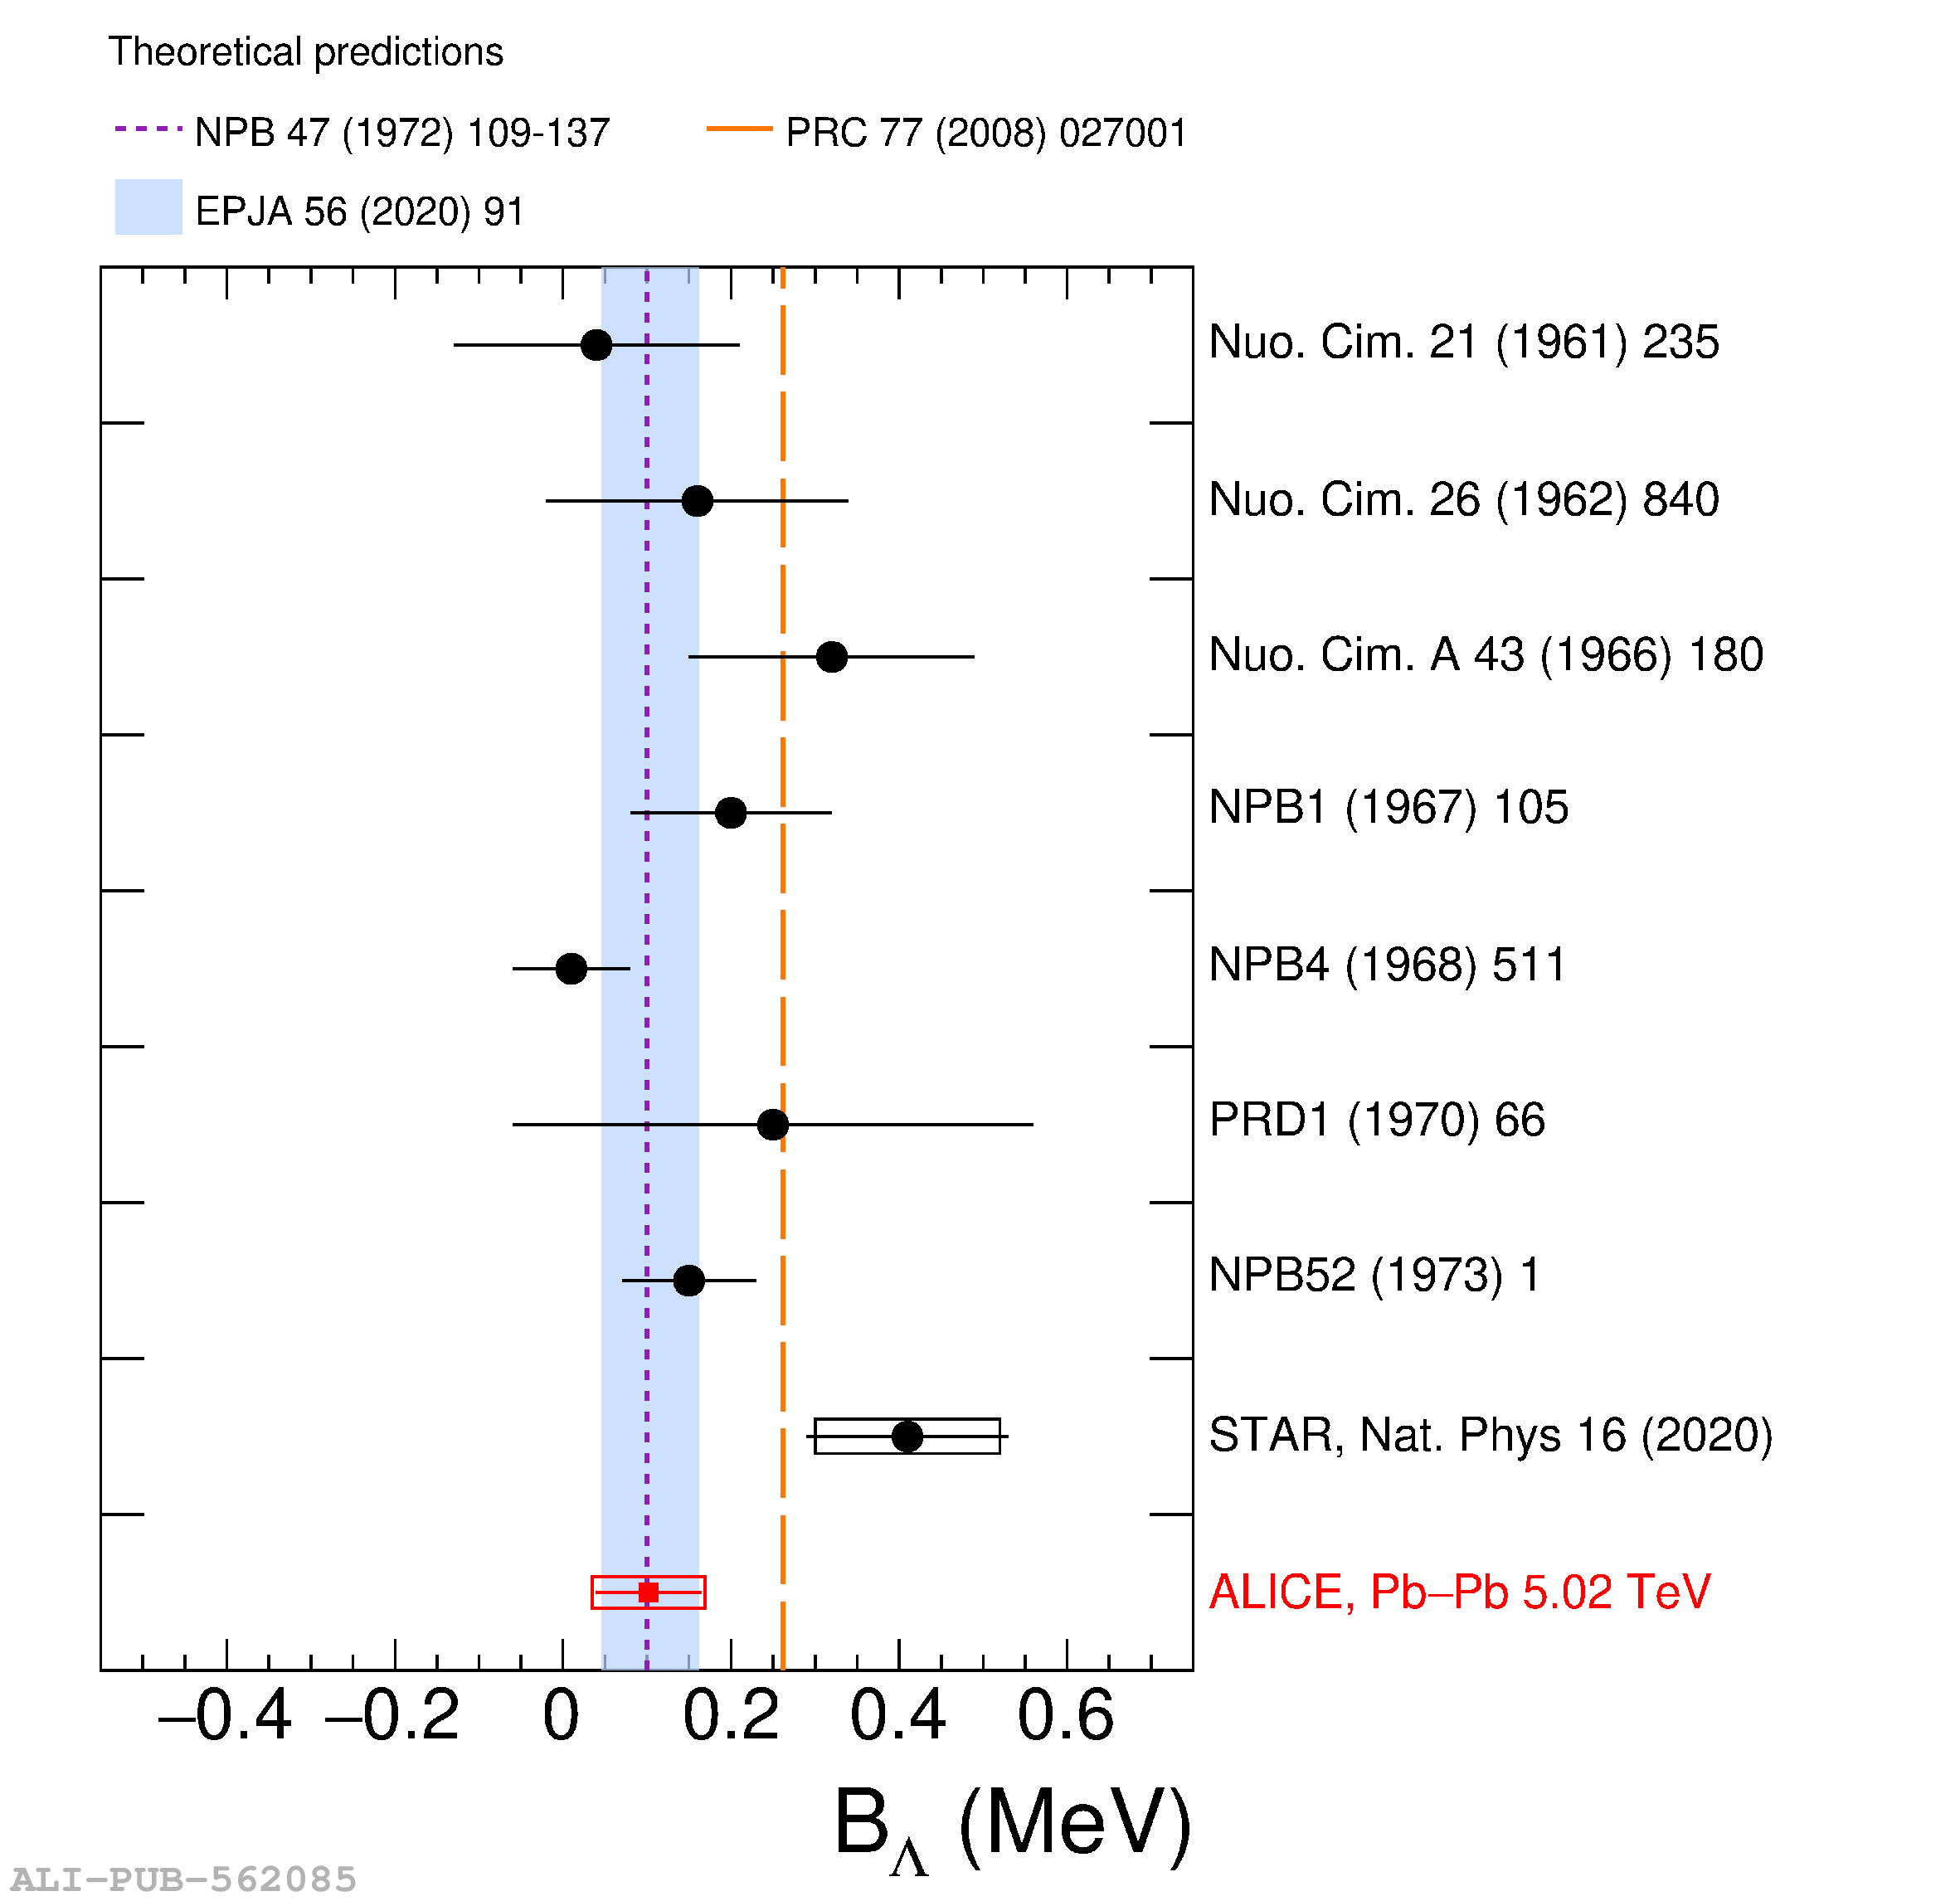 |
Figure A.1
Distribution of the invariant mass of the $^{3}_{\Lambda}{\rm H}$ and $^{3}_{\bar{\Lambda}}\bar{{\rm H}}$ candidates in nine $ct$ intervals from 1 to 35 cm. The statistical uncertainties of the bin counts are represented with vertical lines. The distribution is fitted with a two-component model; the blue line depicts the overall fit, and the orange dashed line displays the background component. | 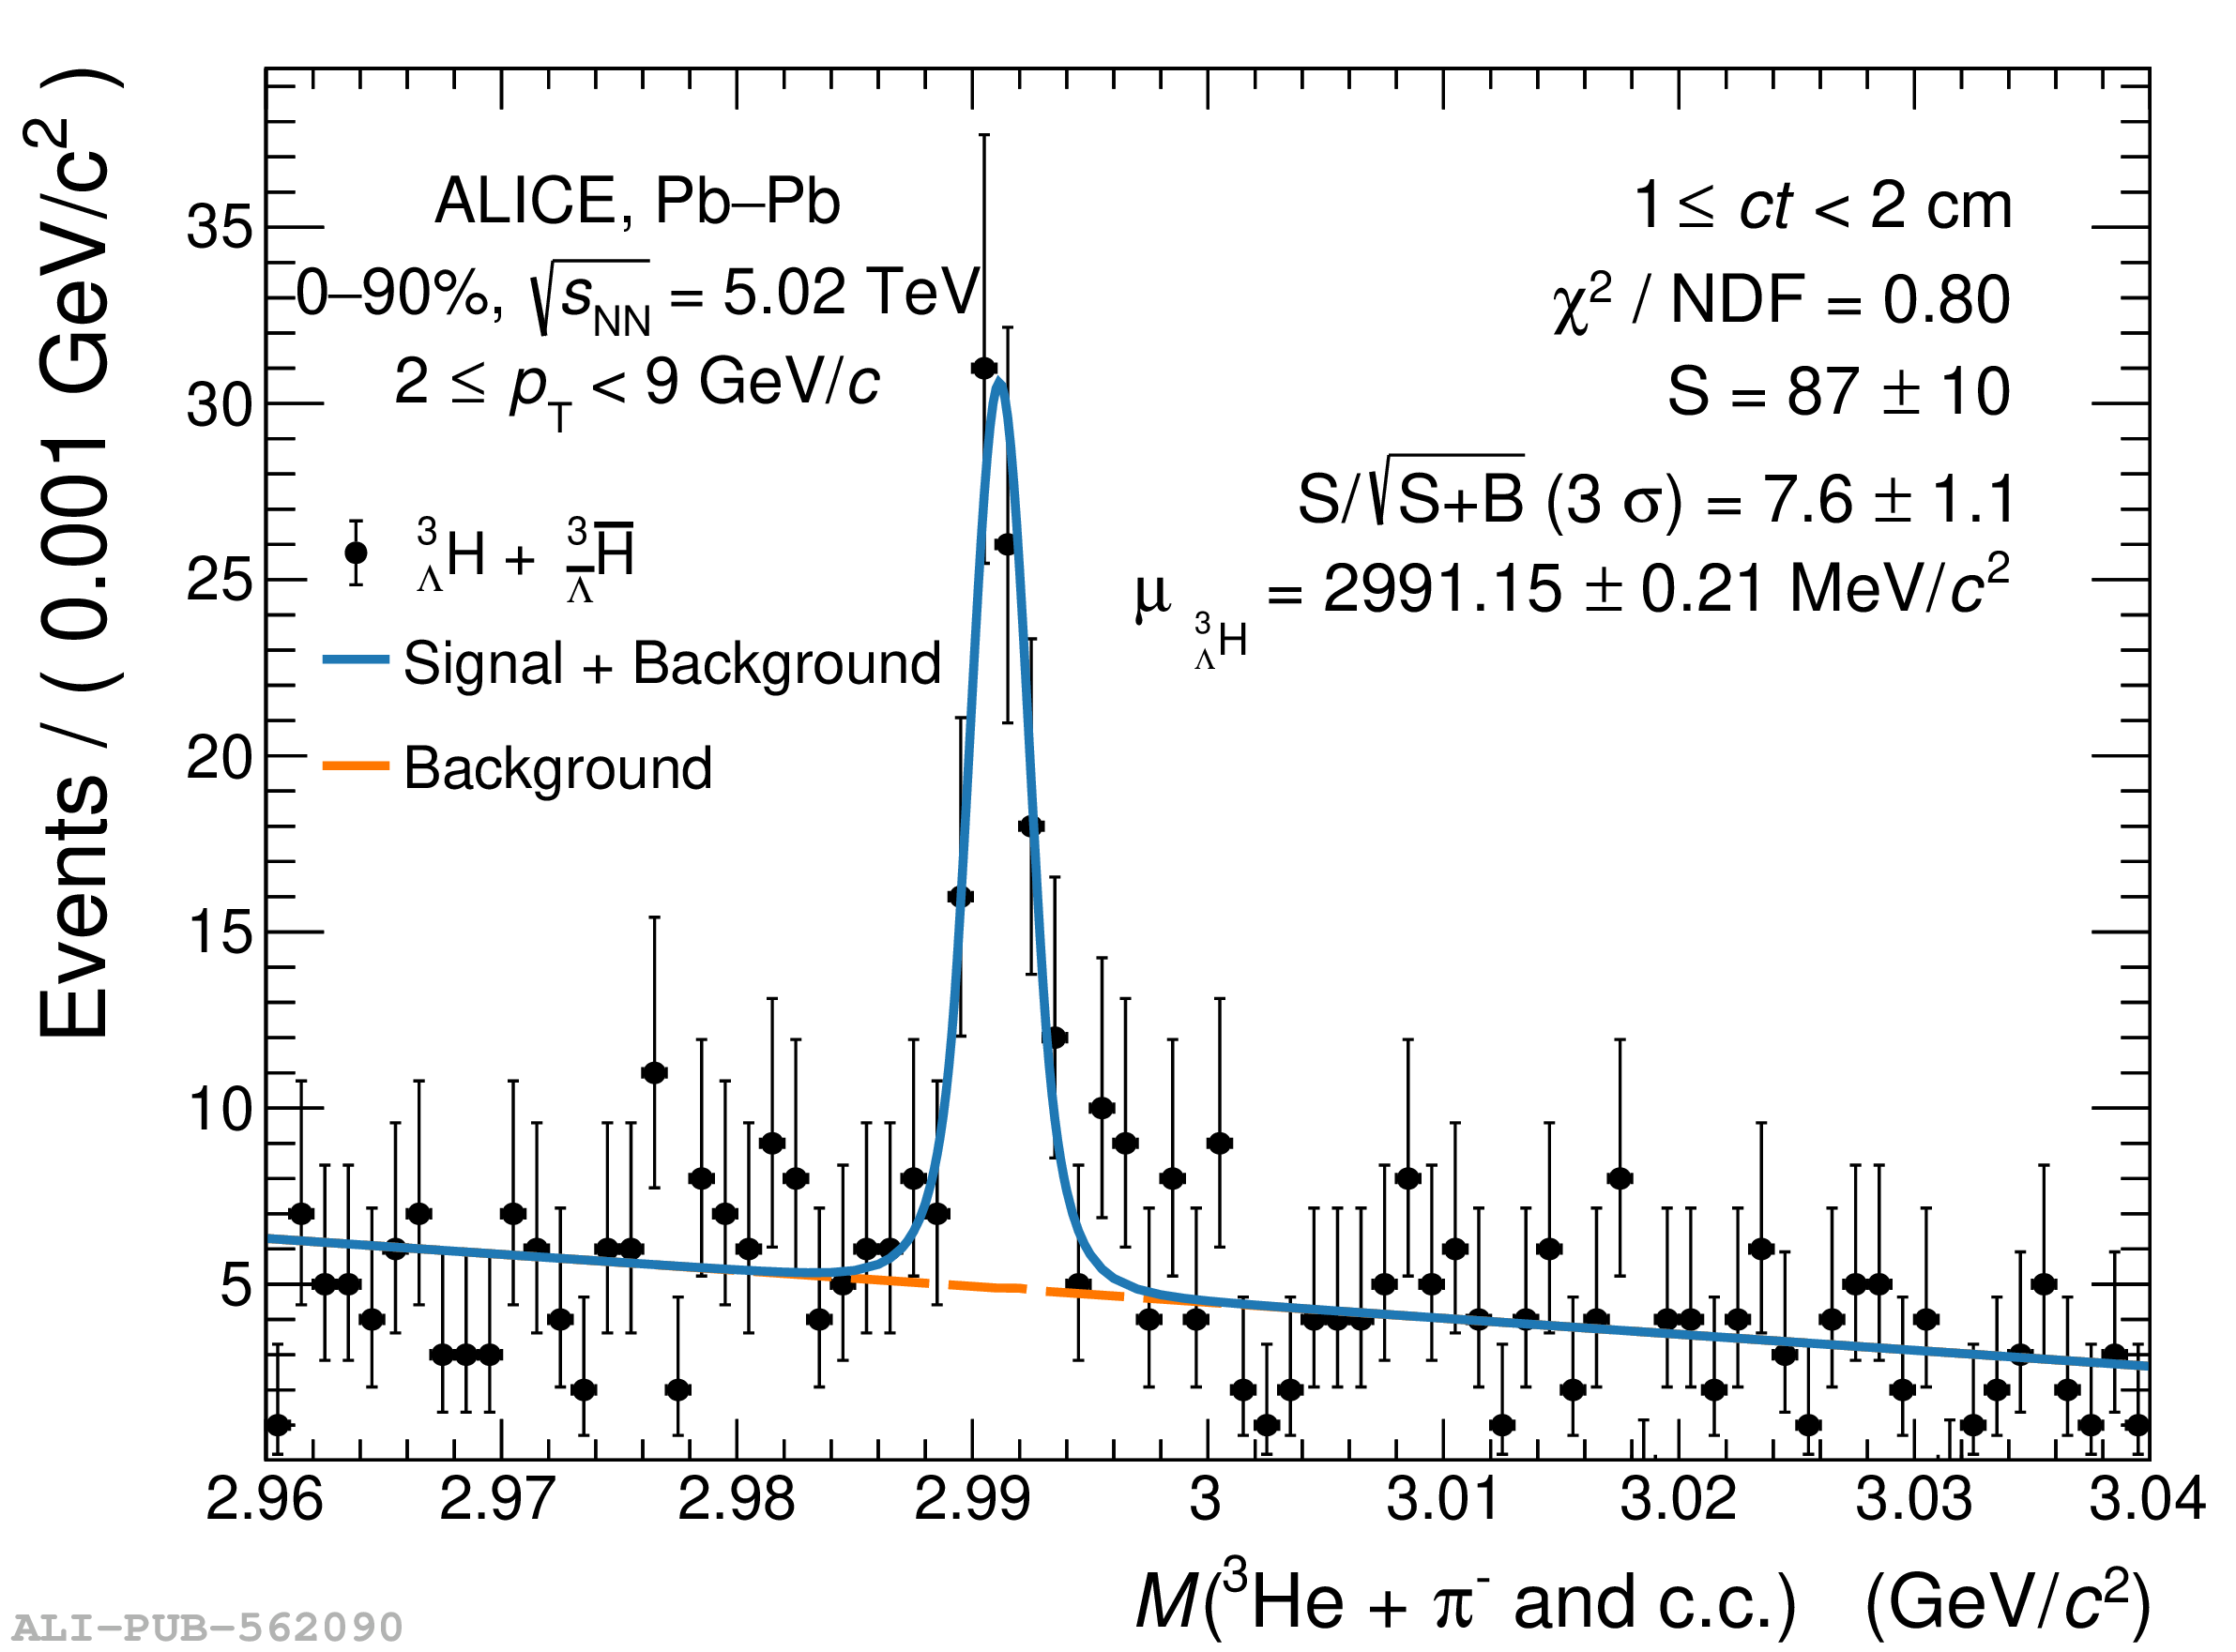 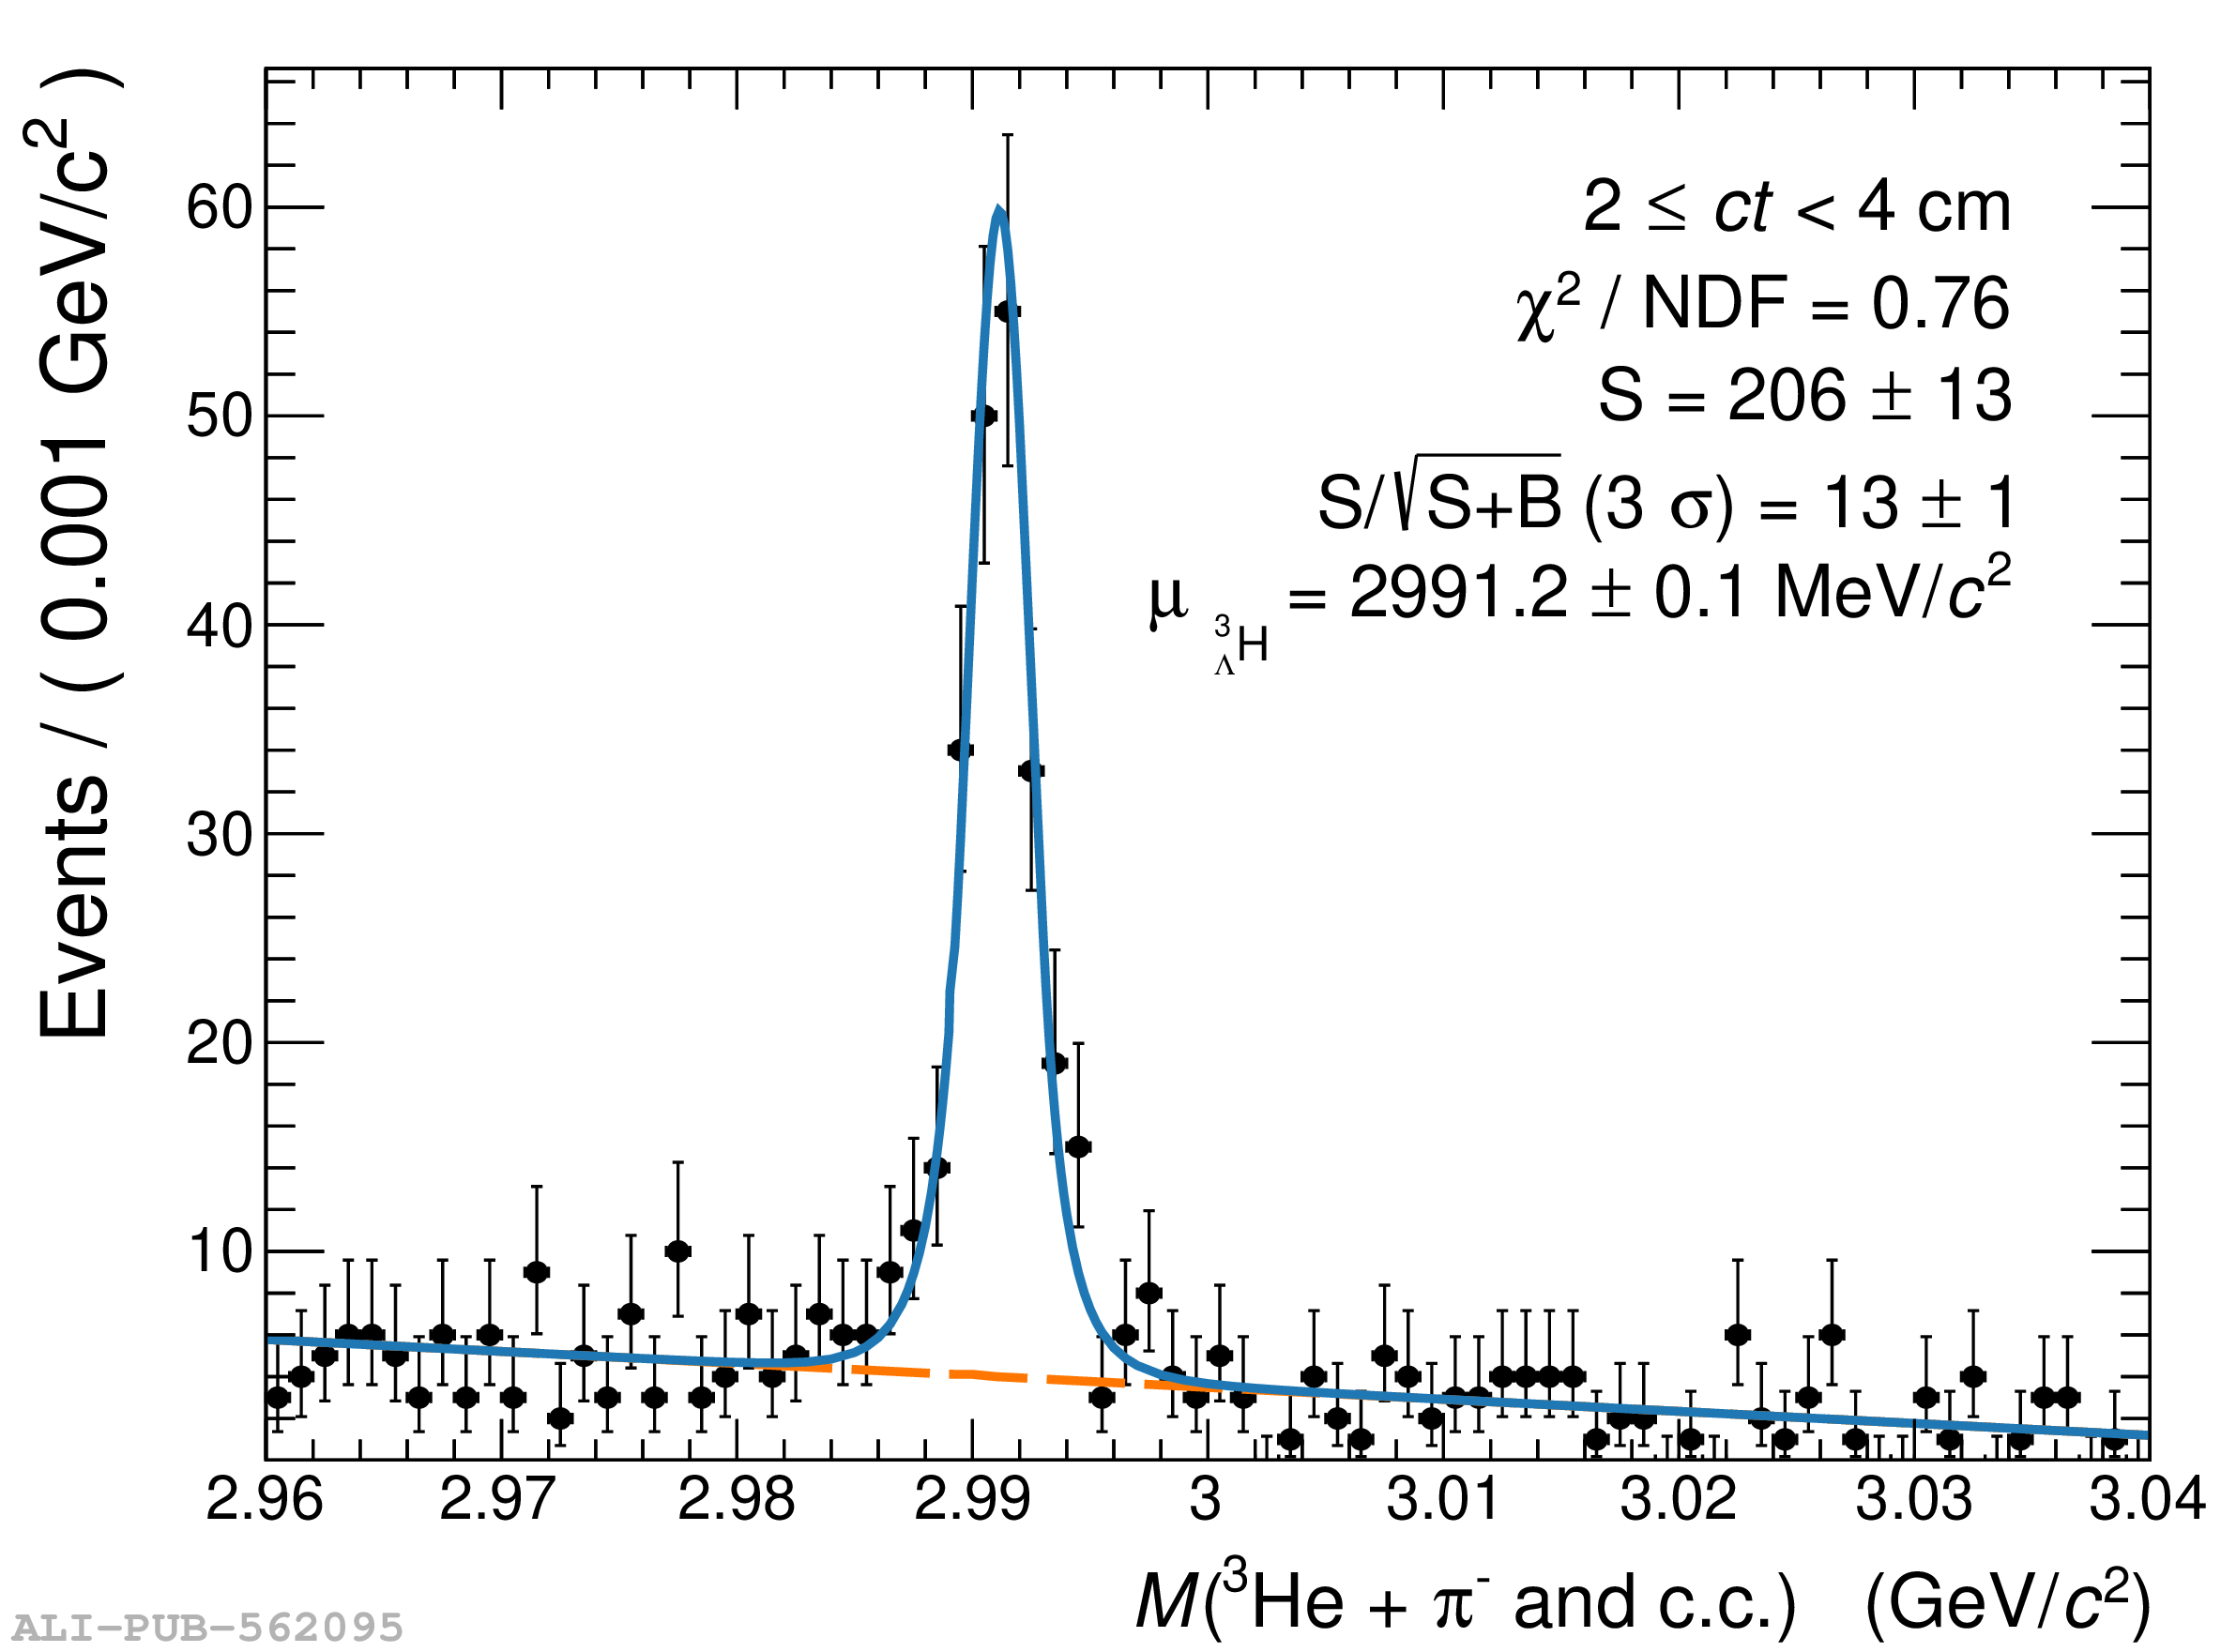  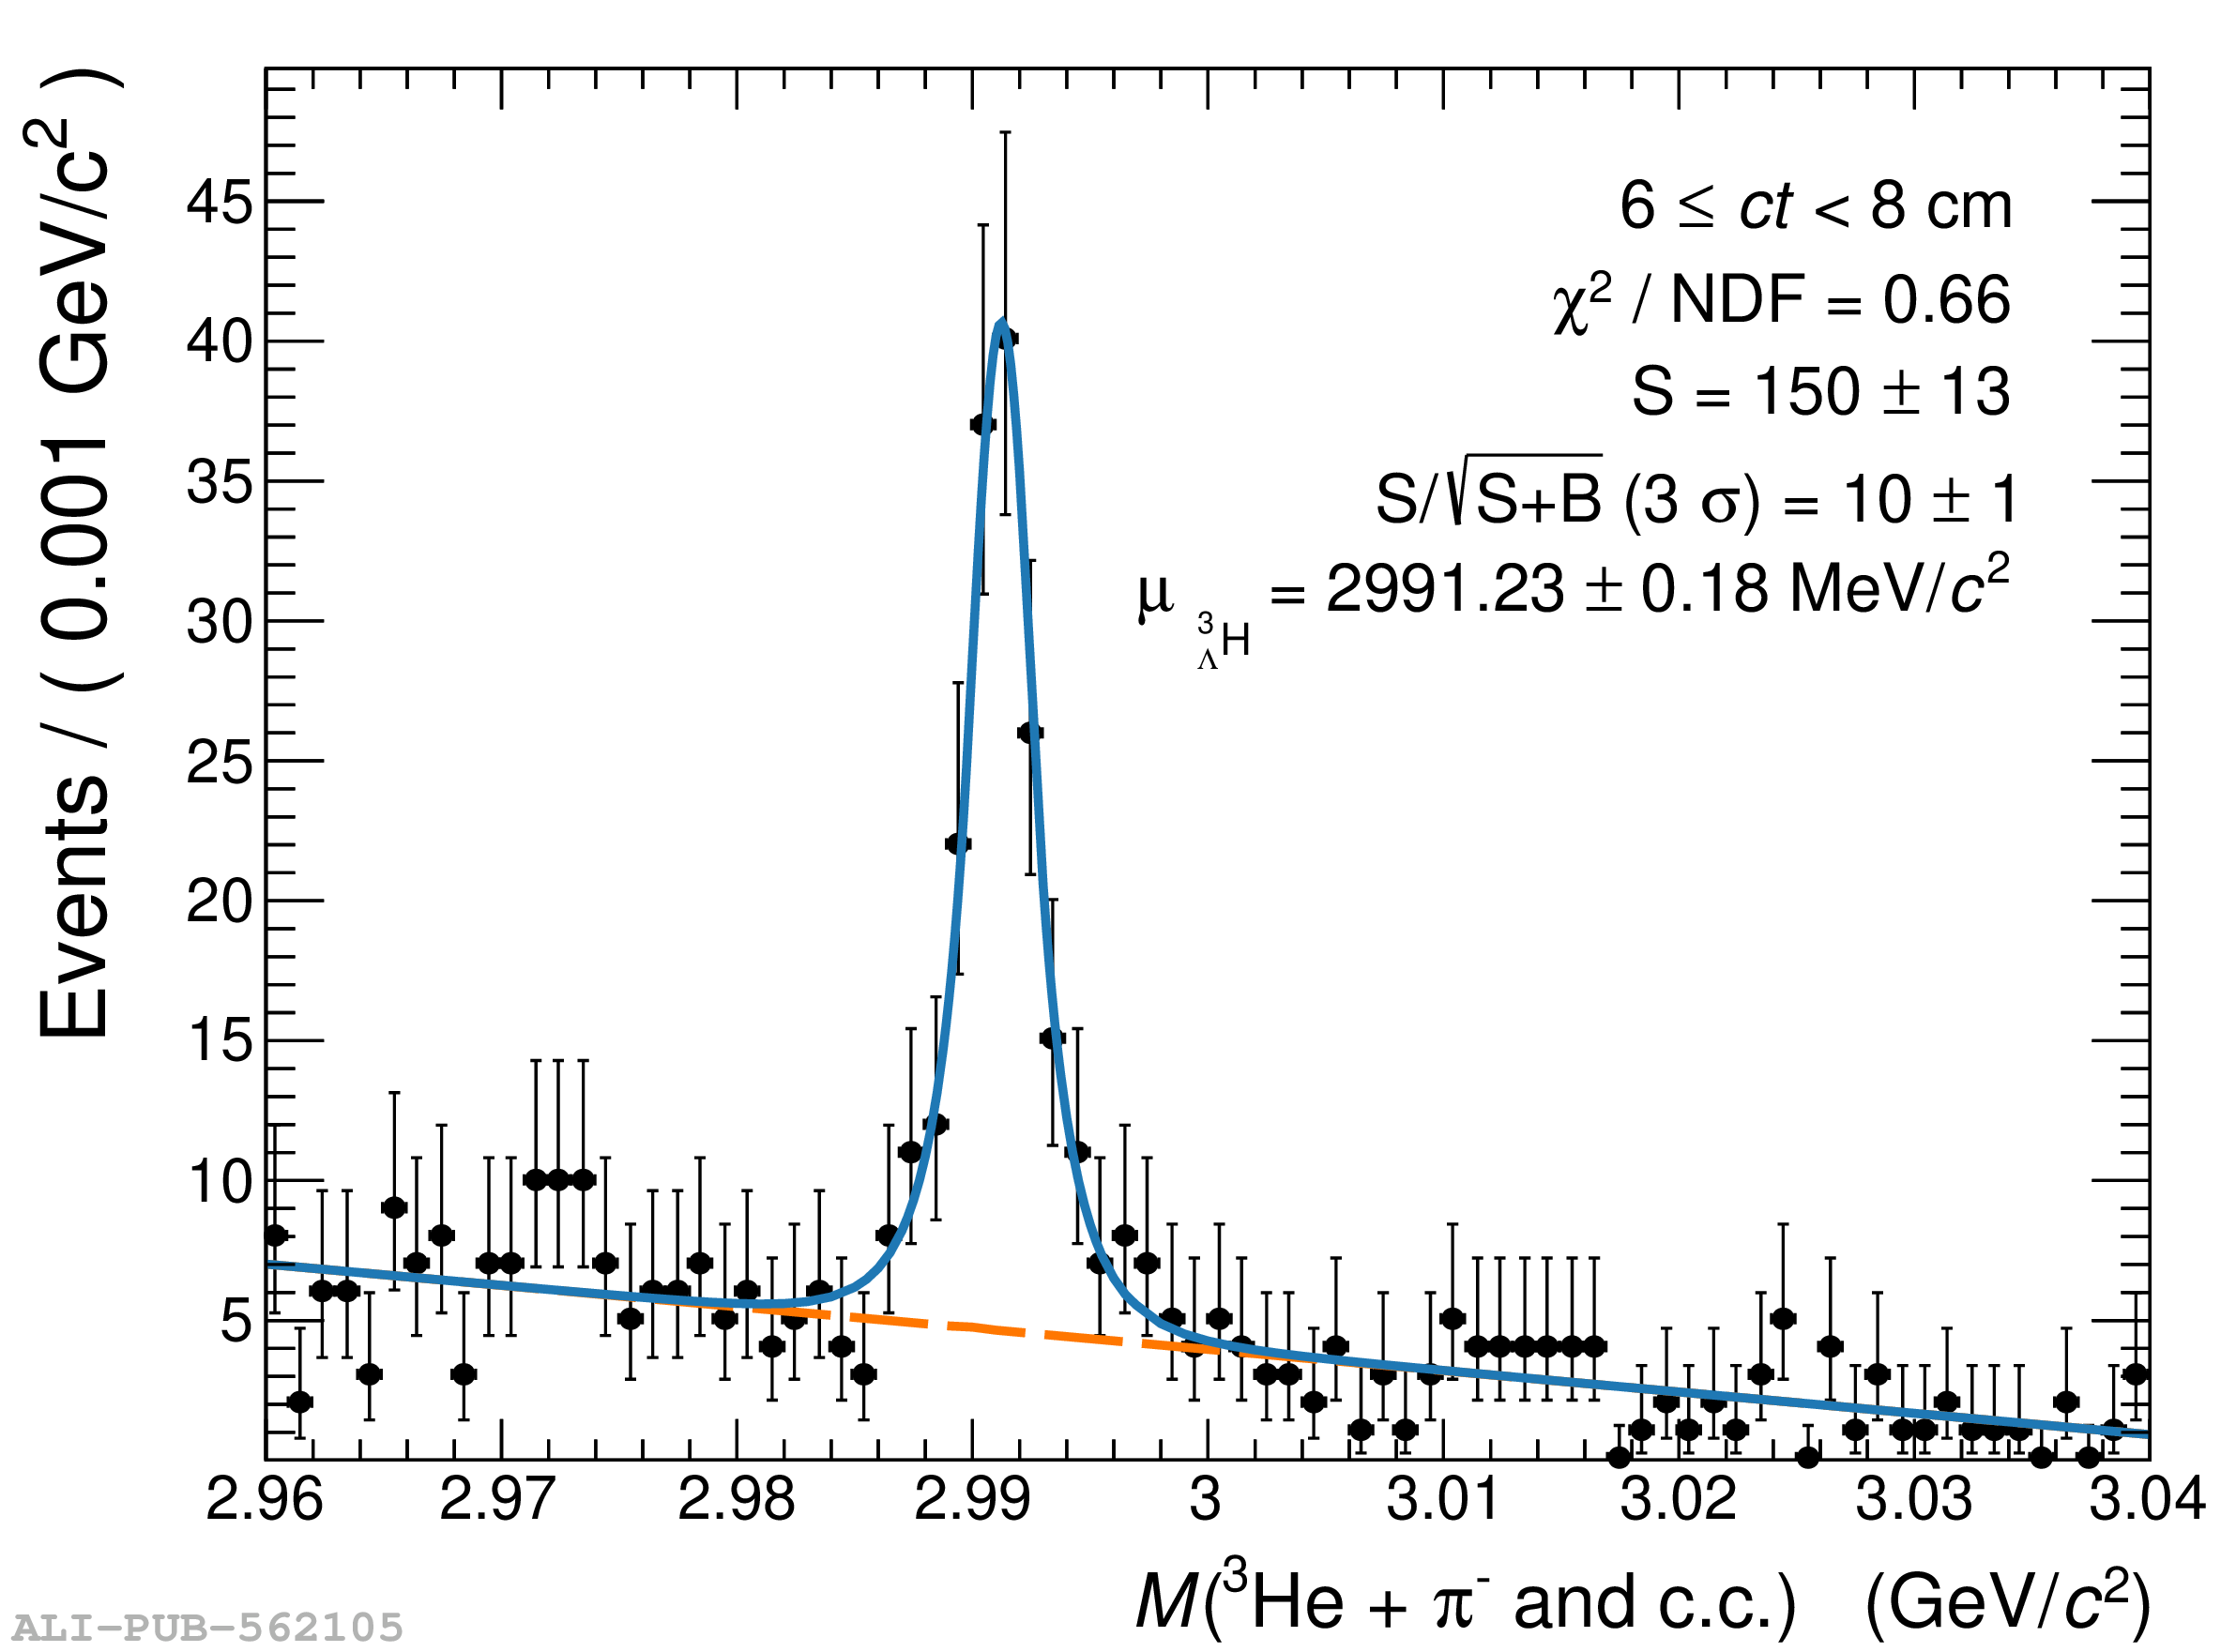 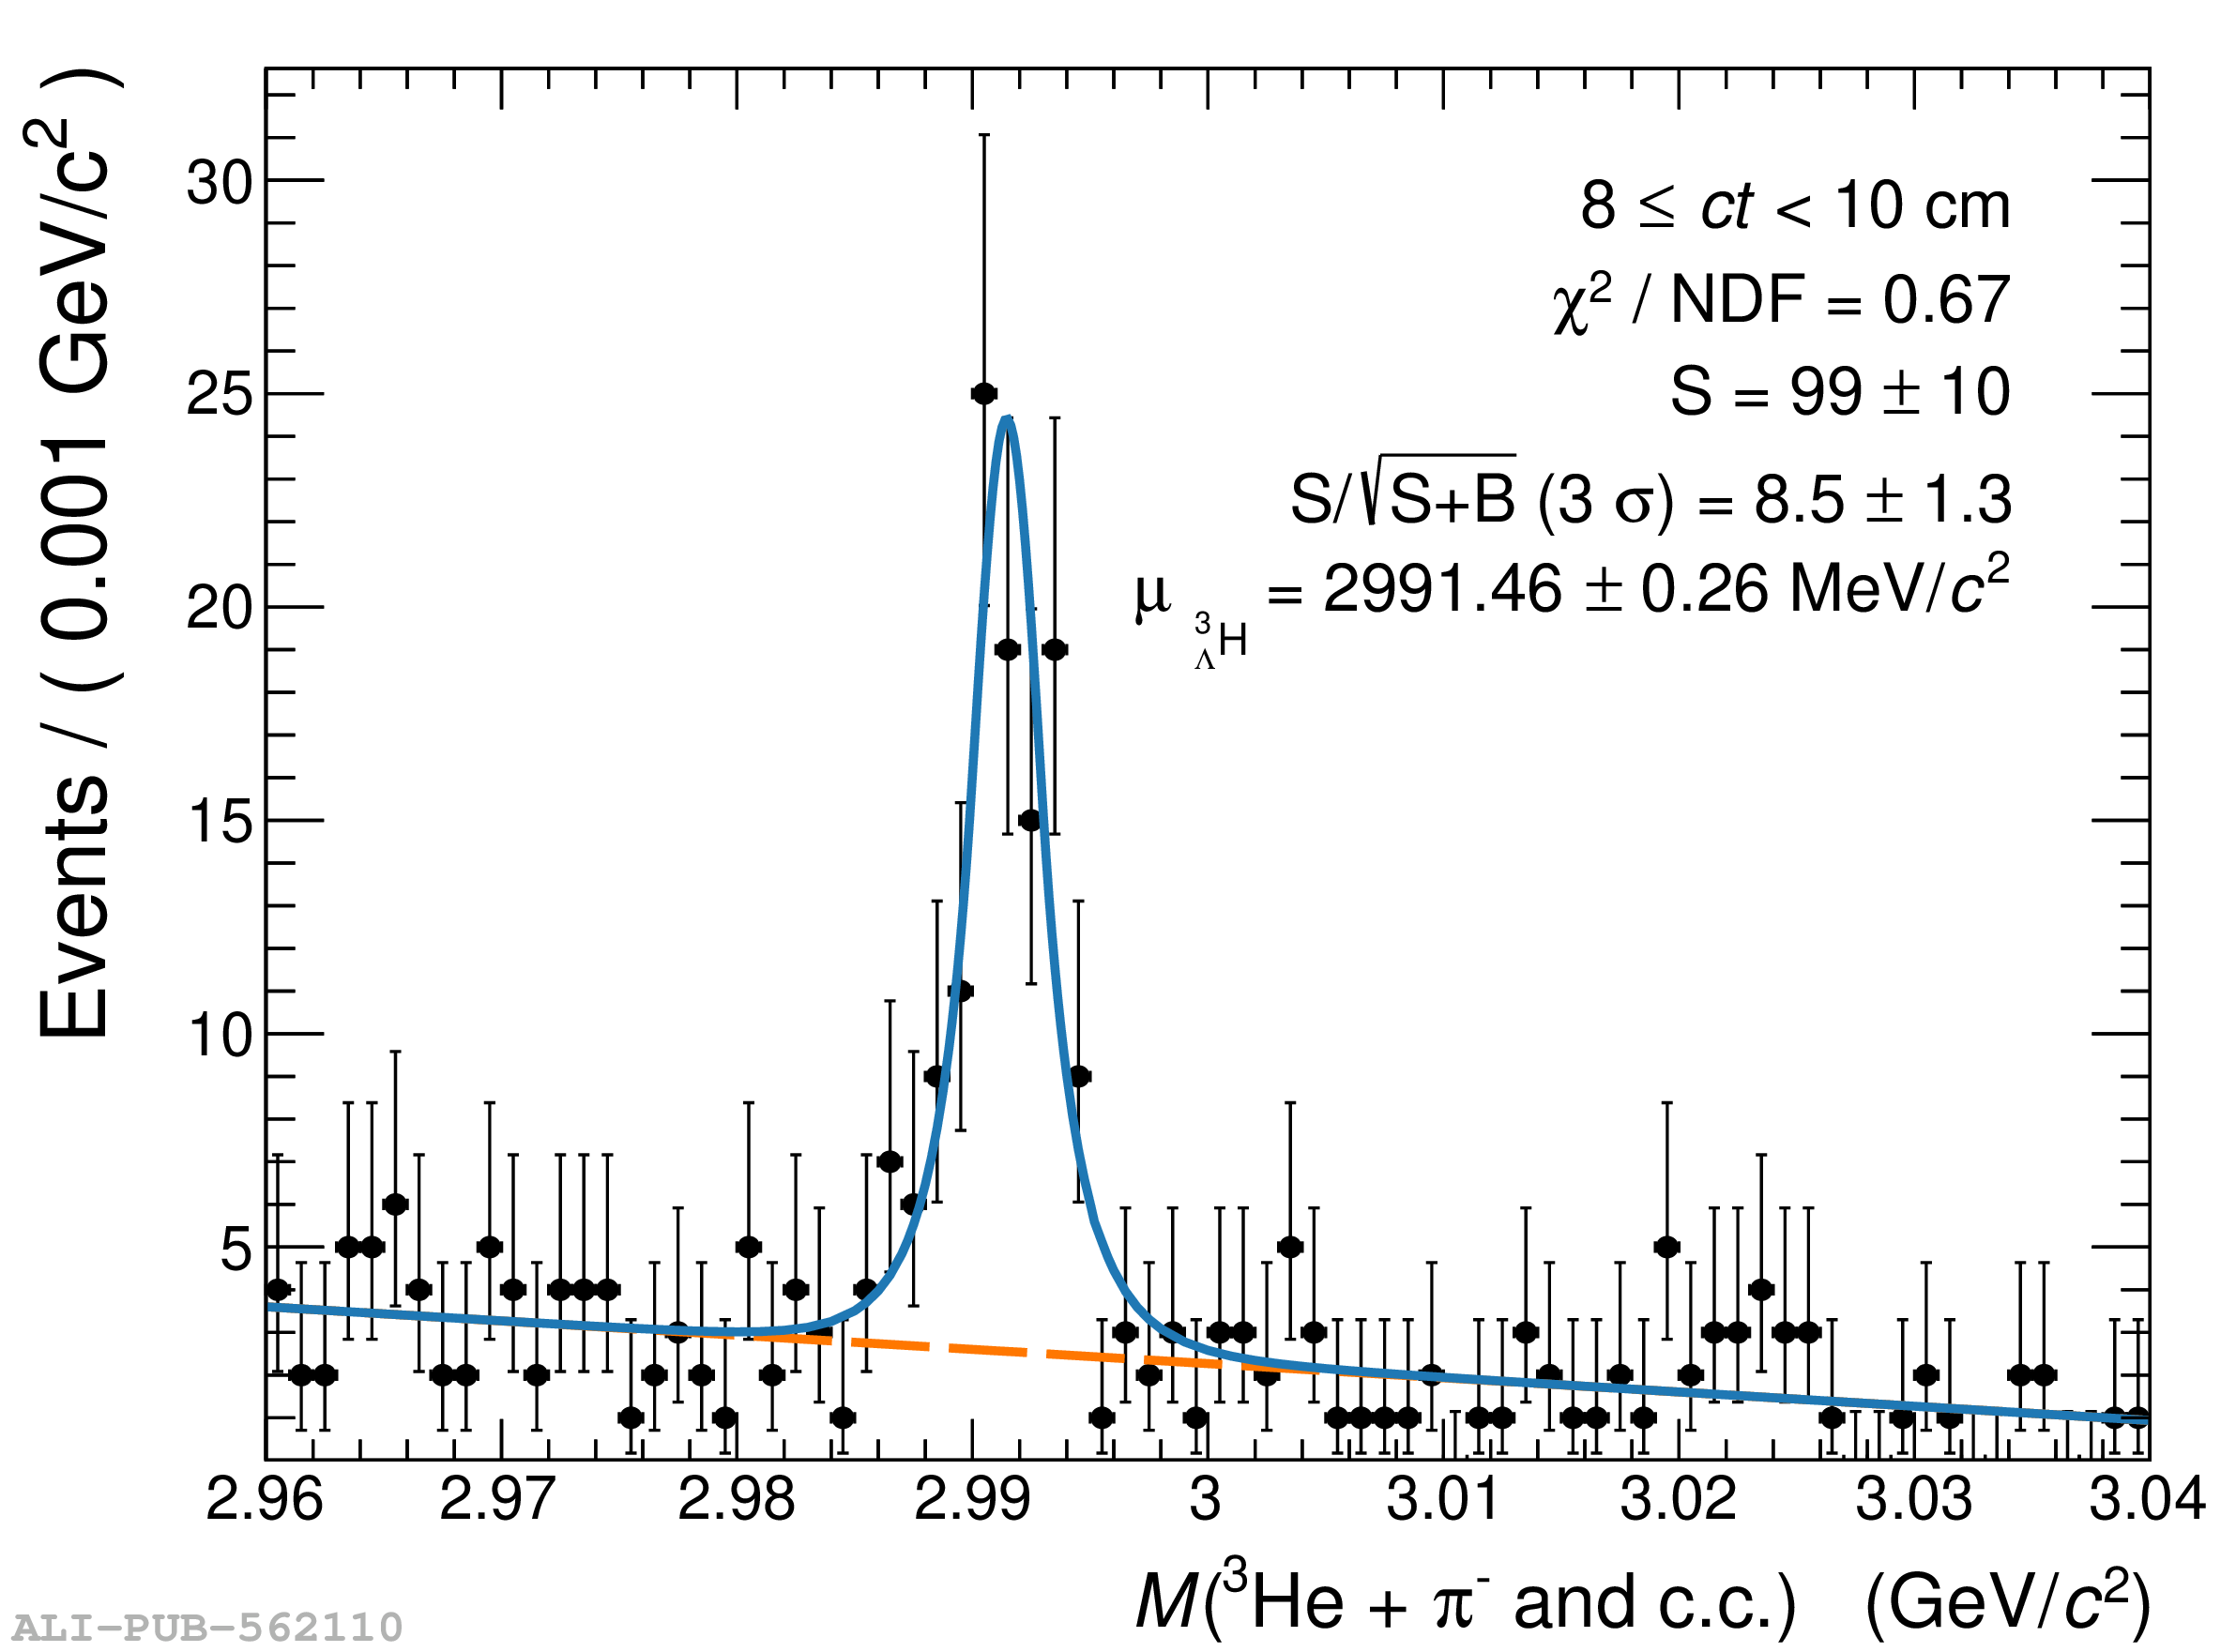 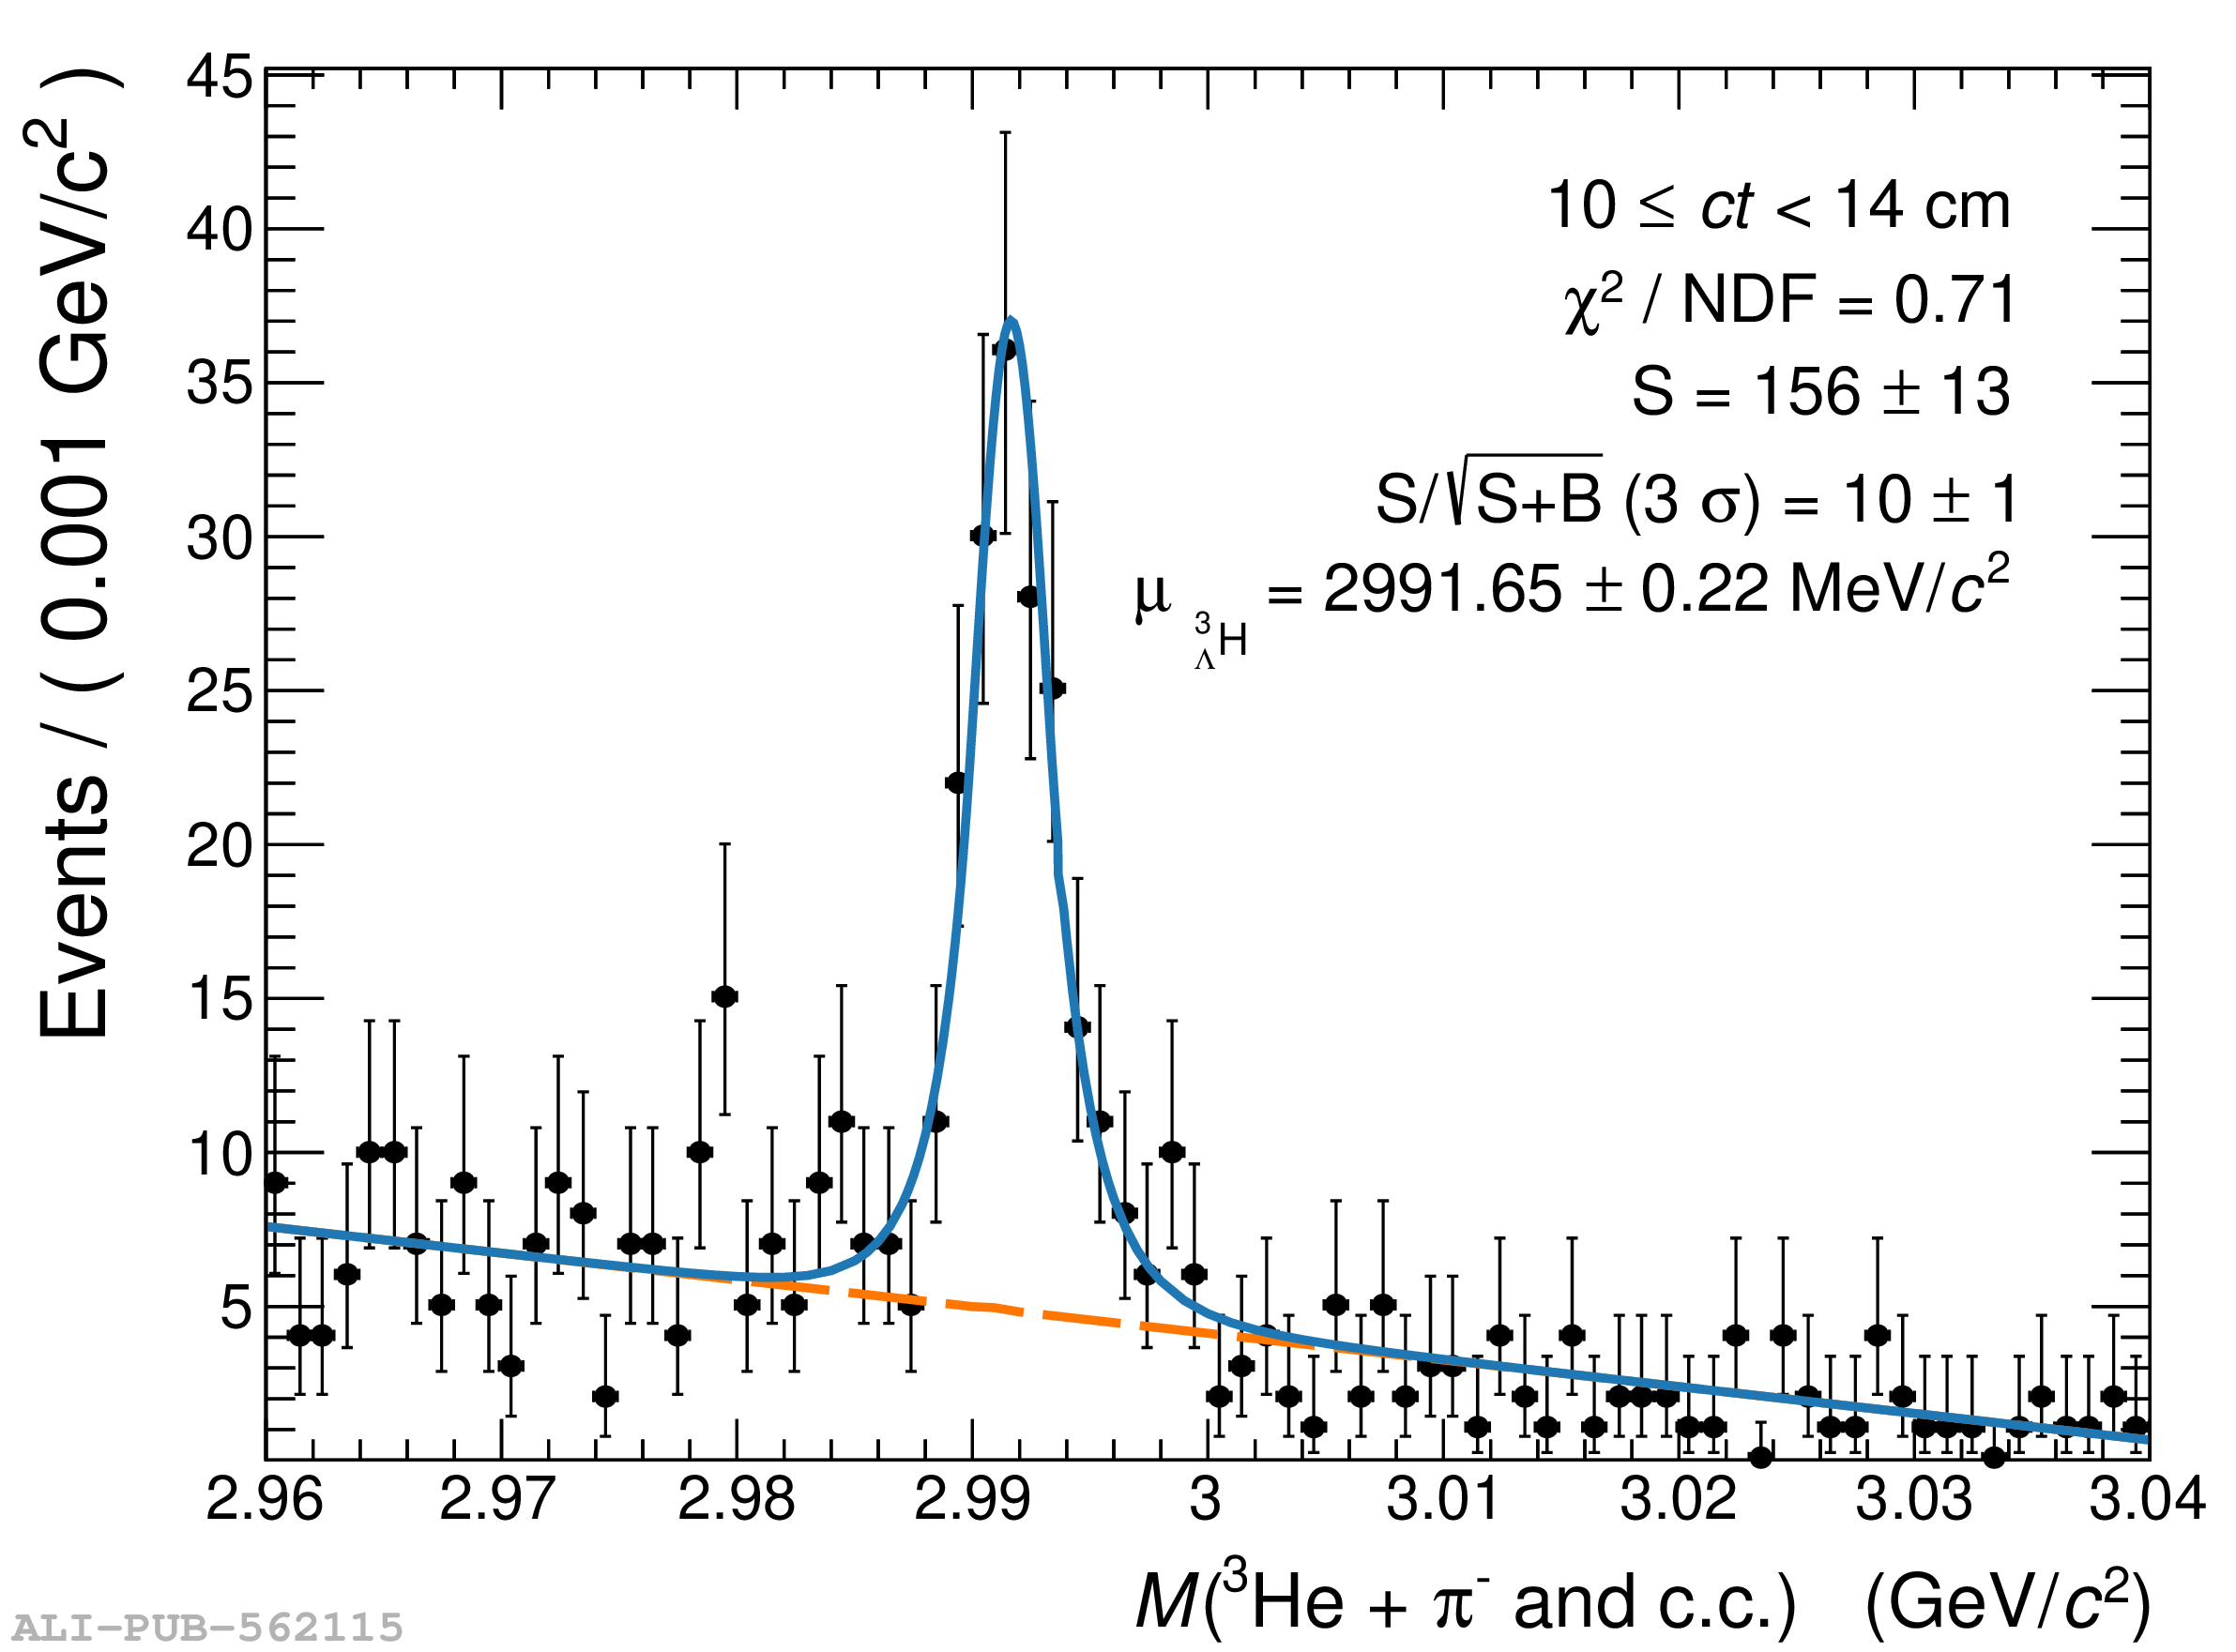 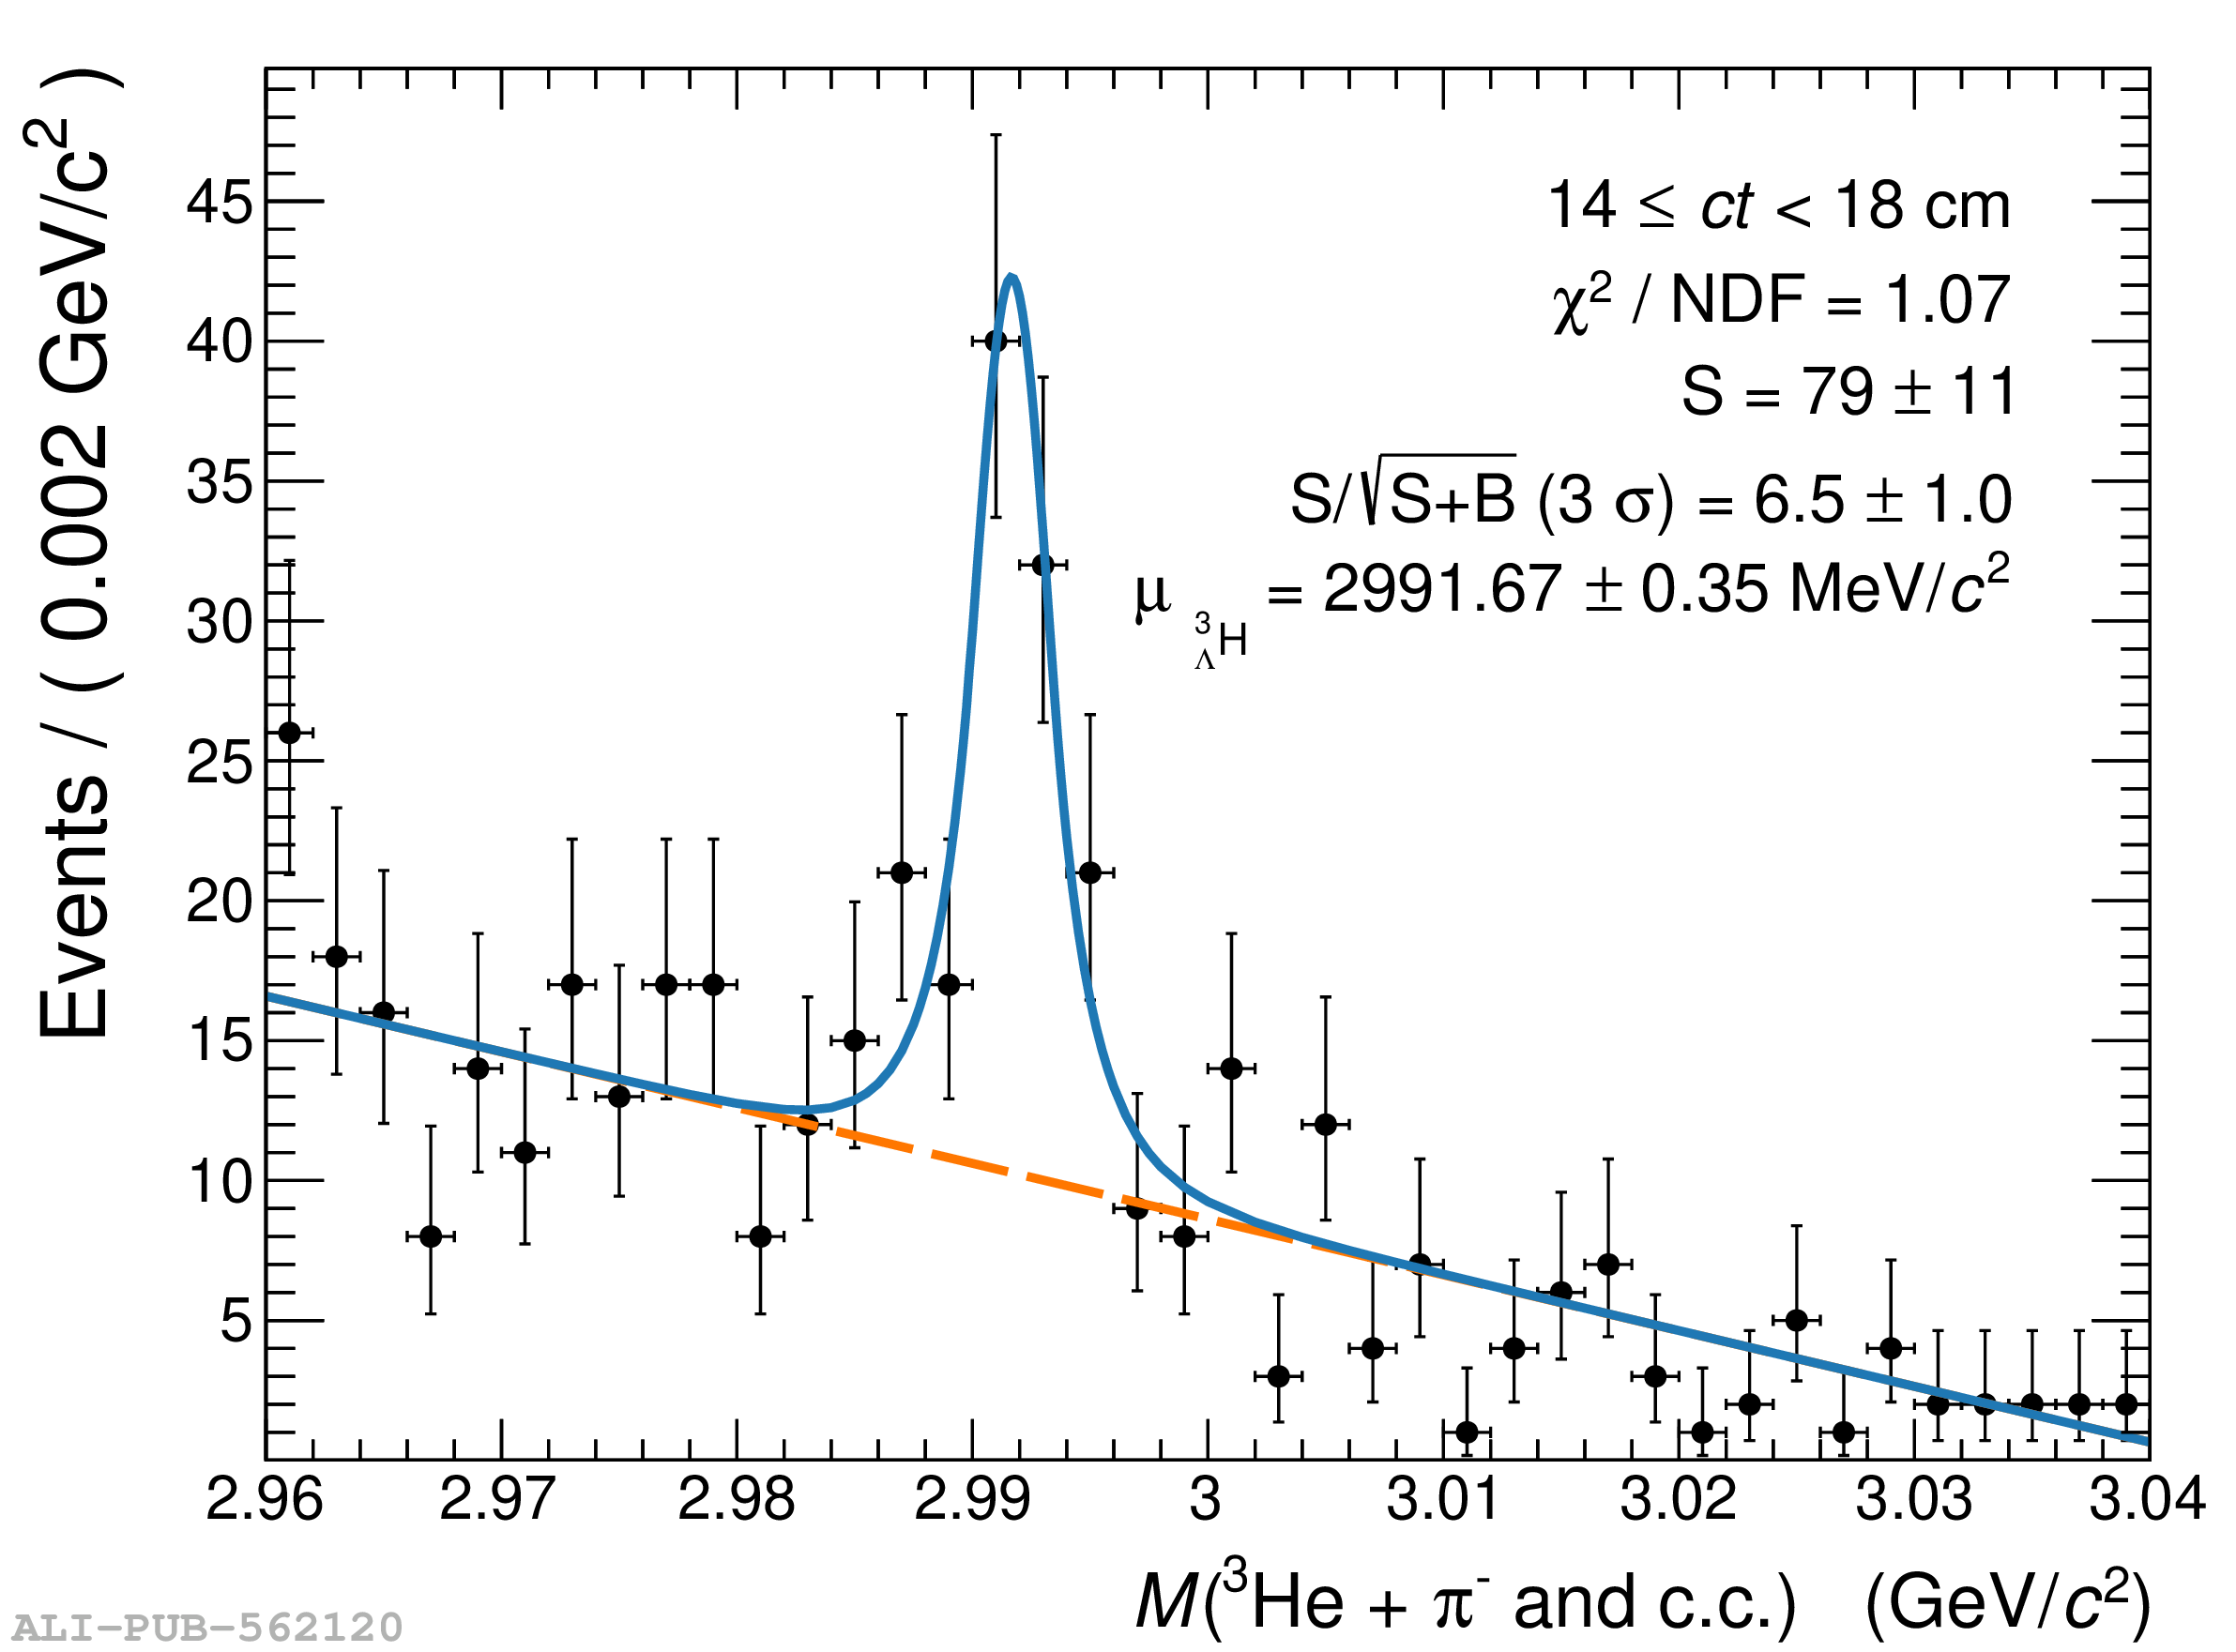 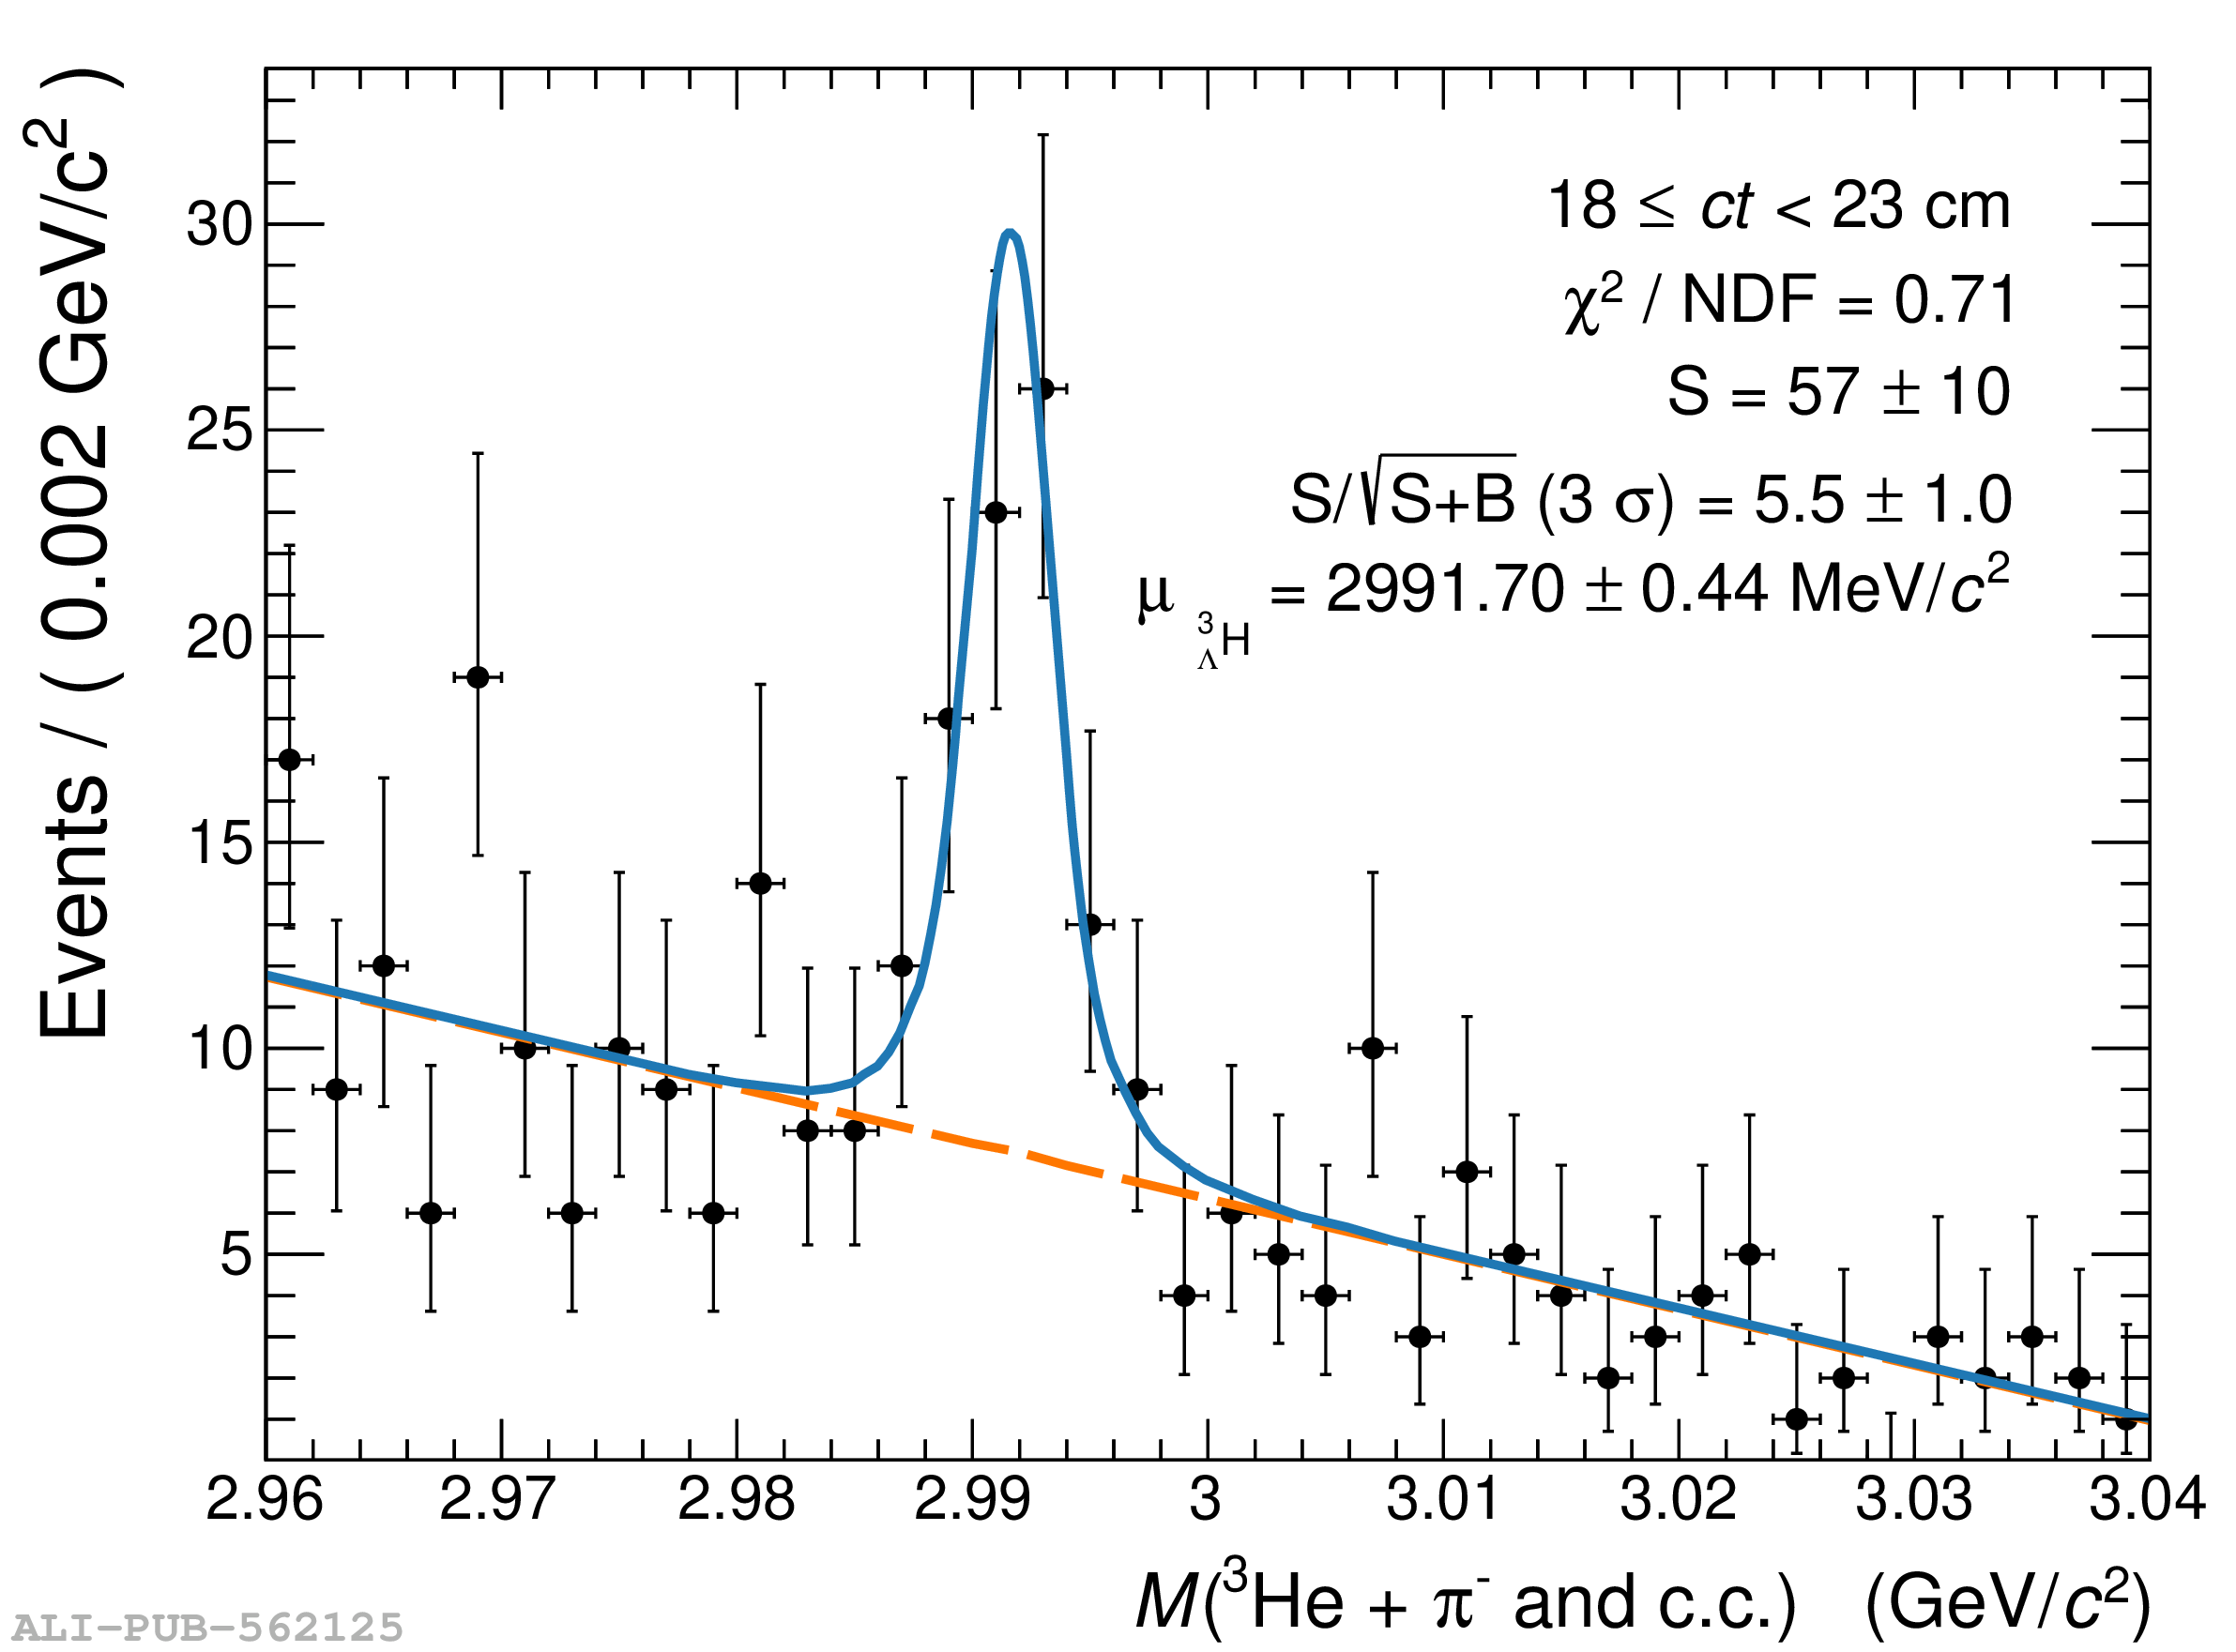 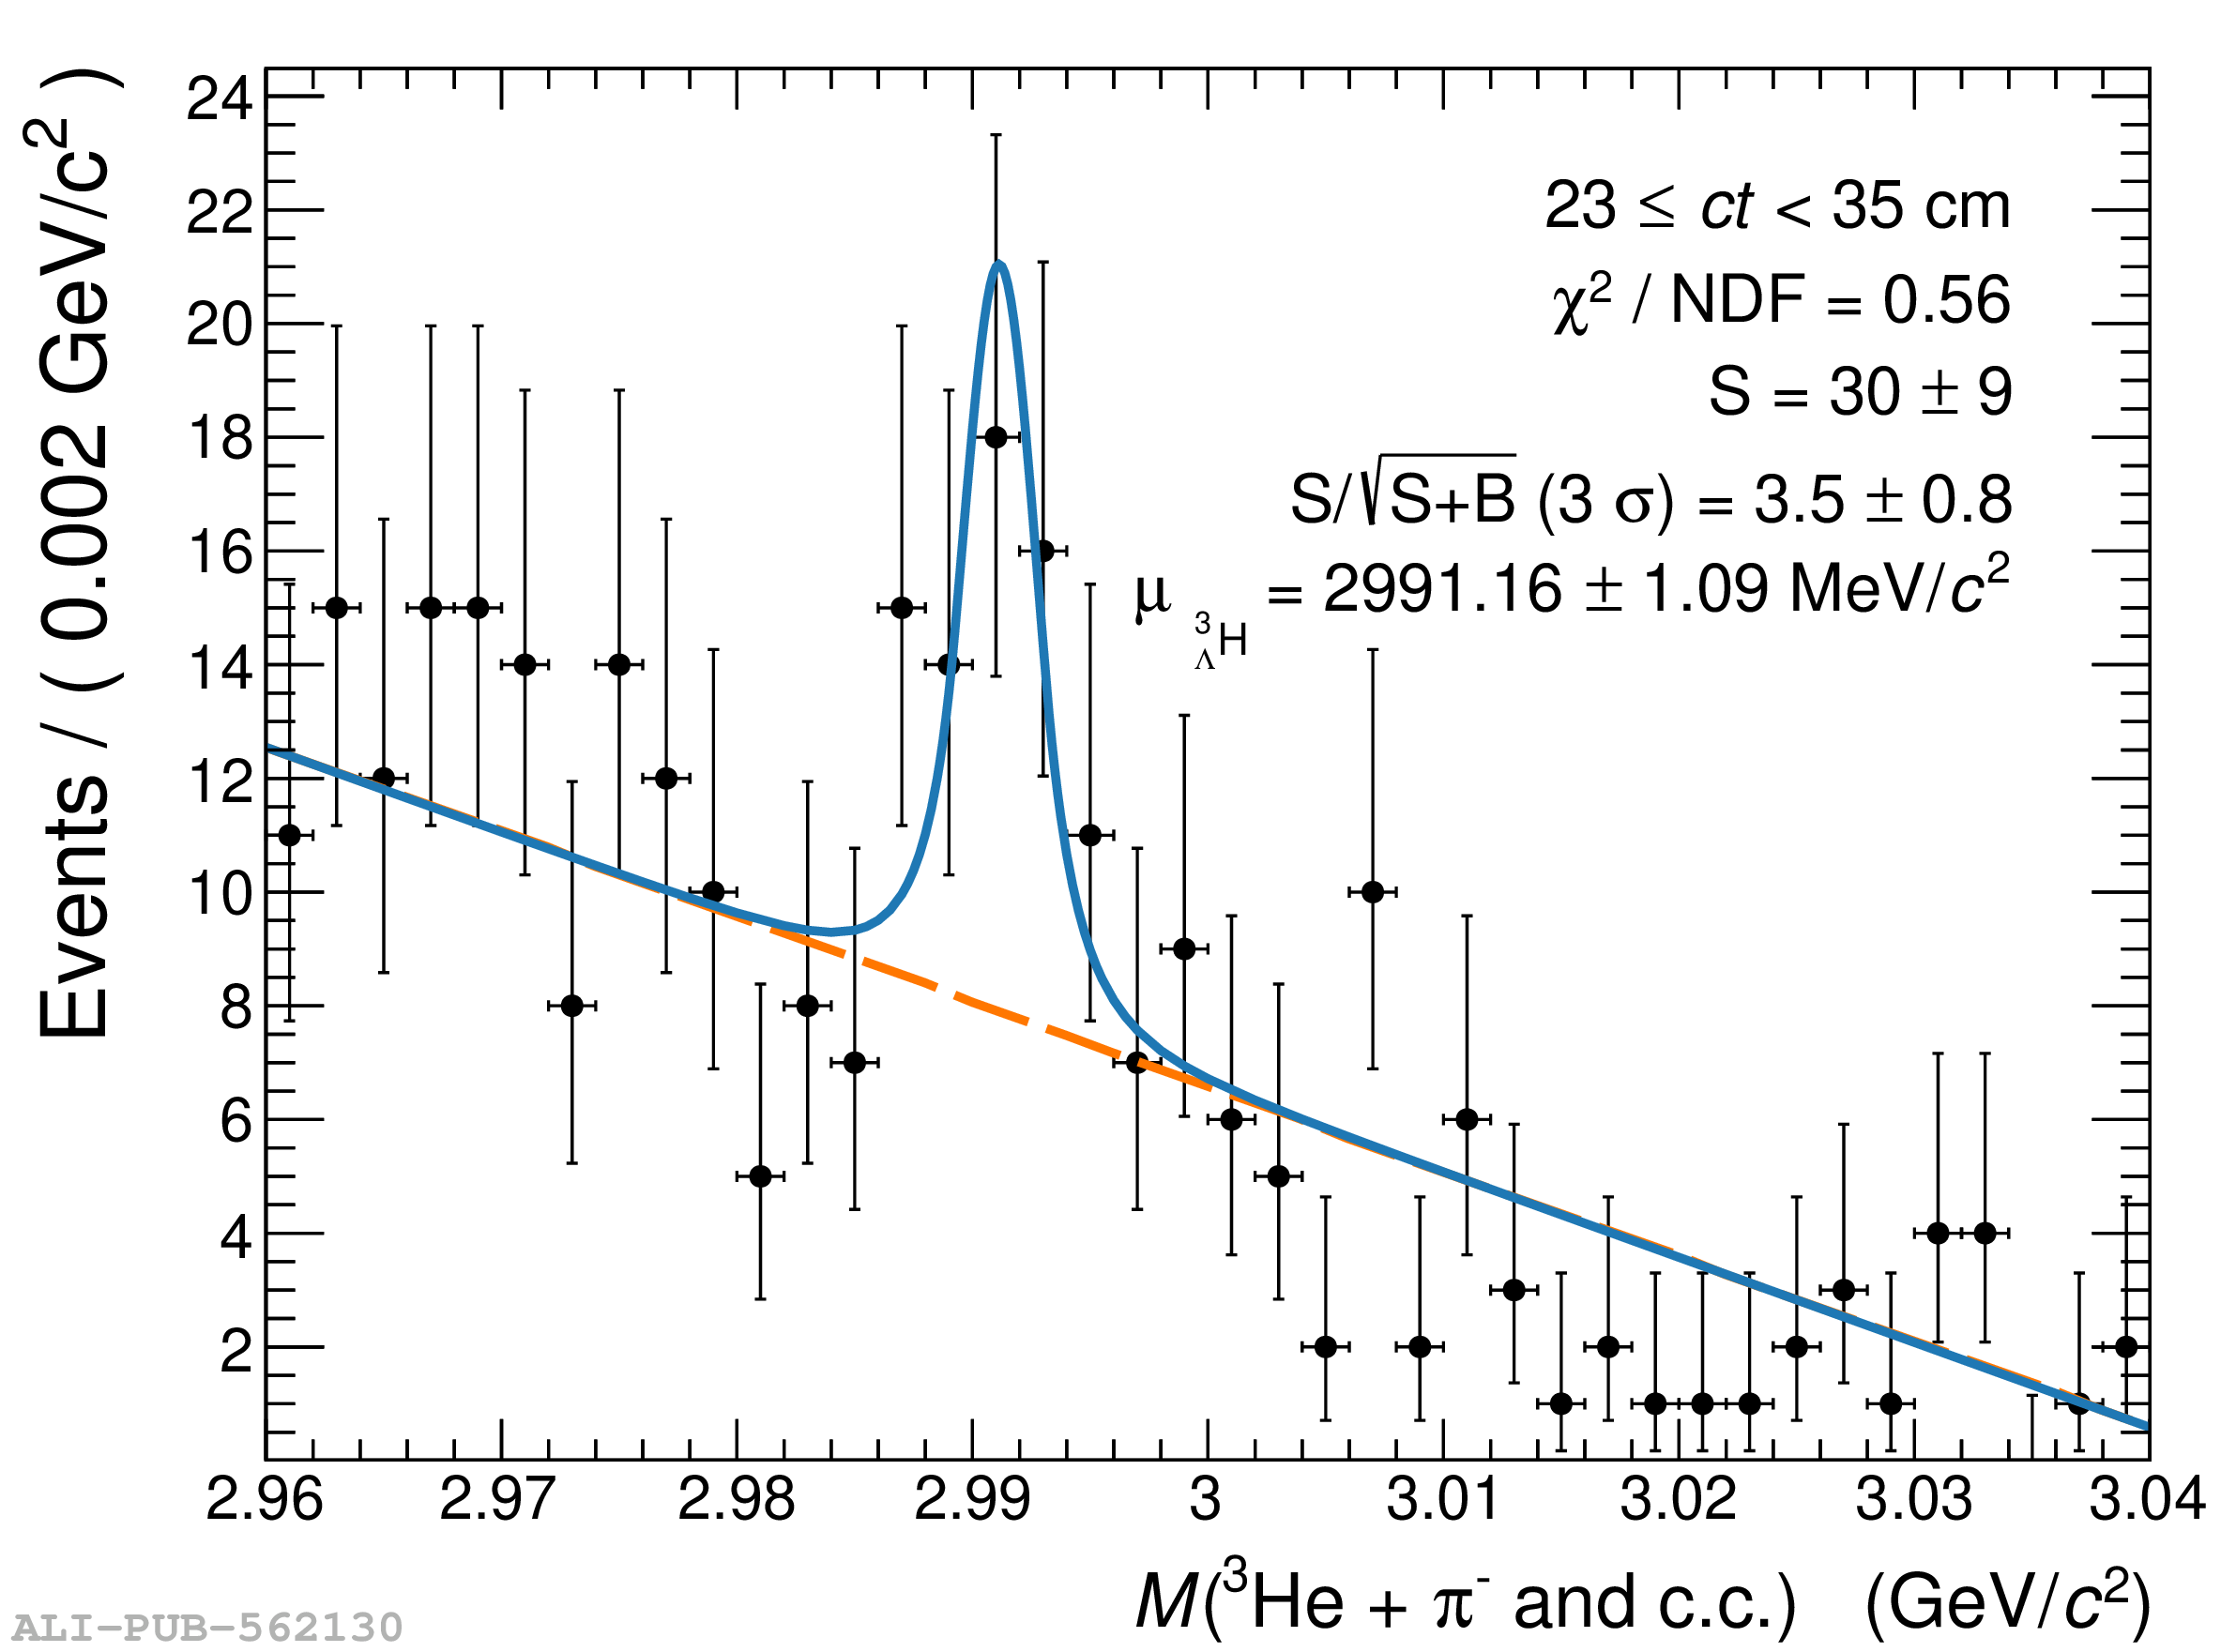 |
Figure A.2
Reconstruction shift $\delta_\mathrm{MC}$ observed in the MC as a function of the proper decay length. The statistical uncertainties are represented with vertical lines. The value of $\delta_\mathrm{MC}$ increases with the distance travelled by the $^{3}_{\Lambda}{\rm H}$ candidates before decaying. | 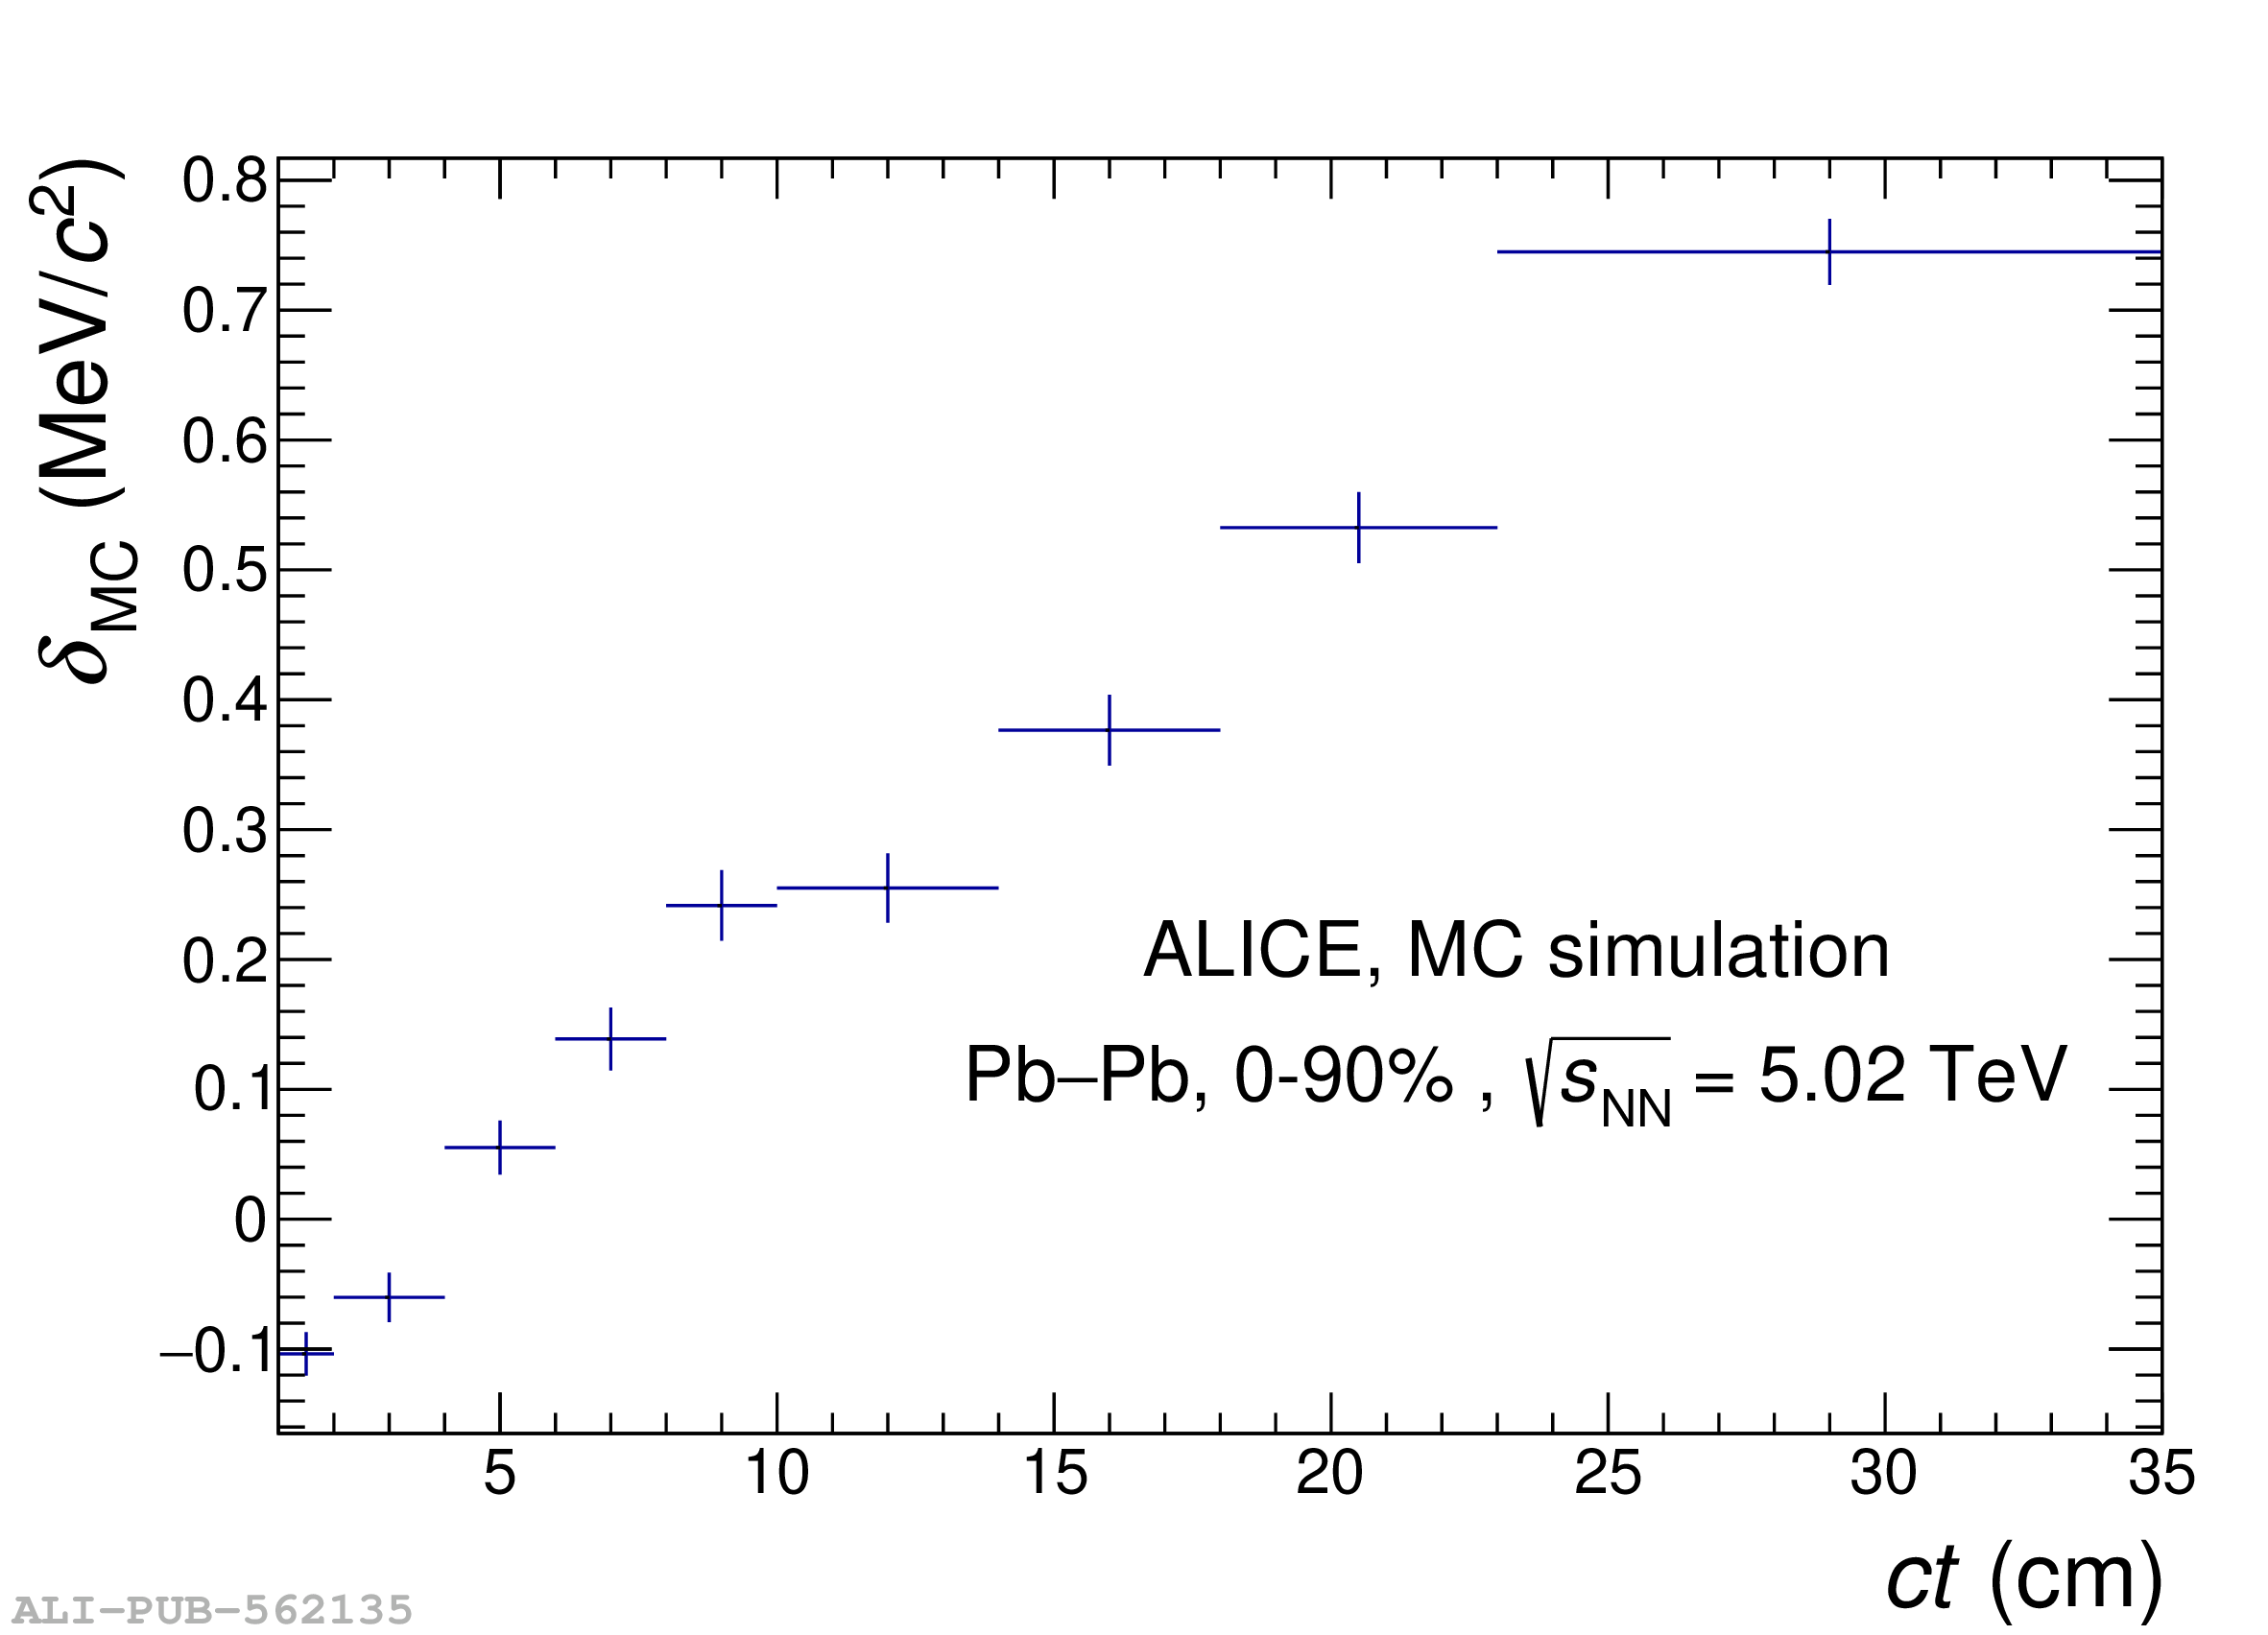 |