The transverse-momentum ($p_{\rm T}$) spectra and coalescence parameters $B_2$ of (anti)deuterons are measured in pp collisions at $\sqrt{s} = 13$ TeV for the first time in and out of jets. In this measurement, the direction of the leading particle with the highest $p_{\rm T}$ in the event ($p_{\rm T}^{\rm{ lead}} > 5$ GeV/$c$) is used as an approximation for the jet axis. The event is consequently divided into three azimuthal regions and the jet signal is obtained as the difference between the Toward region, that contains jet fragmentation products in addition to the underlying event (UE), and the Transverse region, which is dominated by the UE. The coalescence parameter in the jet is found to be approximately a factor of 10 larger than that in the underlying event. This experimental observation is consistent with the coalescence picture and can be attributed to the smaller average phase-space distance between nucleons inside the jet cone as compared to the underlying event. The results presented in this Letter are compared to predictions from a simple nucleon coalescence model, where the phase space distributions of nucleons are generated using PYTHIA 8 with the Monash 2013 tuning, and to predictions from a deuteron production model based on ordinary nuclear reactions with parametrized energy-dependent cross sections tuned on data. The latter model is implemented in PYTHIA 8.3. Both models reproduce the observed large difference between in-jet and out-of-jet coalescence parameters, although the almost flat trend of the $B^{\rm Jet}_2$ is not reproduced by the models, which instead give a decreasing trend.
Phys. Rev. Lett. 131 (2023) 042301
HEP Data
e-Print: arXiv:2211.15204 | PDF | inSPIRE
CERN-EP-2022-264
Figure group
Figure 1
Average of deuteron and antideuteron $\pt$-differential yields in the three azimuthal regions (on the left) and in jets (on the right), measured in pp collisions at $\sqrt{s} = $ 13 TeV. Statistical and systematic uncertainties are represented by vertical bars and boxes, respectively. On the right, shaded (blue) boxes show the uncertainty on the results from Ref. [22] related to the subtraction of the uncorrelated background using the ZYAM method [69]. Individual Levy-Tsallis fits are also shown. | 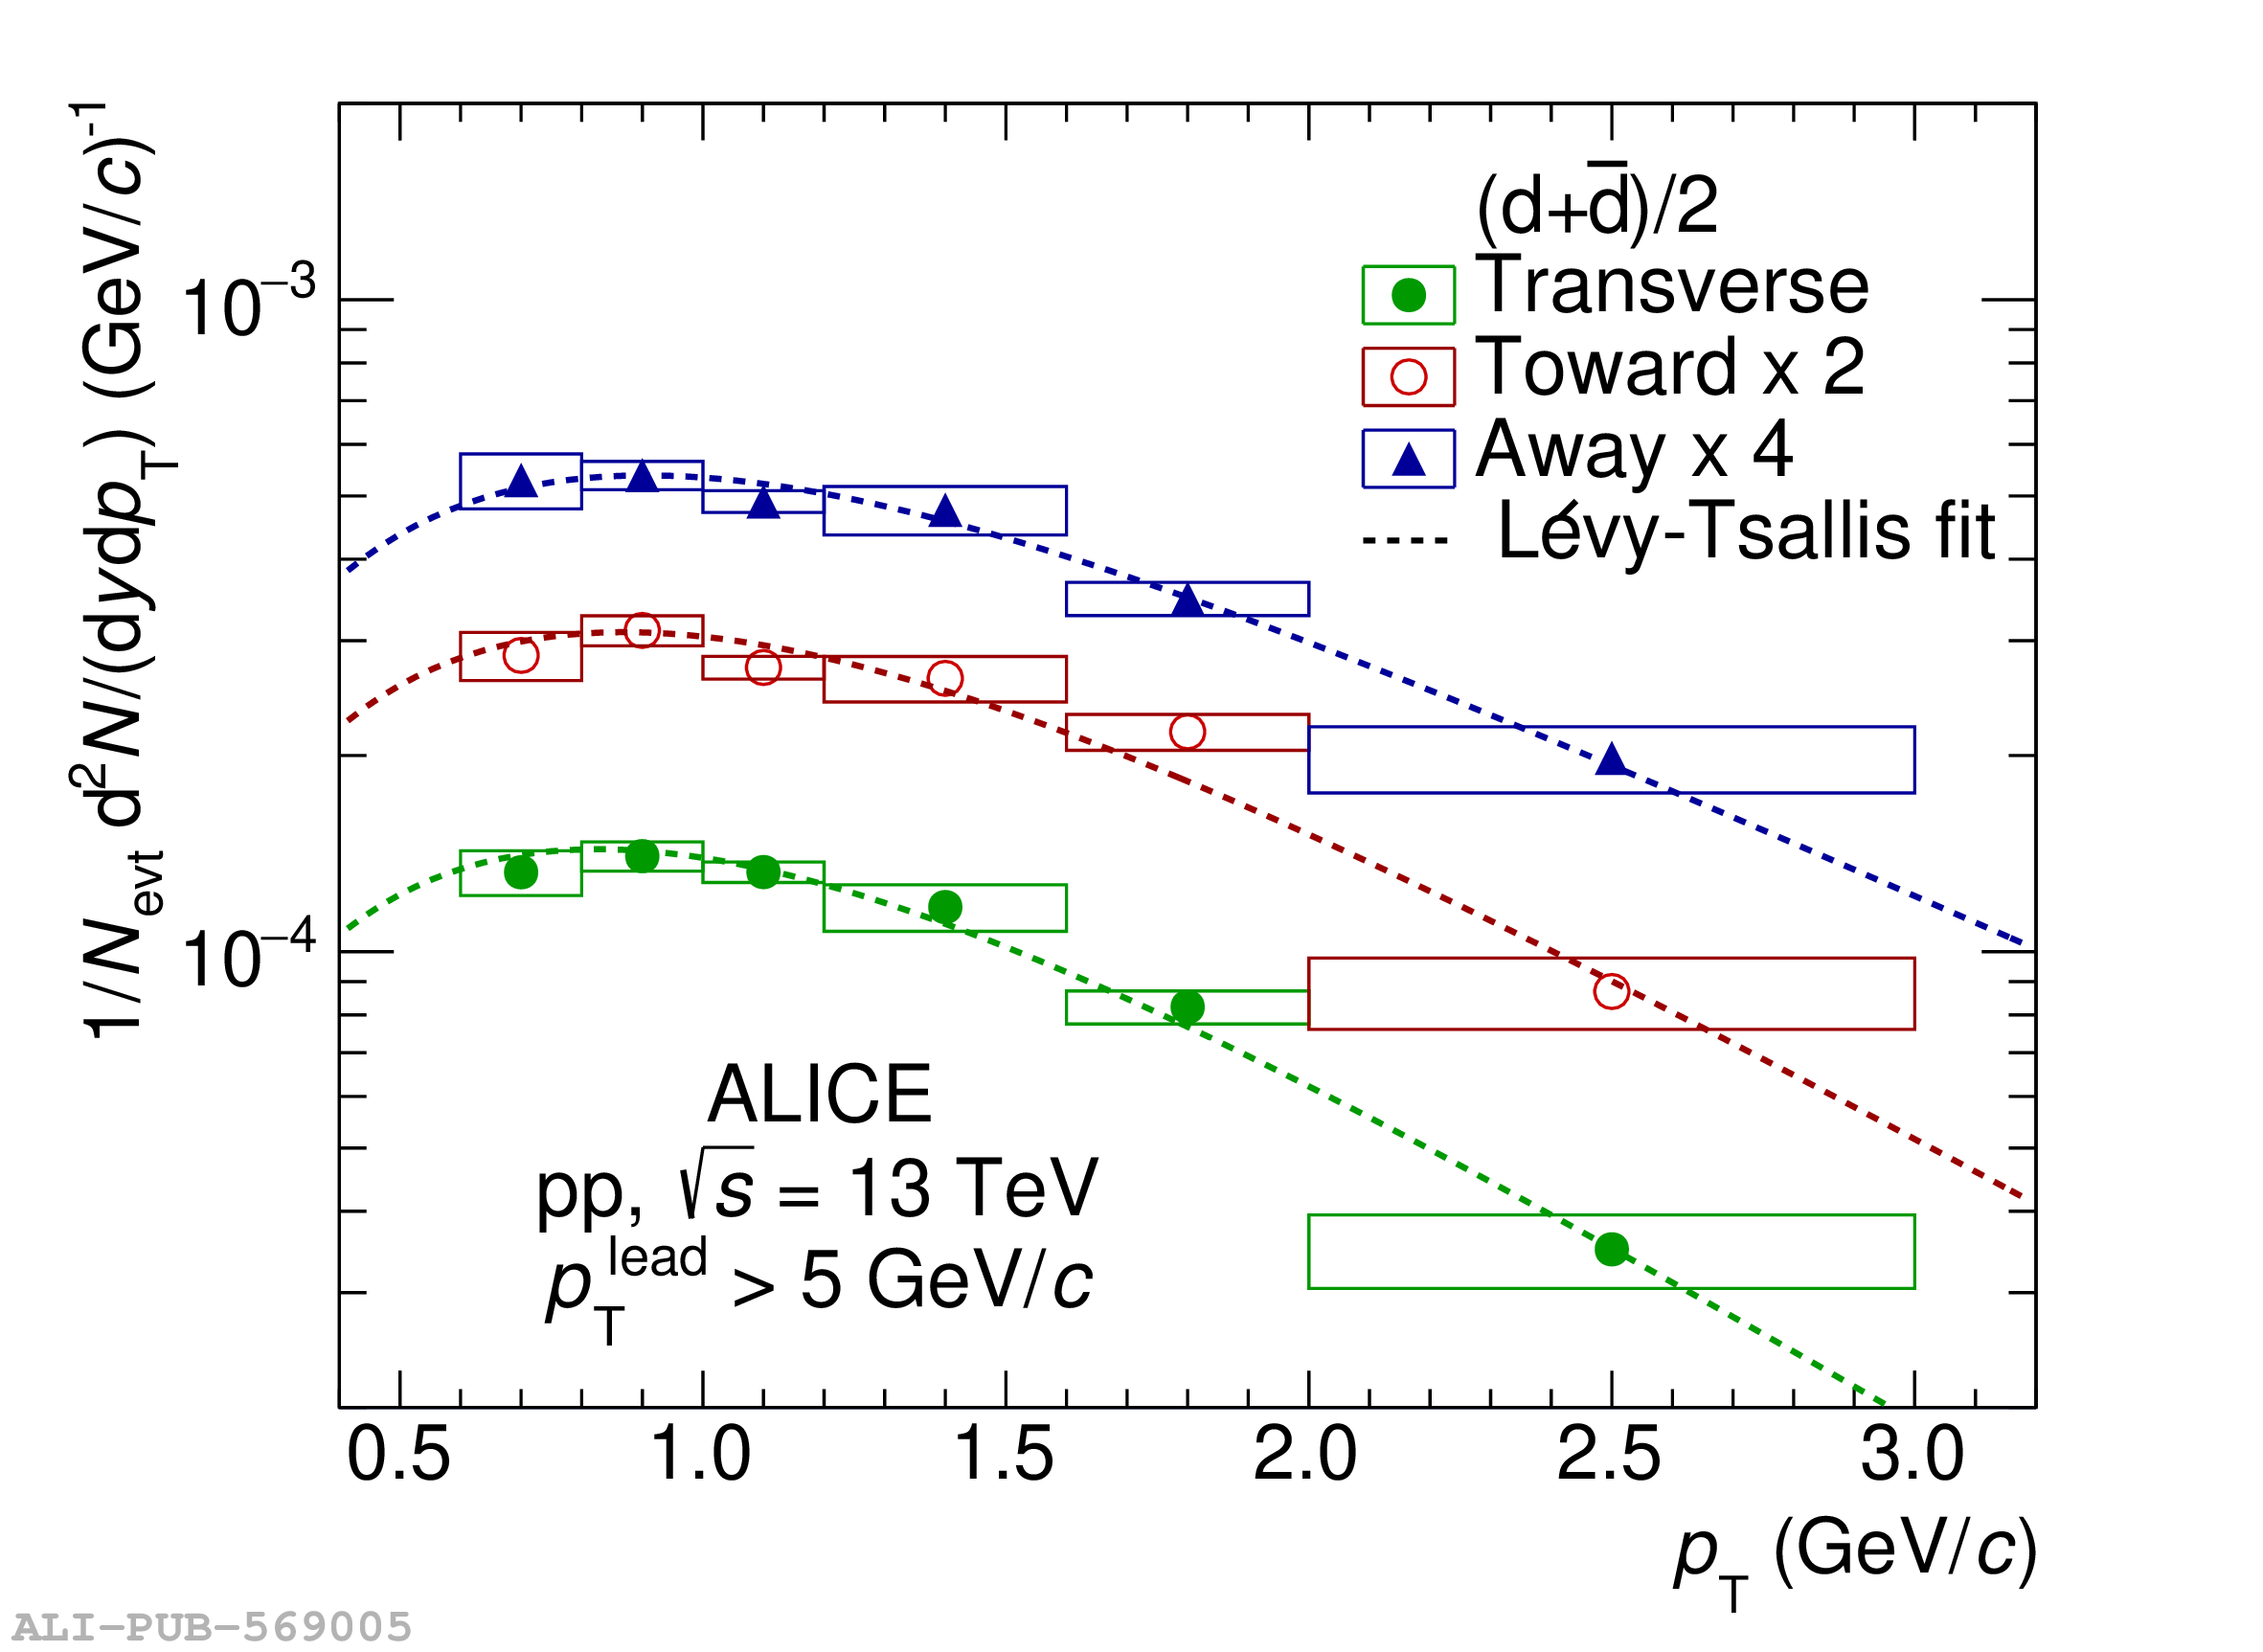 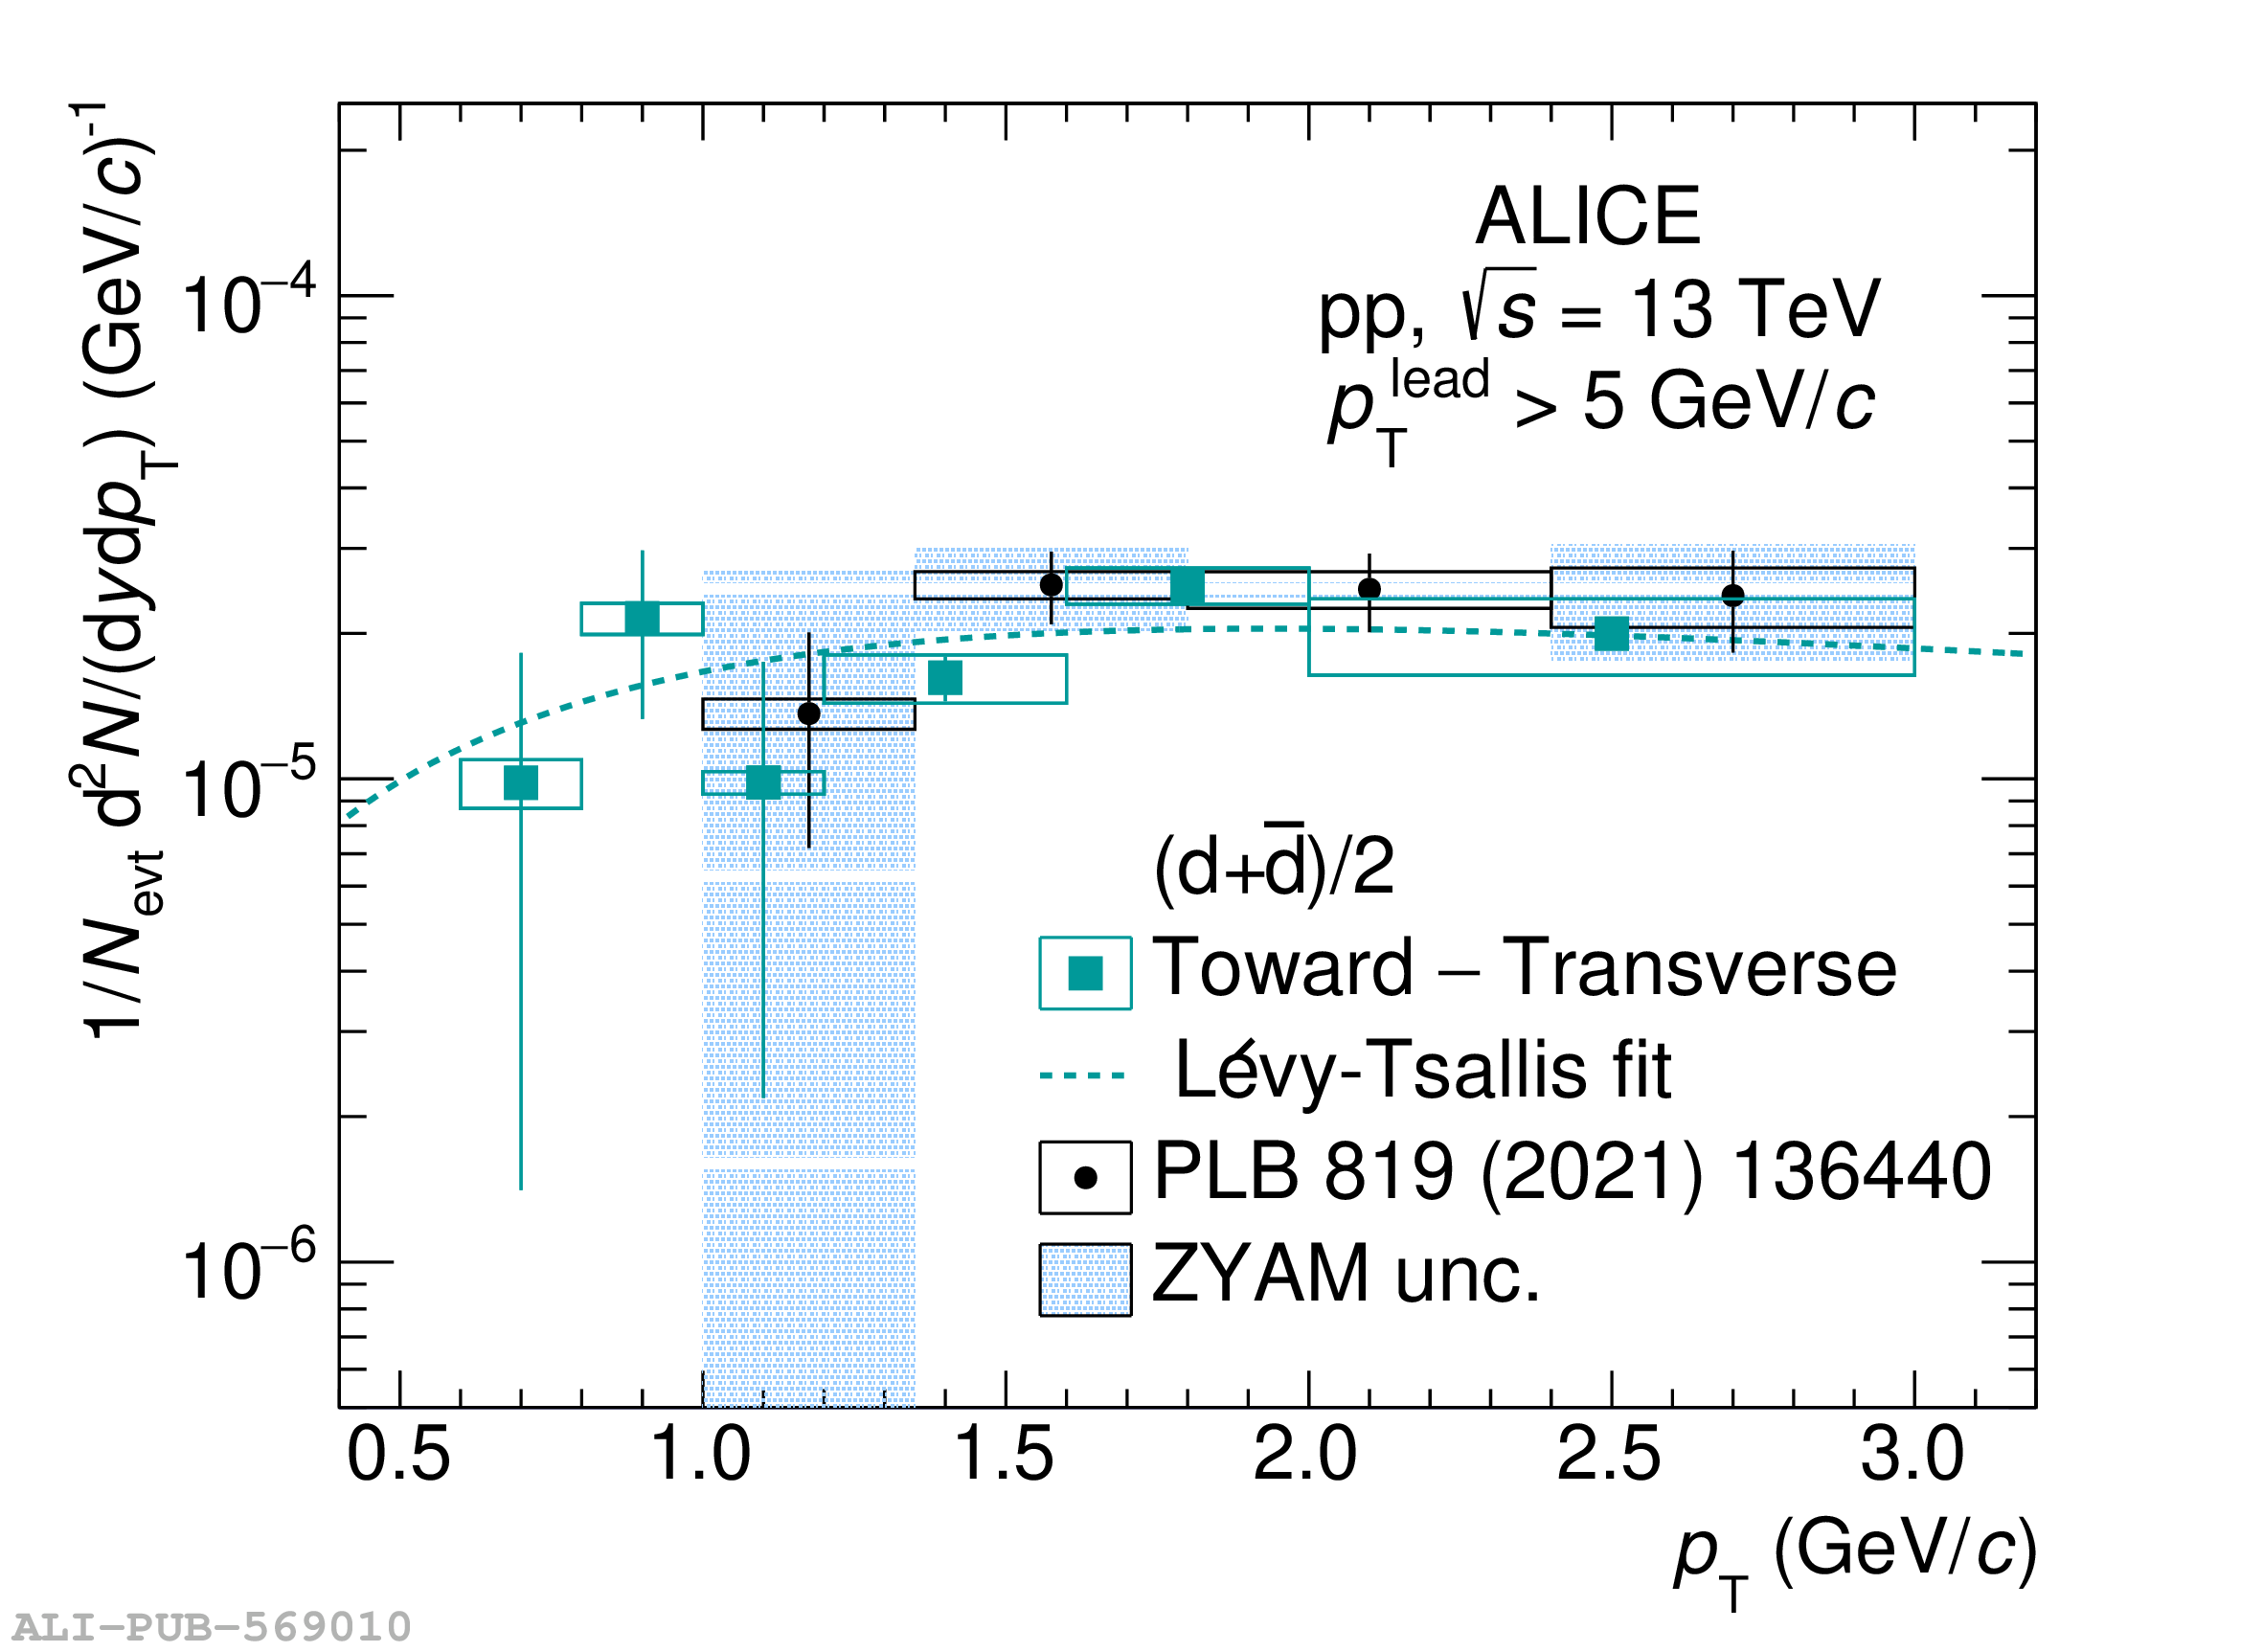 |
Figure 2
Coalescence parameter in jets, $B^{\rm Jet}_{2}$, and in the underlying event, $B^{\rm UE}_{2}$, as a function of $p_{\rm T}/A$ in comparison with the predictions from PYTHIA 8 with the Monash 2013 tune with a coalescence afterburner (left panel) and the reaction-based PYTHIA 8.3 model (right panel). |  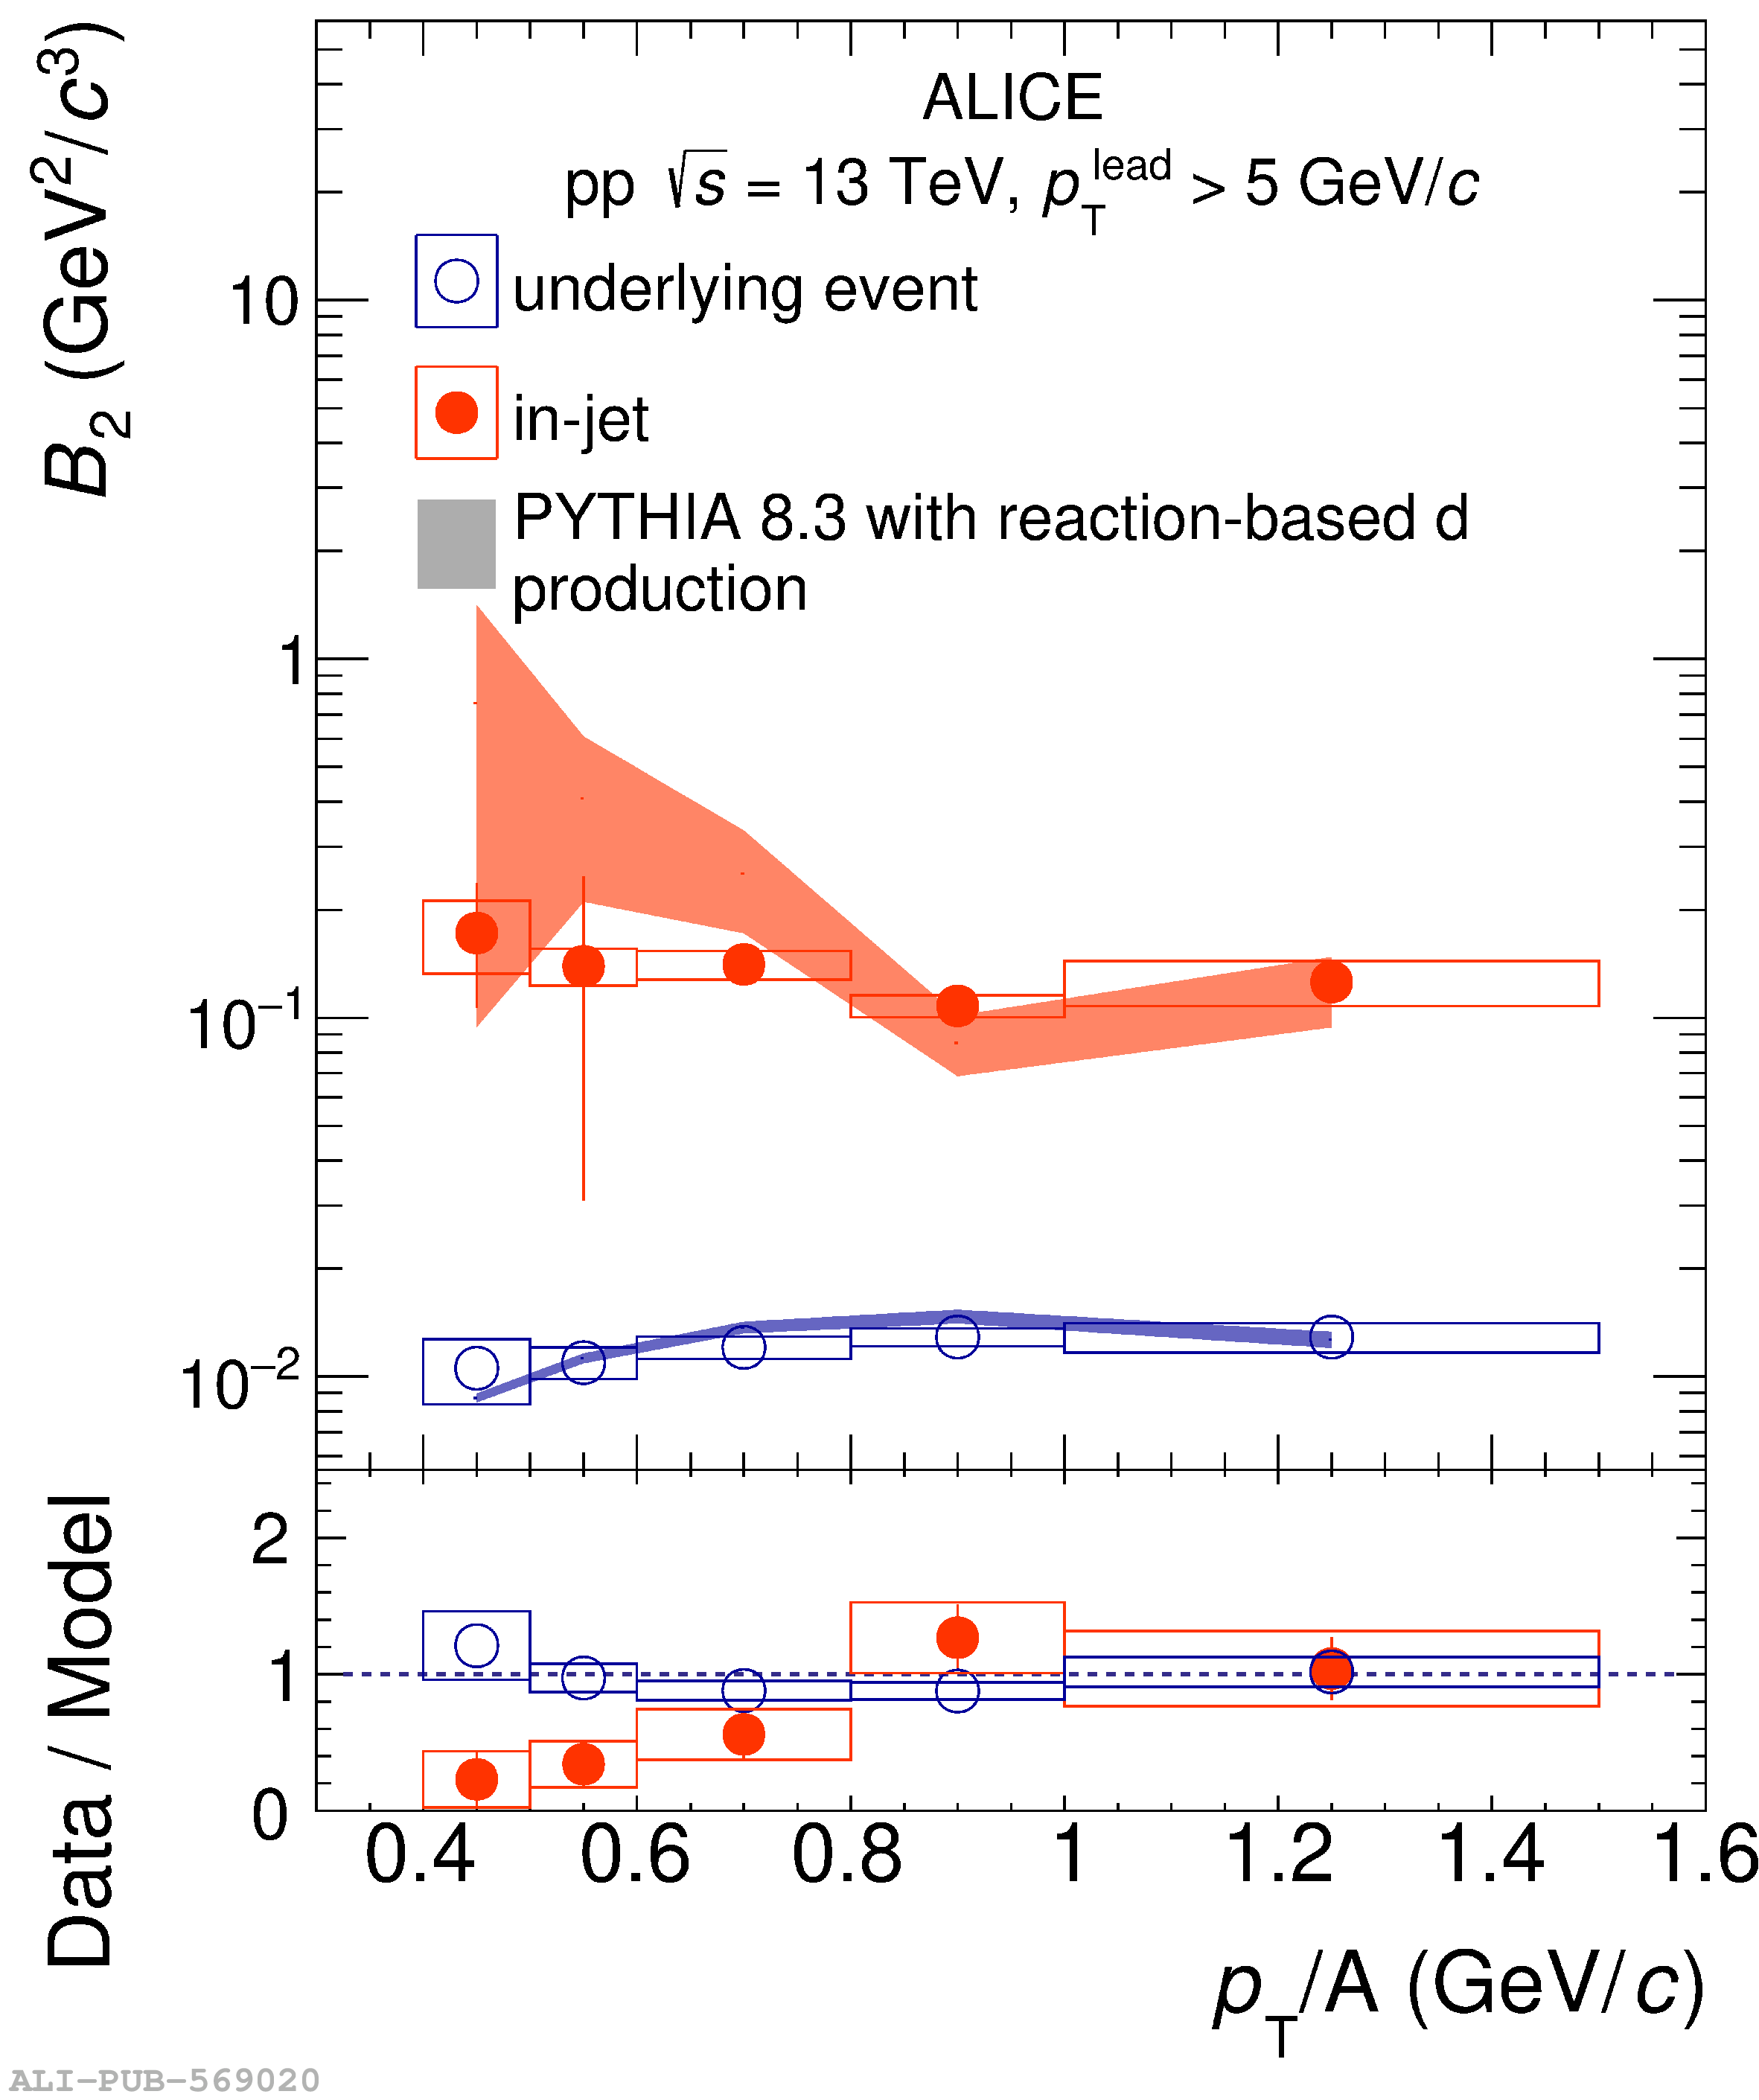 |