Average of deuteron and antideuteron $\pt$-differential yields in the three azimuthal regions (on the left) and in jets (on the right), measured in pp collisions at $\sqrt{s} = $ 13 TeV. Statistical and systematic uncertainties are represented by vertical bars and boxes, respectively. On the right, shaded (blue) boxes show the uncertainty on the results from Ref. [22] related to the subtraction of the uncorrelated background using the ZYAM method [69]. Individual Levy-Tsallis fits are also shown. | 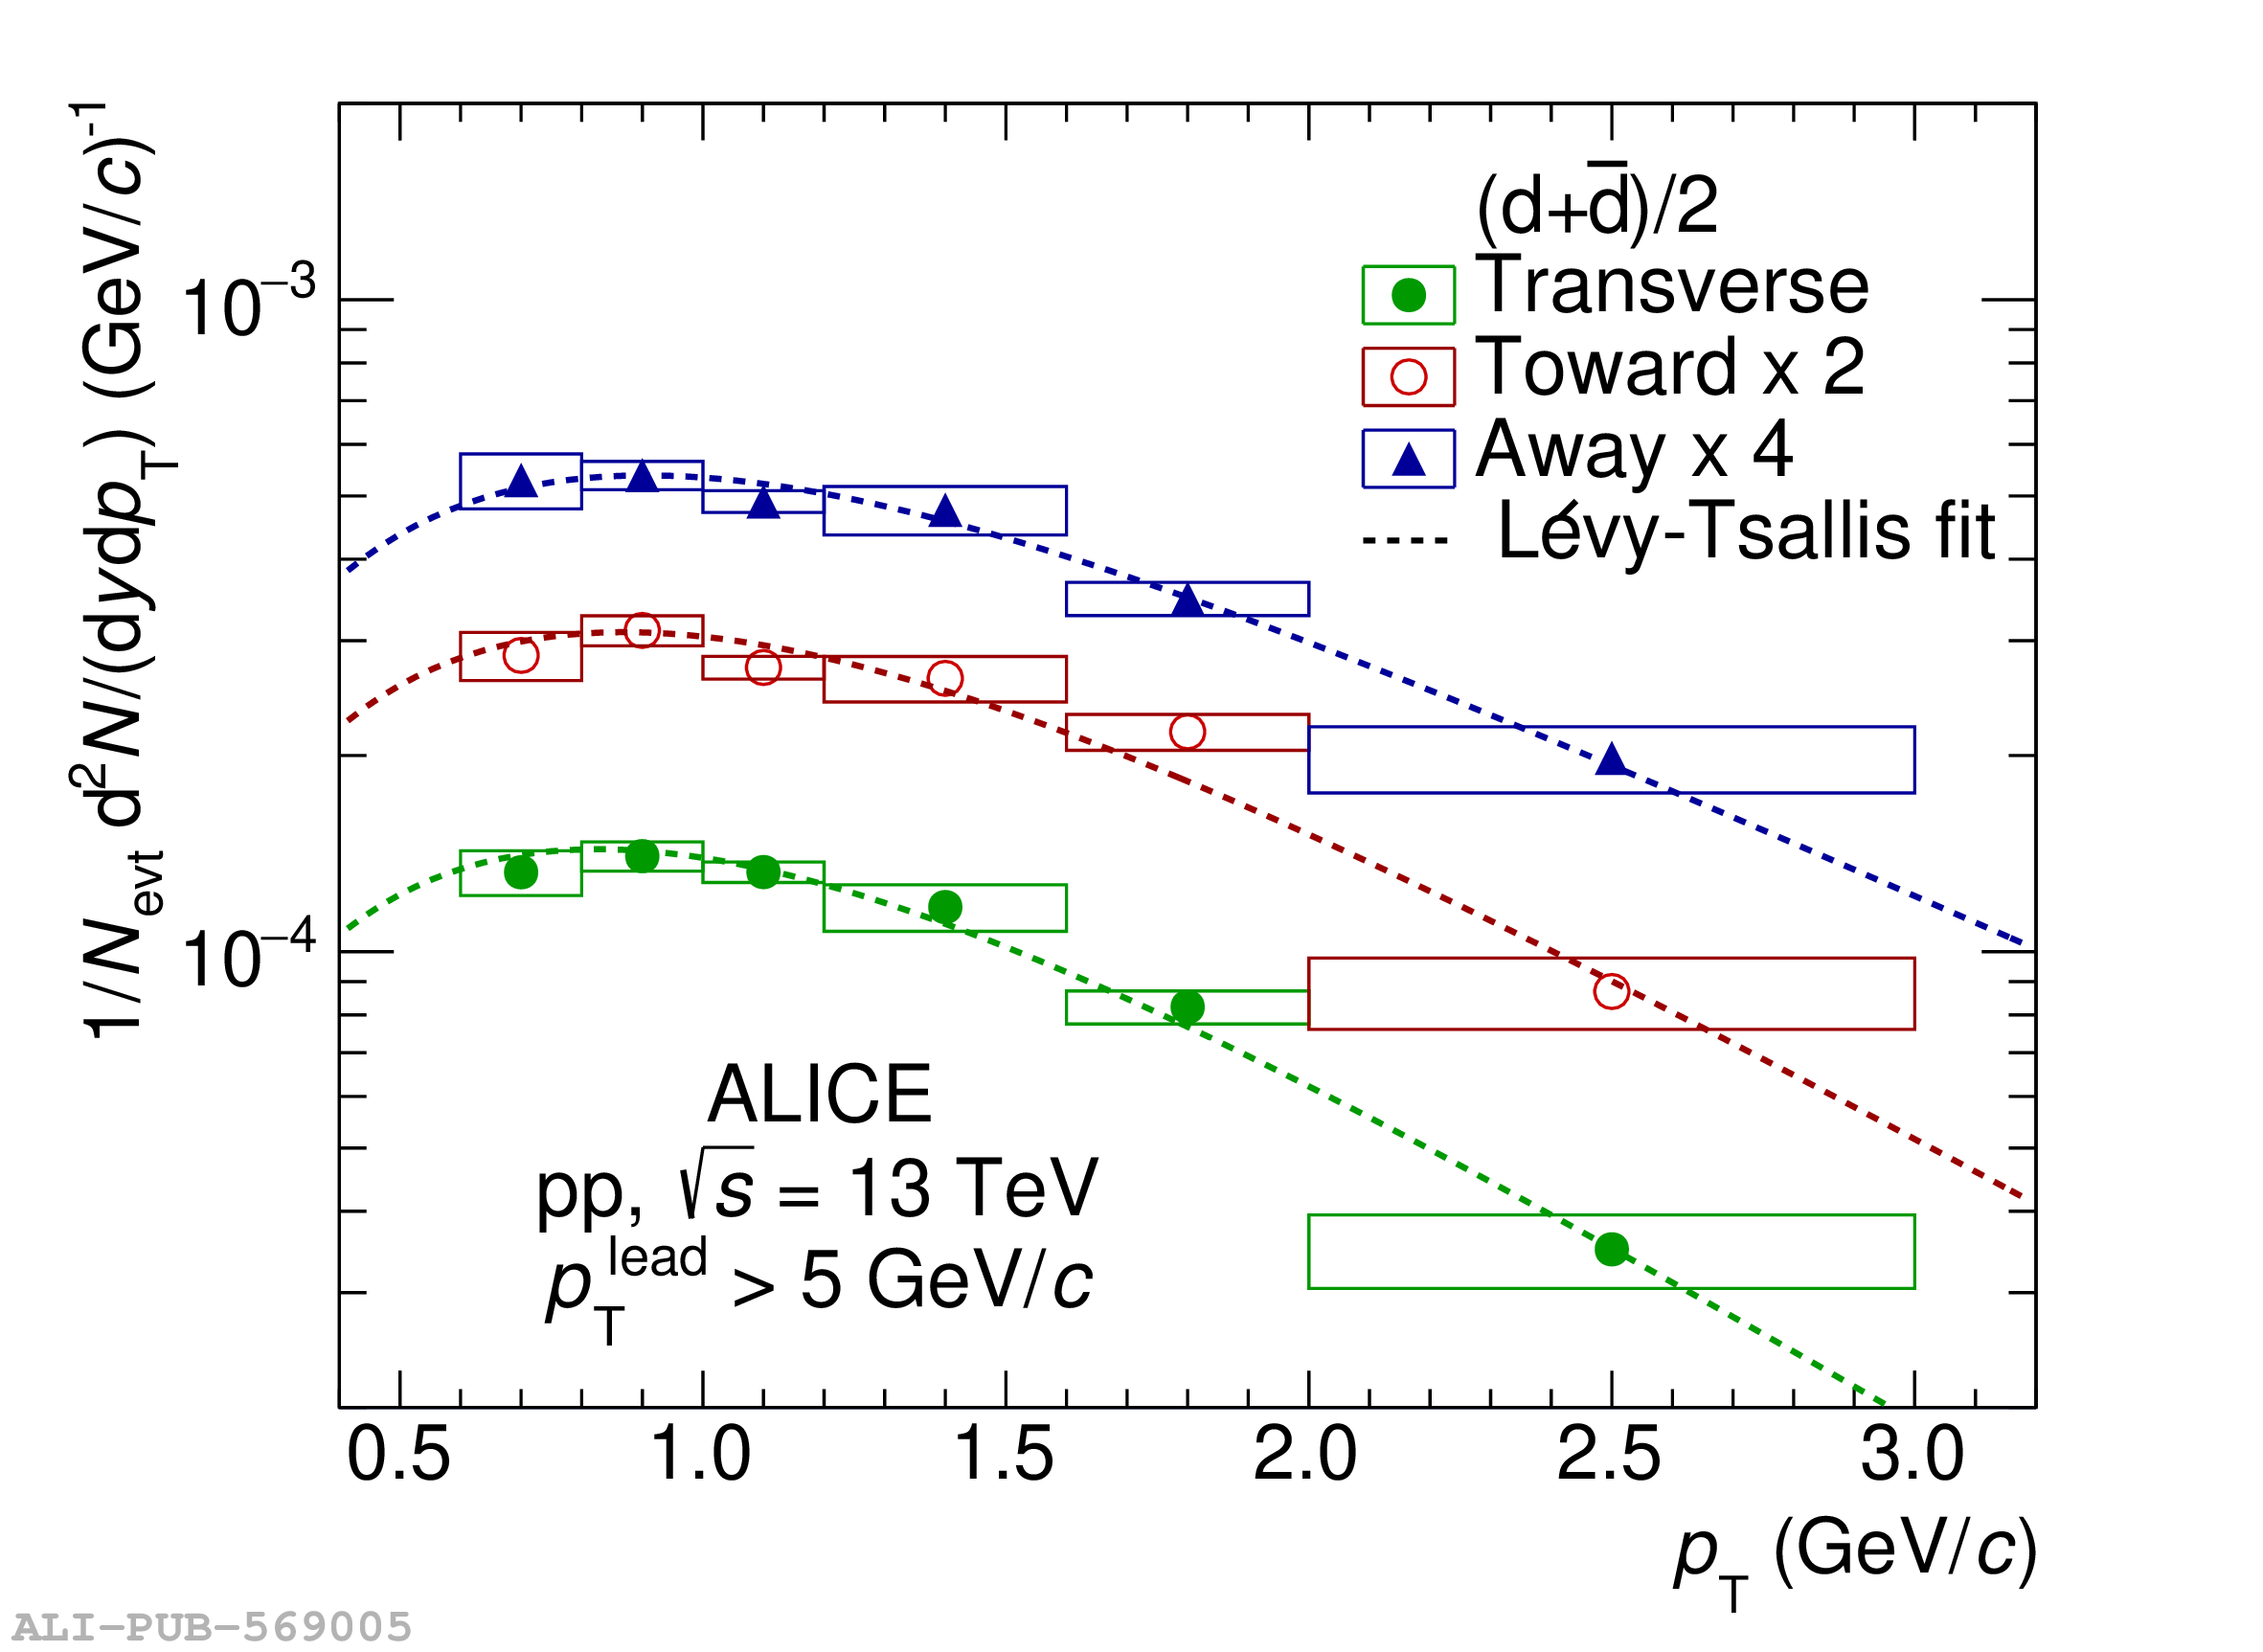 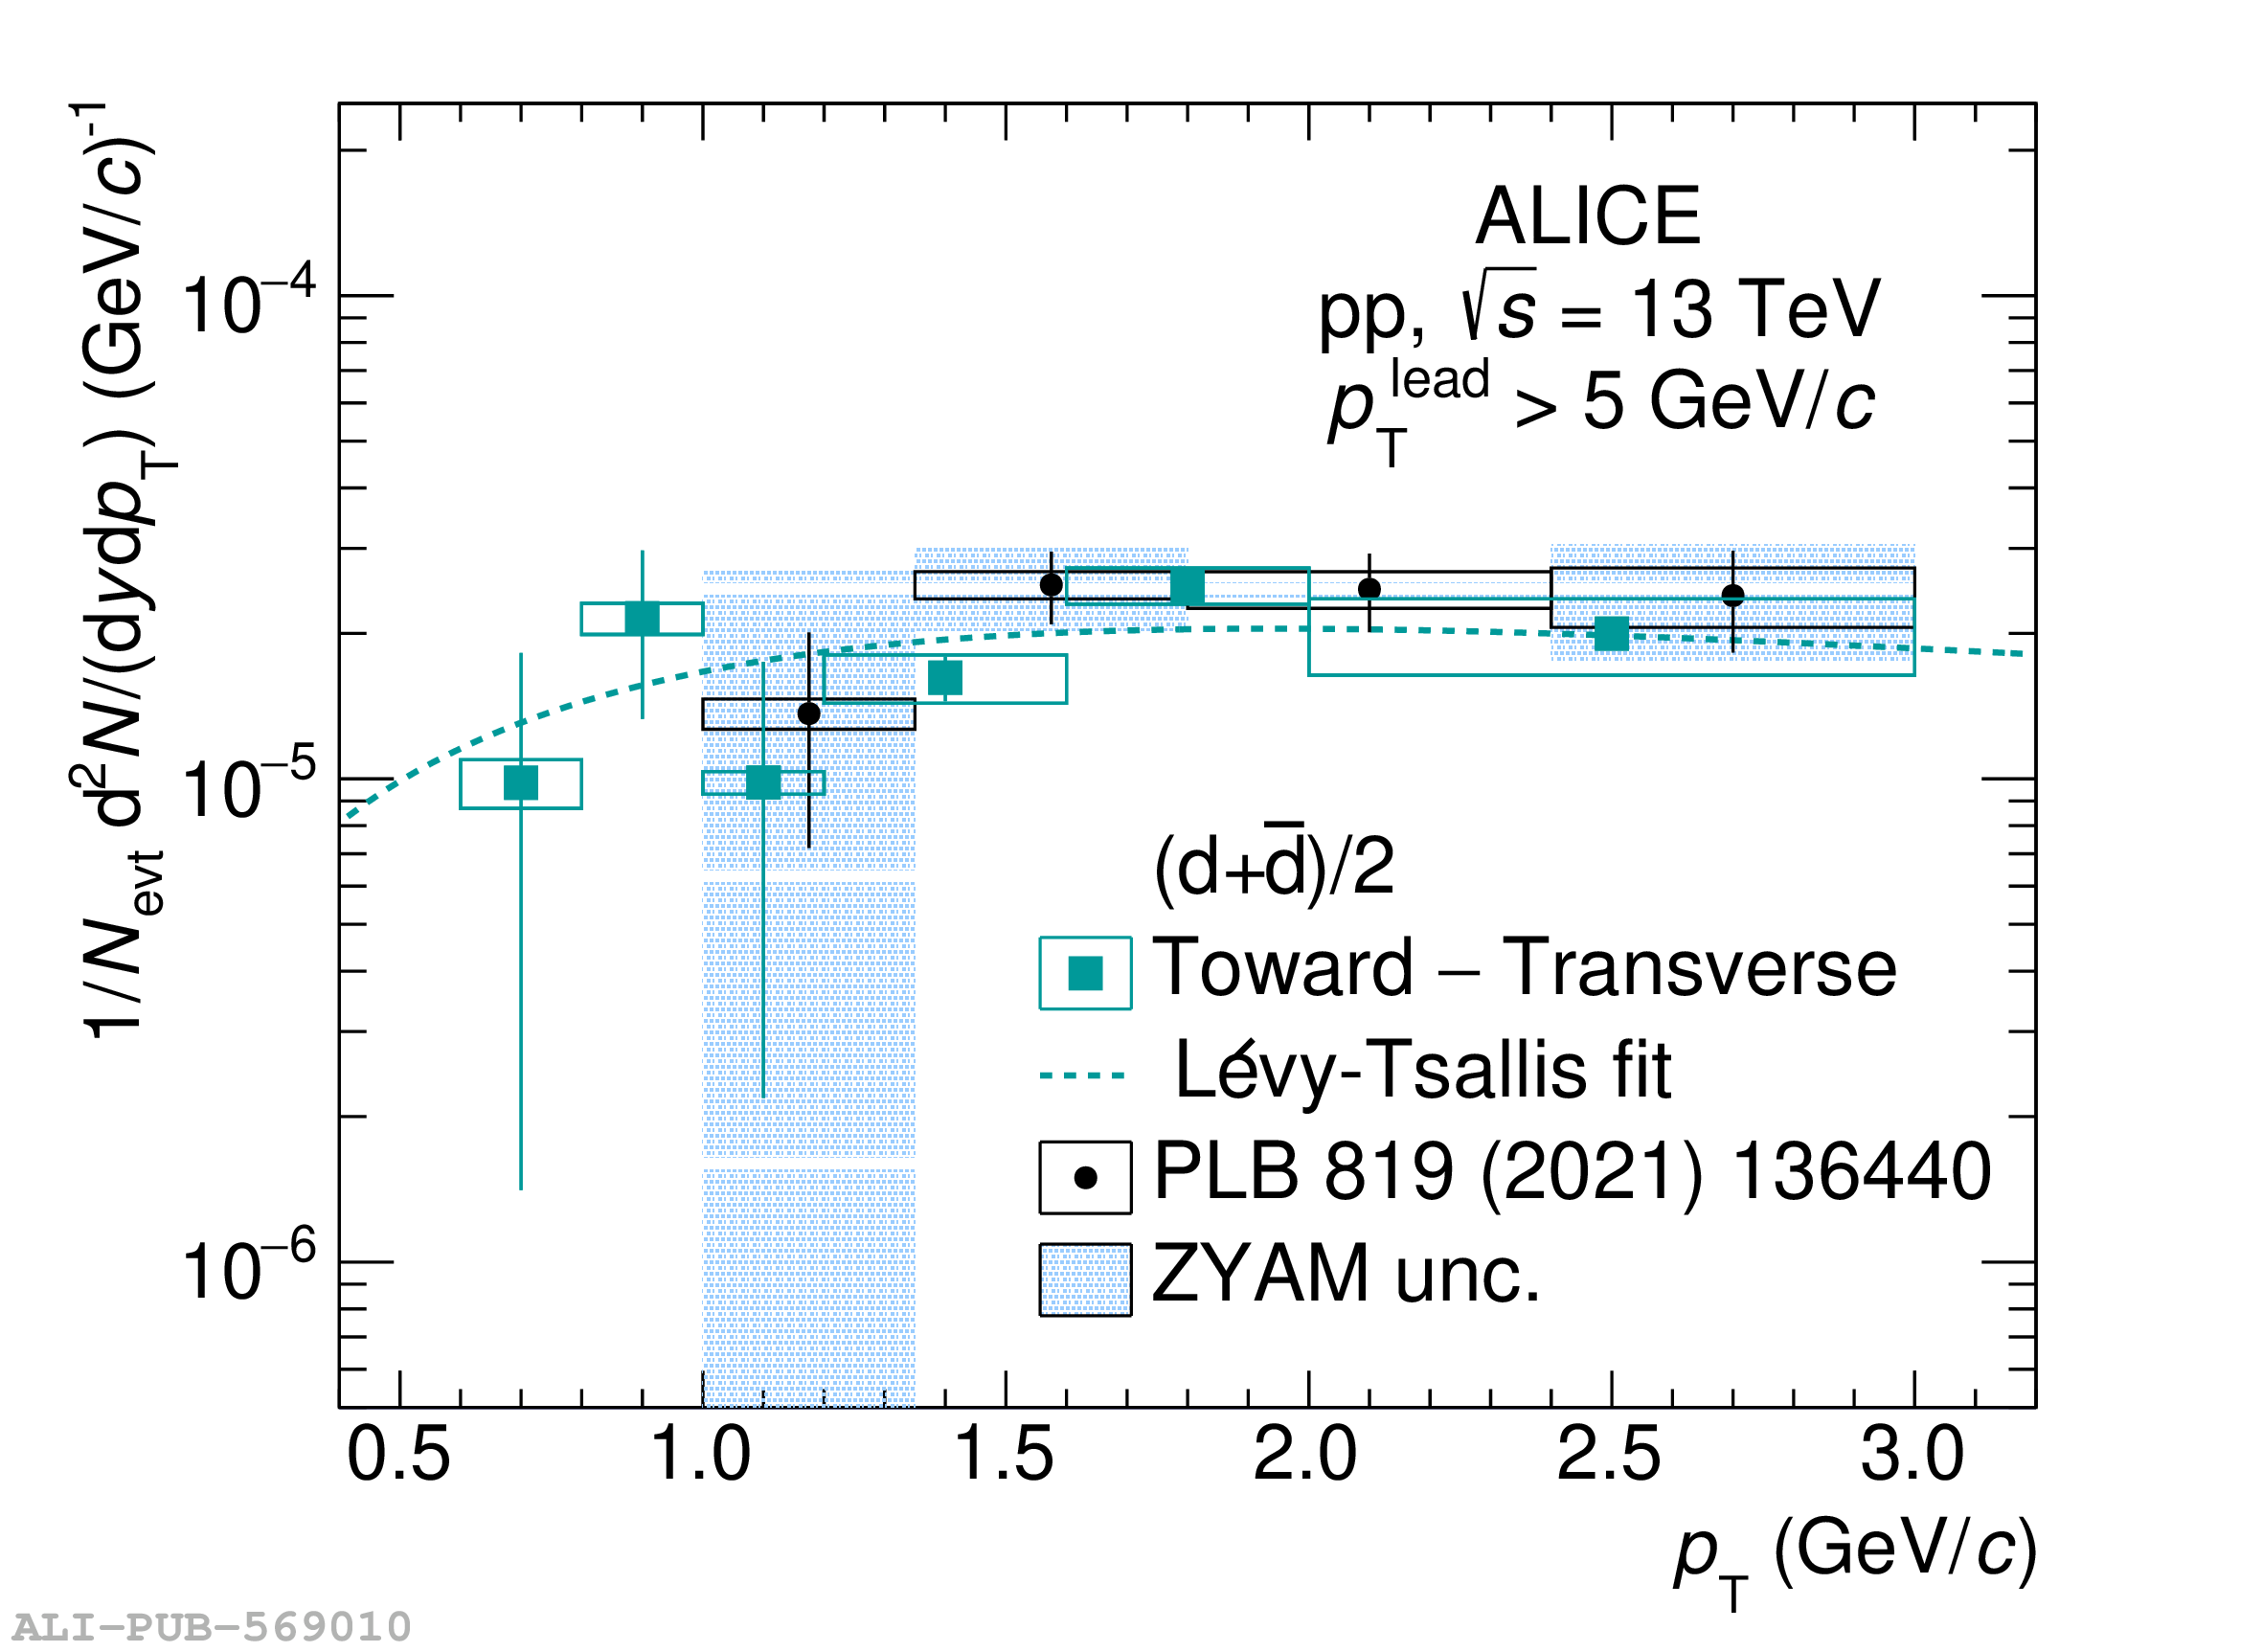 |