The inclusive J/$\psi$ meson production in Pb-Pb collisions at a center-of-mass energy per nucleon-nucleon collision of $\sqrt{s_{\rm NN}}$ = 5.02 TeV at midrapidity ($|y|$ <~ 0.9) is reported by the ALICE Collaboration. The measurements are performed in the dielectron decay channel, as a function of event centrality and J/$\psi$ transverse momentum $p_{\rm T}$, down to $p_{\rm T}$ = 0 GeV/$c$. The J/$\psi$ mean transverse momentum $\langle p_{\rm T} \rangle$ and $r_{\rm AA}$ ratio, defined as $\langle p^{\rm 2}_{\rm T} \rangle_{\rm PbPb}/\langle p^{\rm 2}_{\rm T} \rangle_{\rm pp}$, are evaluated. Both observables show a centrality dependence decreasing towards central (head-on) collisions. The J/$\psi$ nuclear modification factor $R_{\rm AA}$ exhibits a strong $p_{\rm T}$ dependence with a large suppression at high $p_{\rm T}$ and an increase to unity for decreasing $p_{\rm T}$. When integrating over the measured momentum range $p_{\rm T}$ <~ 10 GeV/$c$, the J/$\psi$ $R_{\rm AA}$ shows a weak centrality dependence. Each measurement is compared with results at lower center-of-mass energies and with ALICE measurements at forward rapidity, as well as to theory calculations. All reported features of the J/$\psi$ production at low $p_{\rm T}$ are consistent with a dominant contribution to the J/$\psi$ yield originating from charm quark (re)combination.
PLB 805 (2020) 135434
HEP Data
e-Print: arXiv:1910.14404 | PDF | inSPIRE
CERN-EP-2019-234
Figure 1
Top panels: Invariant mass distribution of opposite-sign pairs from the same event and mixed events for the $0$--$10$\% (left) and $60$--$90$\% (right) centrality classes in \PbPb collisions at $\snn = 5.02$ TeV. Bottom panels: Background-subtracted invariant mass distributions in comparison with the expected Monte Carlo signal shape. | 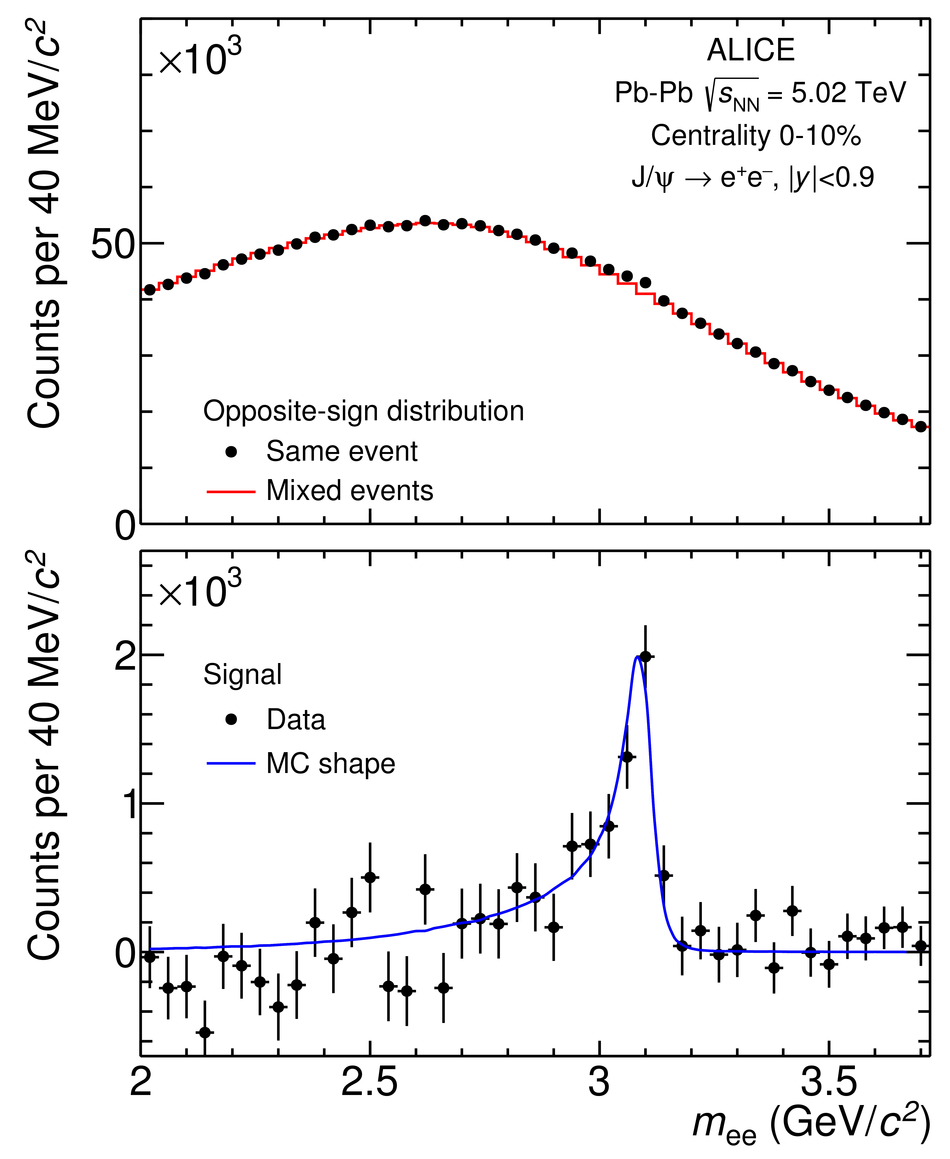 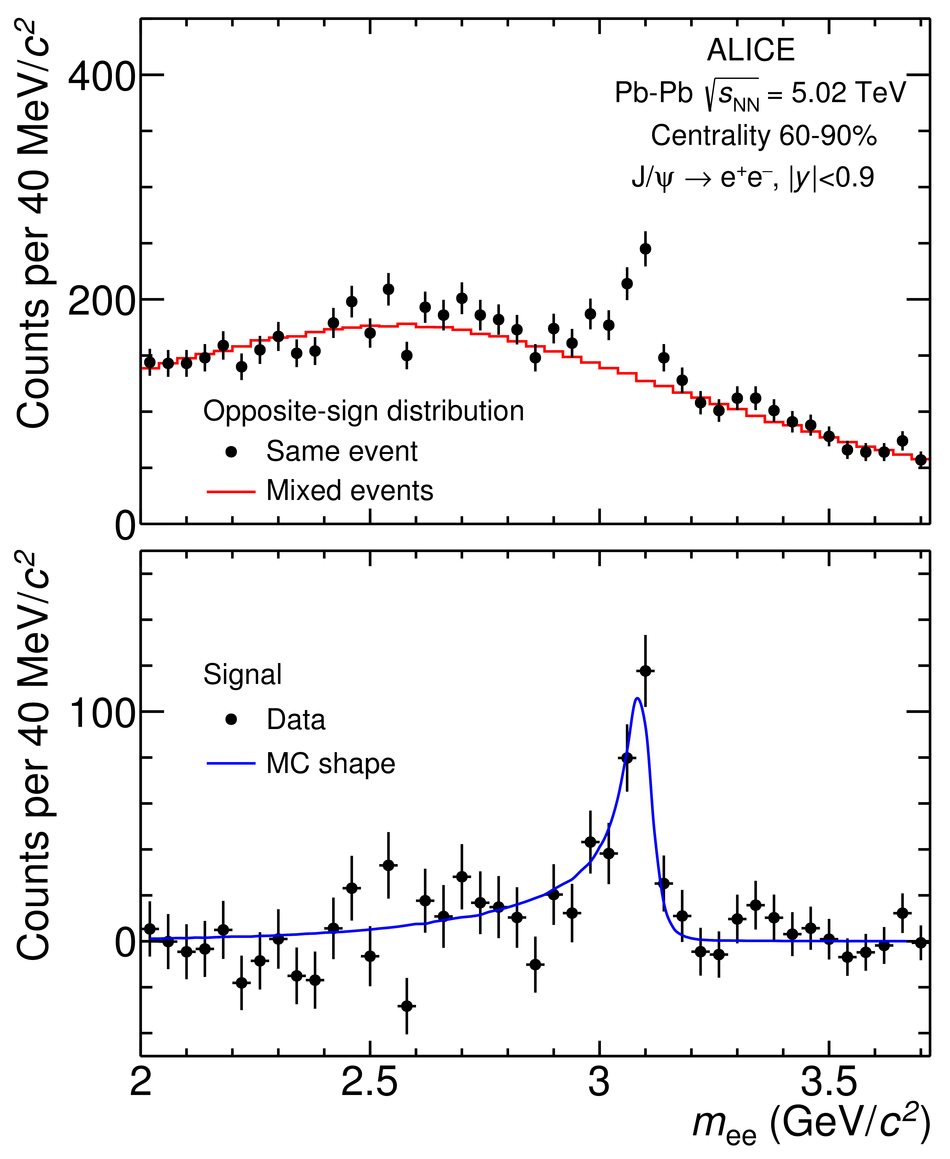 |
Figure 2
Extraction of the $\jpsi$ $\MeanPt$ in $\PbPb$ collisions at $\snn = 5.02$ TeV for the $0$--$10$\% (left) and $60$--$90$\% (right) centrality classes in the transverse momentum interval $0.15< \pt< 10 $\GeVc. The background, obtained from event-mixing, is shown by the red line. | 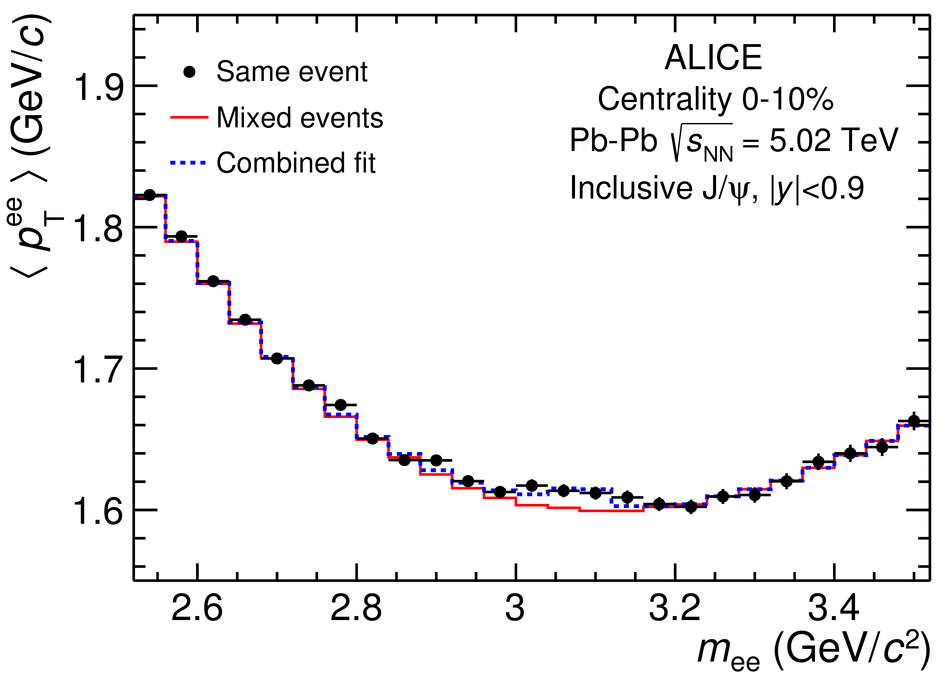 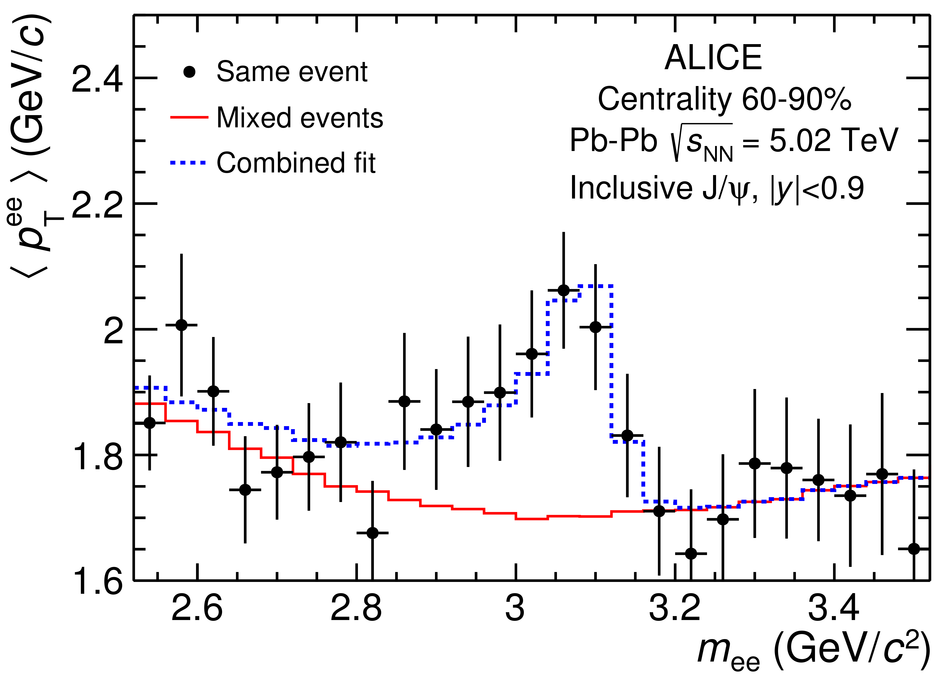 |
Figure 3
Left panel: Transverse momentum dependence of the $\jpsi$ production yields in $\PbPb$ collisions at $\snn = 5.02$ TeV at midrapidity in the centrality intervals $0$--$20$\%, $20$--$40$\%, and $40$--$90$\%. Right panel: Comparison of the $\pt$ distribution in the centrality interval $0$--$20$\% with models . | 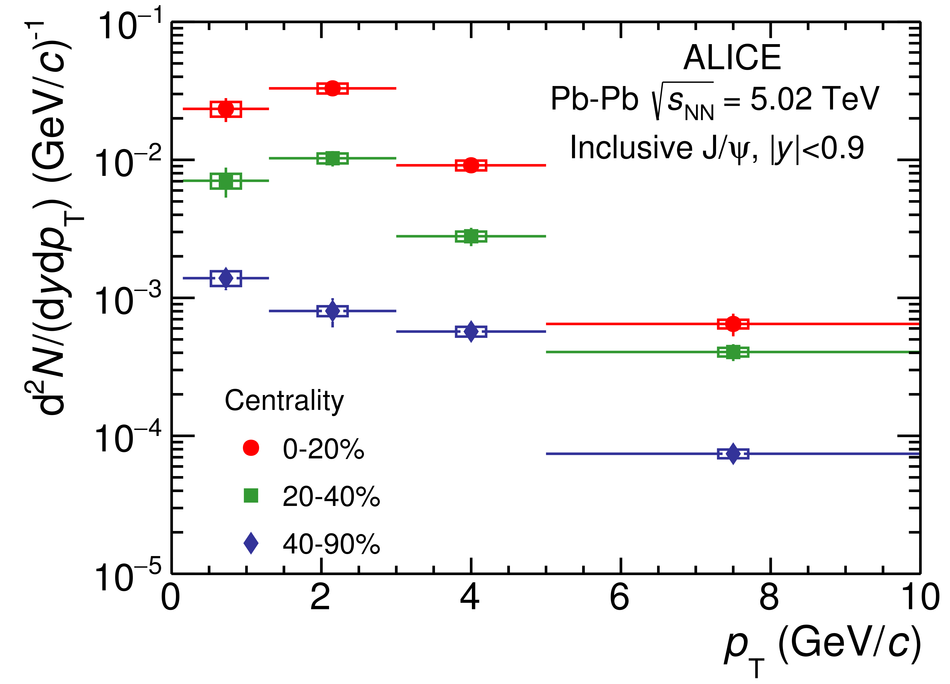 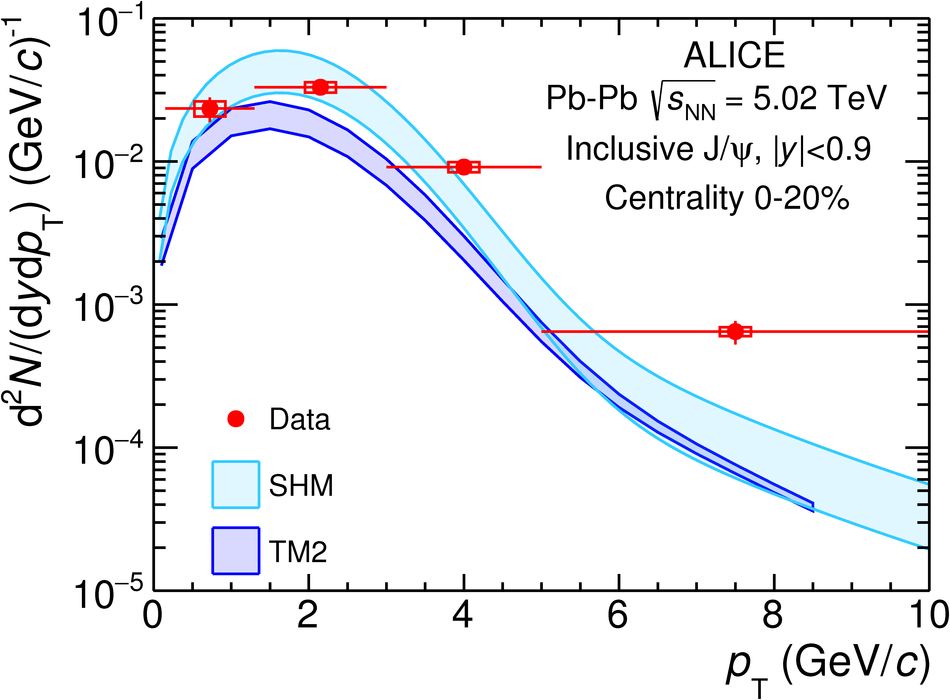 |
Figure 4
$\jpsi$ $\MeanPt$ (left) and $\raa$ (right) at midrapidity as a function of the mean number of participant nucleons $\AvgNpart$. The ALICE measurements at $\snn = 5.02$ TeV are compared with previous results in $\pp$ and $\PbPb$ collisions at $2.76$ TeV , $\PbPb$ collisions at $5.02$ at forward rapidity , and with those at lower collision energies at SPS and RHIC . The red box around unity at $\Npart \approx 400$ in the right panel indicates the correlated uncertainty of the ALICE data points due to the $\MeanPtSq$ in $\pp$ collisions. | 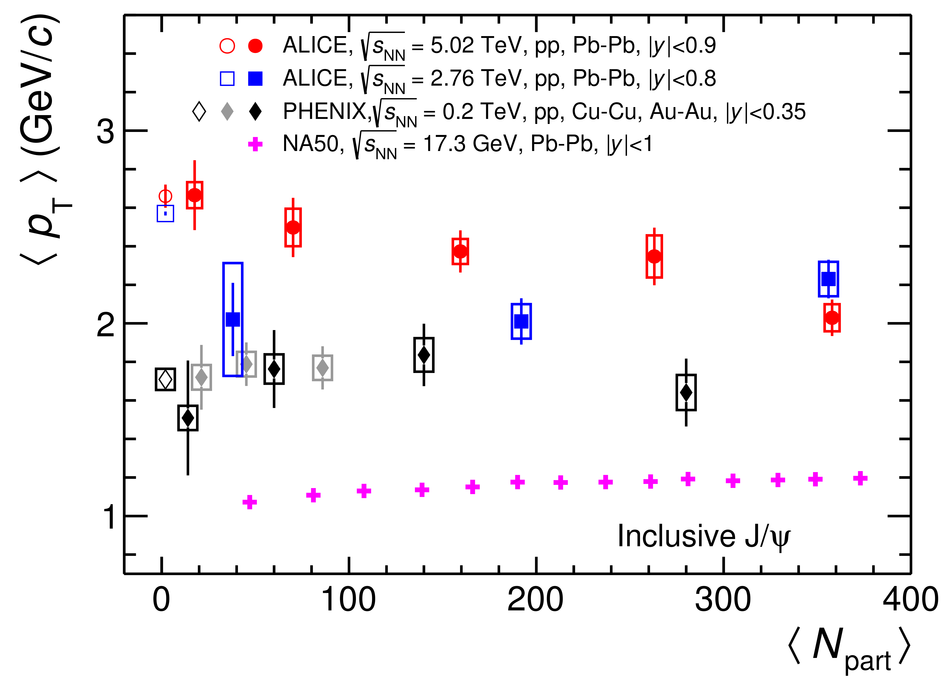 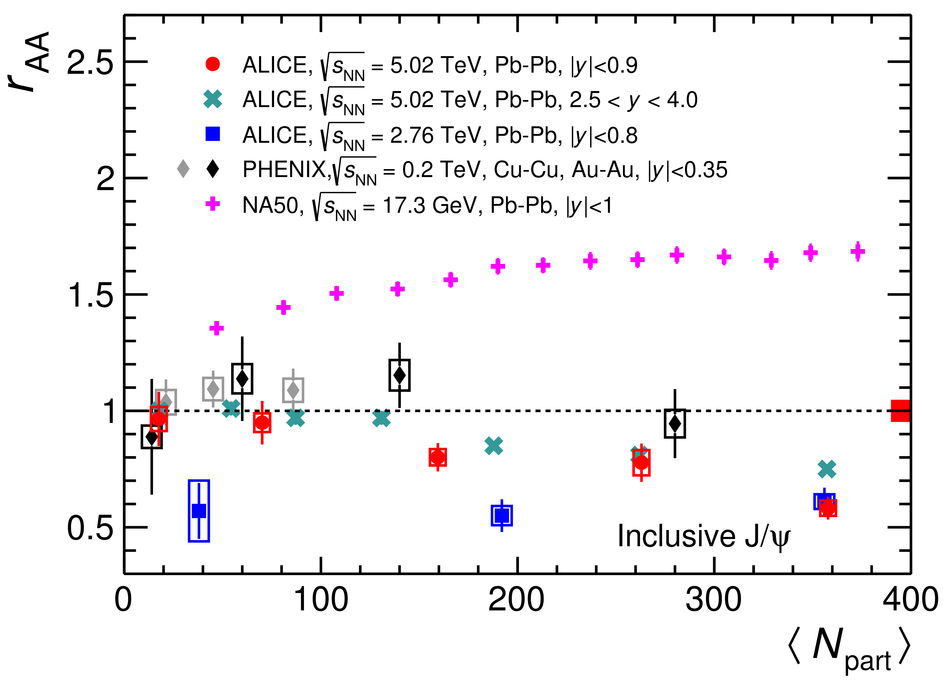 |
Figure 5
Inclusive $\jpsi$ $\MeanPt$ (left) and $\raa$ (right) in $\pp$ and $\PbPb$ collisions at $\snn = 5.02$ TeV at midrapidity as a function of the mean number of participating nucleons. The ALICE results are compared with calculations from the transport models and the SHM . The colored bands represent model uncertainties. As in Figure \ref{Fig:MPtEnergy}, the red box around unity at $\Npart \approx 400$ in the right panel indicates the correlated uncertainty of the ALICE data points due to the $\MeanPtSq$ in $\pp$ collisions. |  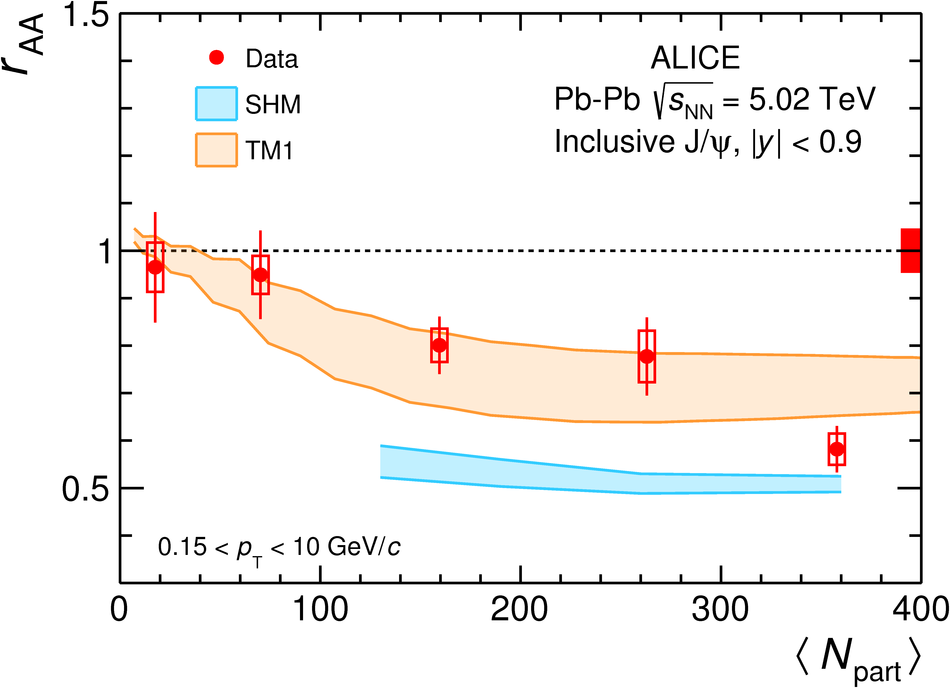 |
Figure 6
Inclusive $\jpsi$ nuclear modification factor at midrapidity, integrated over $\pt$, as a function of $\langle\npart\rangle$ in $\PbPb$ collisions at $\snn = 5.02$ TeV compared with results at $\snn = 2.76$ TeV (left panel) and with calculations from the CIM , SHM , TM1 and TM2 models (right panel). The yields in the left panel are shown without the low-$\pt$ cut-off in order to be able to compare with the lower energy data which are obtained for $\pt>0$. The calculations are shown as bands indicating the model uncertainties. Boxes around unity at $\Npart \approx 400$ in both panels indicate the correlated uncertainty of the data points due to the cross section in $\pp$ collisions. | 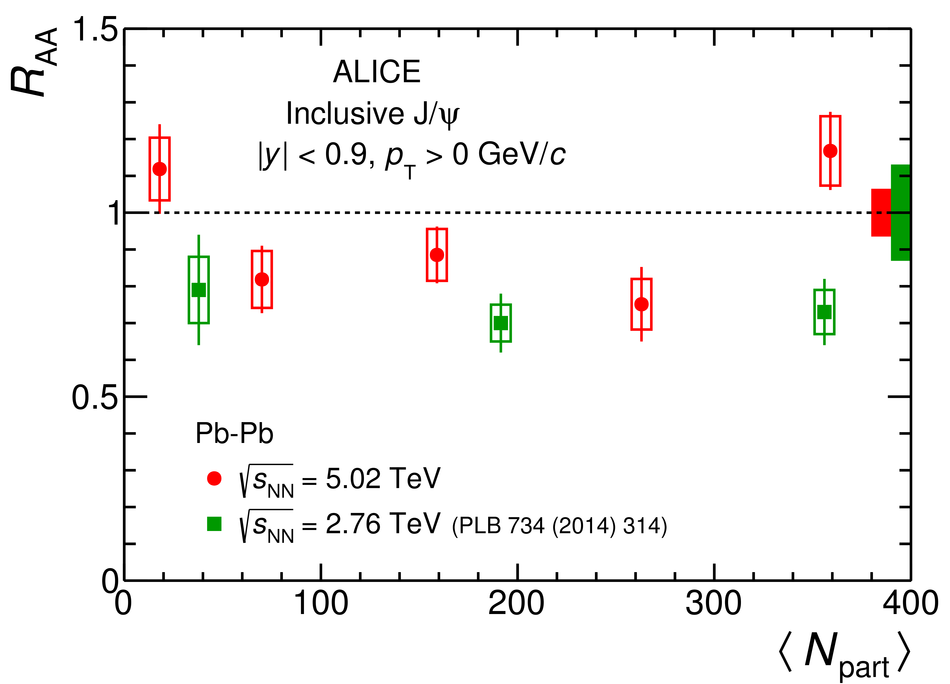  |
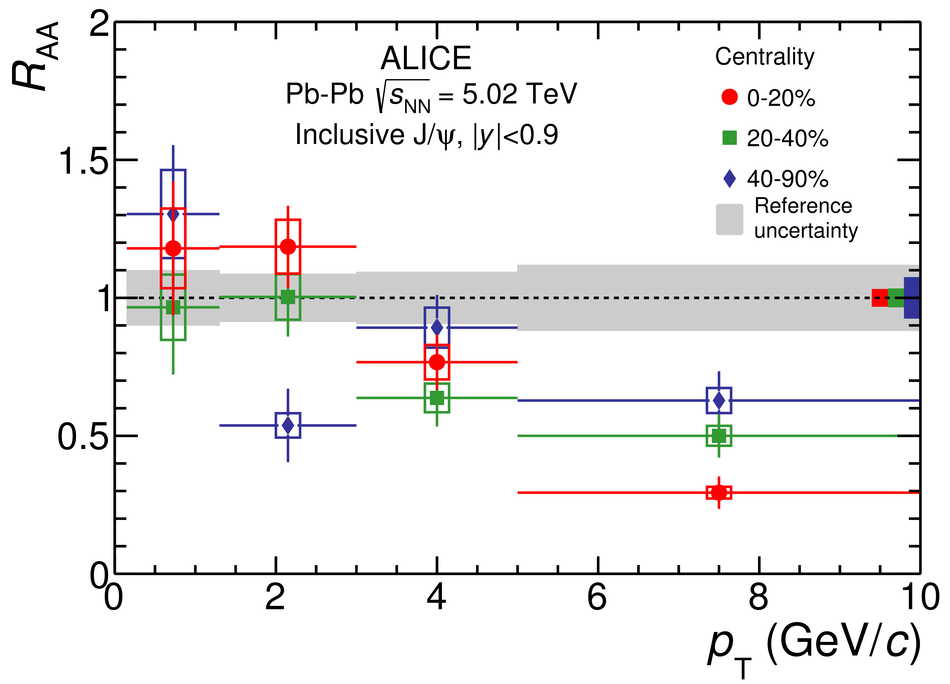
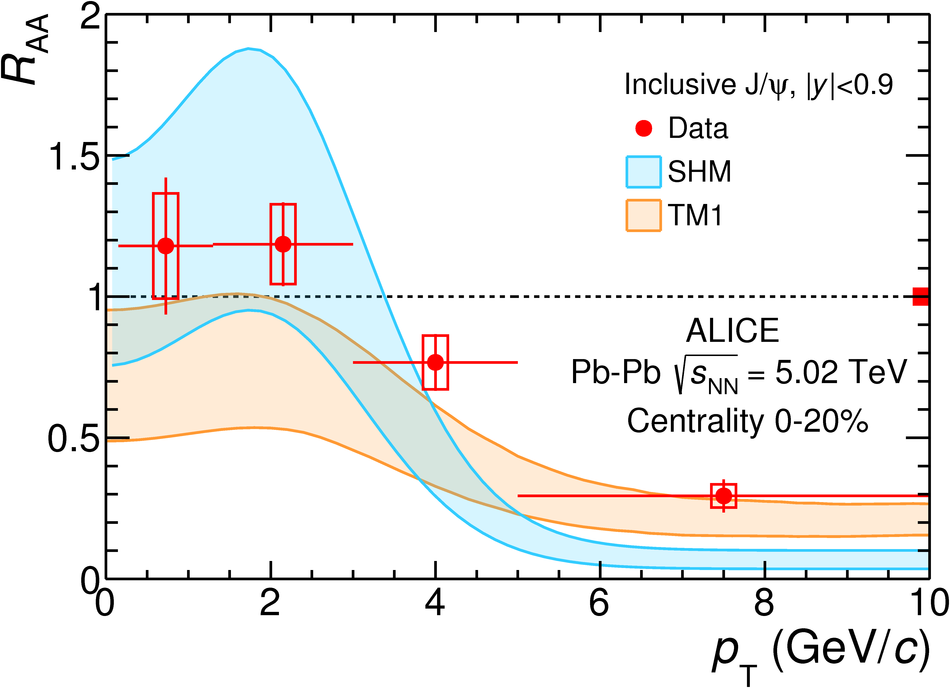
Figure 8
Left: Inclusive $\jpsi$ $\Raa$ in the $20$\% most central $\PbPb$ collisions at $\snn = 5.02$ TeV as a function of $\pt$, at midrapidity and at forward rapidity . Right: Rapidity dependence of the inclusive $\jpsi$ $\Raa$ in the centrality interval $0$--$90$\%. The error bars represent statistical uncertainties, while the boxes around the data points represent systematic uncertainties. The boxes around unity represent global uncertainties on the $\pp$ reference due to normalization and $\langle\TAA\rangle$. In the right panel, the correlated uncertainty of the point at midrapidity is included in the box around the data point. | 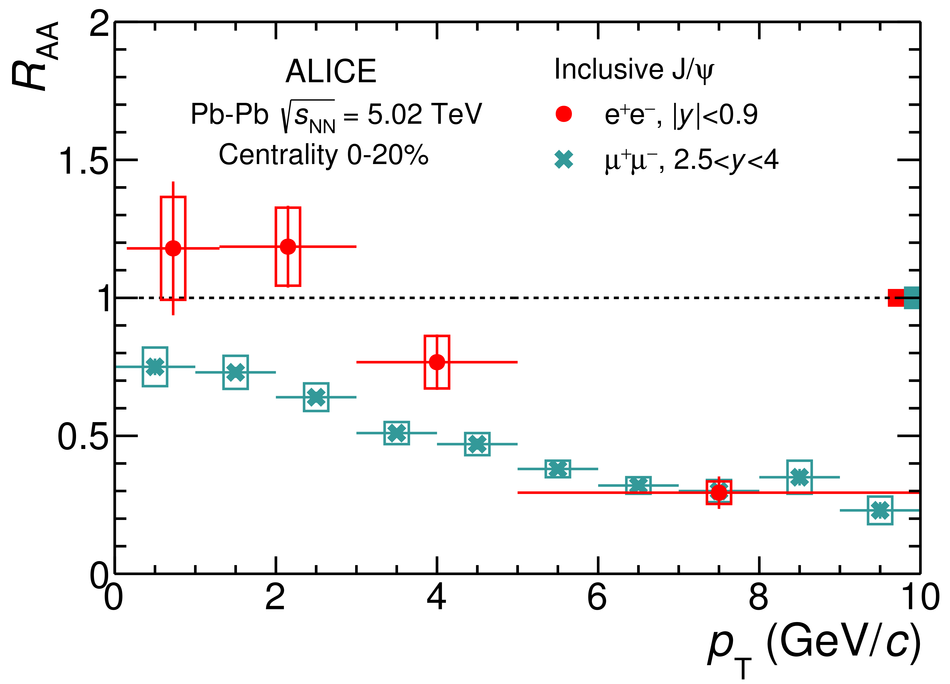 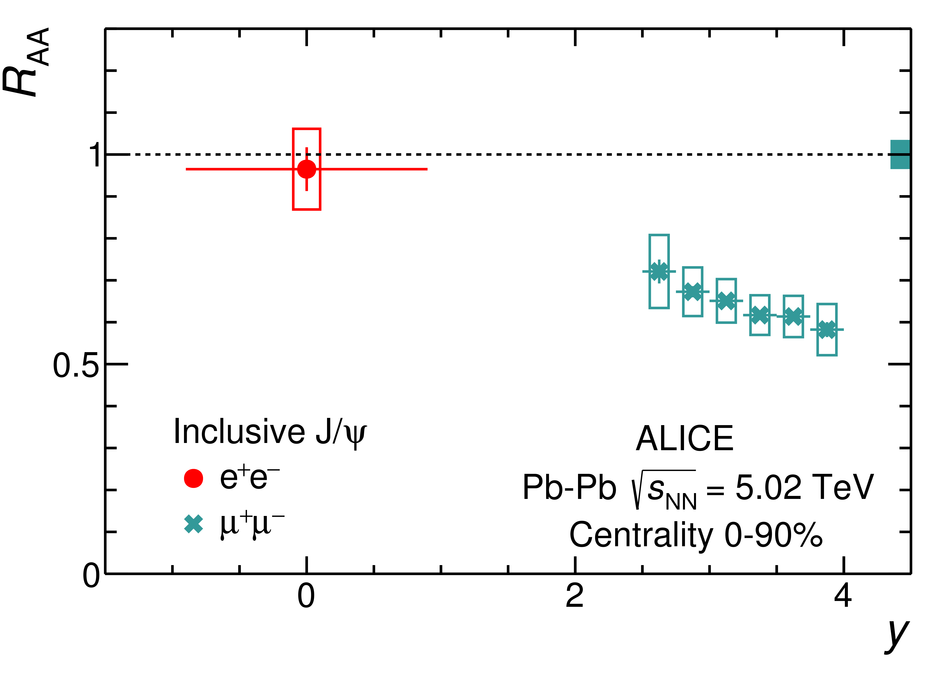 |