Inclusive $\jpsi$ $\MeanPt$ (left) and $\raa$ (right) in $\pp$ and $\PbPb$ collisions at $\snn = 5.02$ TeV at midrapidity as a function of the mean number of participating nucleons. The ALICE results are compared with calculations from the transport models and the SHM . The colored bands represent model uncertainties. As in Figure \ref{Fig:MPtEnergy}, the red box around unity at $\Npart \approx 400$ in the right panel indicates the correlated uncertainty of the ALICE data points due to the $\MeanPtSq$ in $\pp$ collisions. |  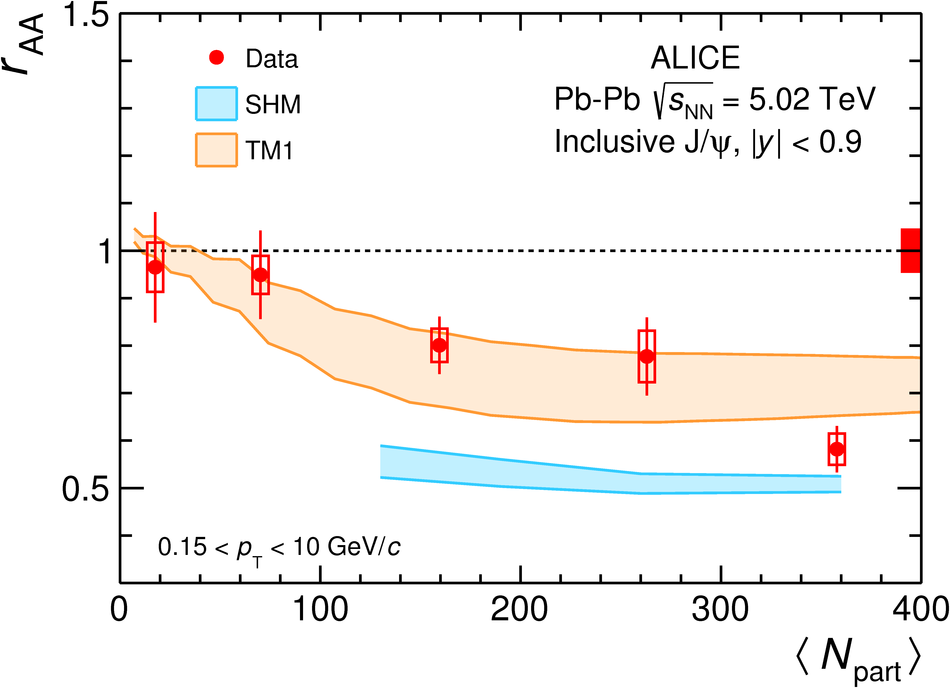 |