The transverse momentum ($p_{\rm{T}}$) differential yields of (anti-)$^3$He and (anti-)$^3$H measured in p-Pb collisions at $\sqrt{s_{\rm{NN}}}$ = 5.02 TeV with ALICE at the Large Hadron Collider (LHC) are presented. The ratios of the $p_{\rm{T}}$-integrated yields of (anti-)$^3$He and (anti-)$^3$H to the proton yields are reported, as well as the $p_{\rm{T}}$ dependence of the coalescence parameters $B_3$ for (anti-)$^3$He and (anti-)$^3$H. For (anti-)$^3$He, the results obtained in four classes of the mean charged-particle multiplicity density are also discussed. These results are compared to predictions from a canonical statistical hadronization model and coalescence approaches. An upper limit on the total yield of $^4\bar{\mathrm{He}}$ is determined.
Phys. Rev. C 101 (2020) 044906
HEP Data
e-Print: arXiv:1910.14401 | PDF | inSPIRE
CERN-EP-2019-246
Figure 1
The distribution of the specific ionization energy loss (\dEdx) in the TPC of the candidate tracks compared to the expected value for $^3$He or $^3$H ($n_\sigma^\mathrm{TPC}$) in the \pt range of 1.5 $\leq\pt < 2.0$ GeV/$c$ and 2.0 GeV/$c$ $\le \pt < 2.5$ GeV/$c$ for $^3$He (left panel) and $^3$H (right panel), respectively. The background, which is visible as a slope on the left side of the signal, is fitted with a Gaussian function shown in red to estimate the contamination. | 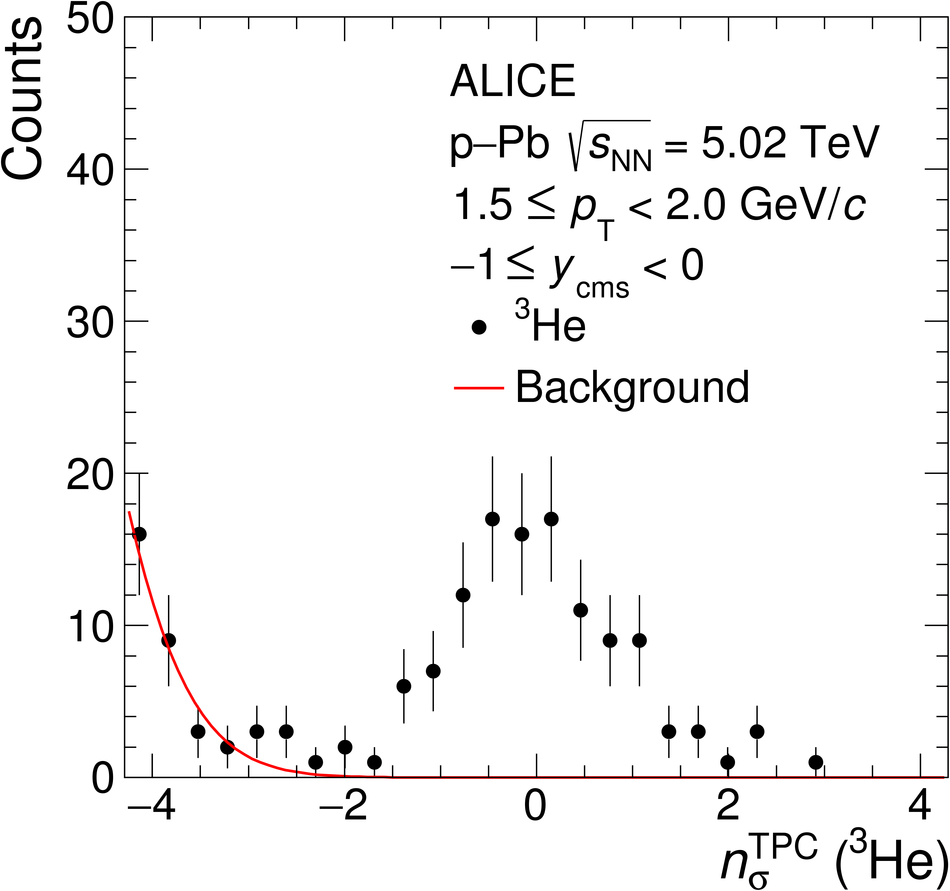 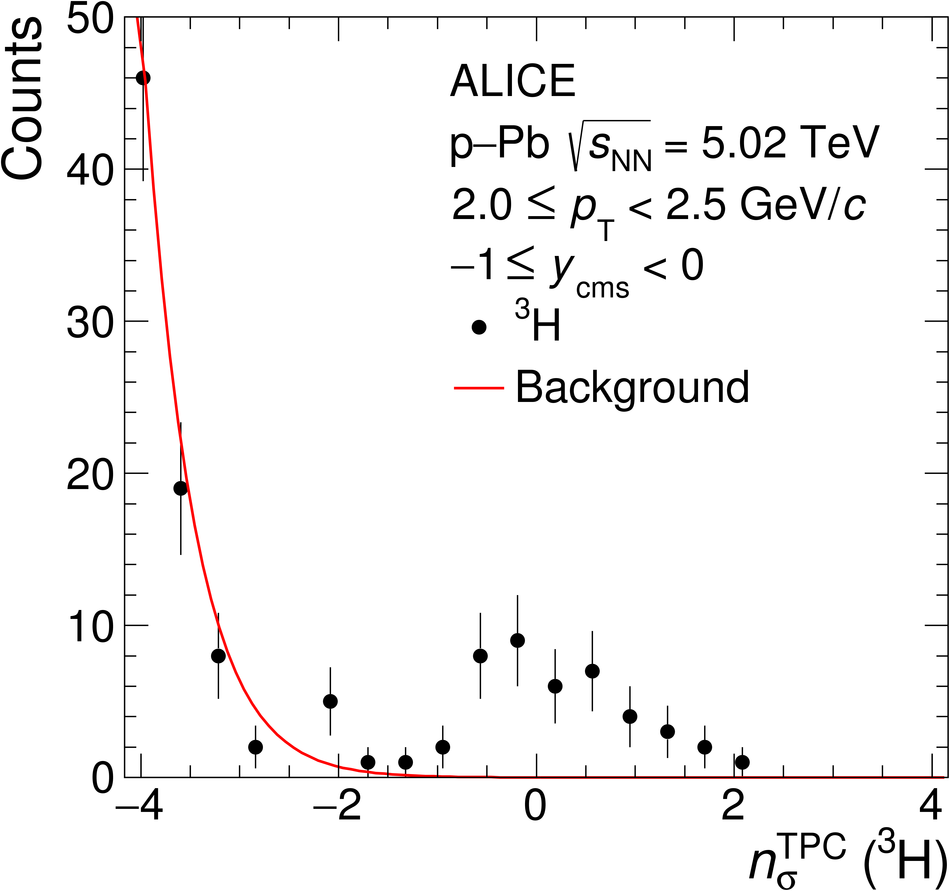 |

Figure 4
\pt spectra of (anti-)$^3$He (left) and (anti-)$^3$H (right) measured in $\mathrm{INEL}>0$ p--Pb collisions at $\energy = 5.02$ TeV. The bottom panels show the corresponding antiparticle-to-particle ratios as a function of \pt. Statistical and systematic uncertainties are indicated by vertical bars and boxes, respectively. | 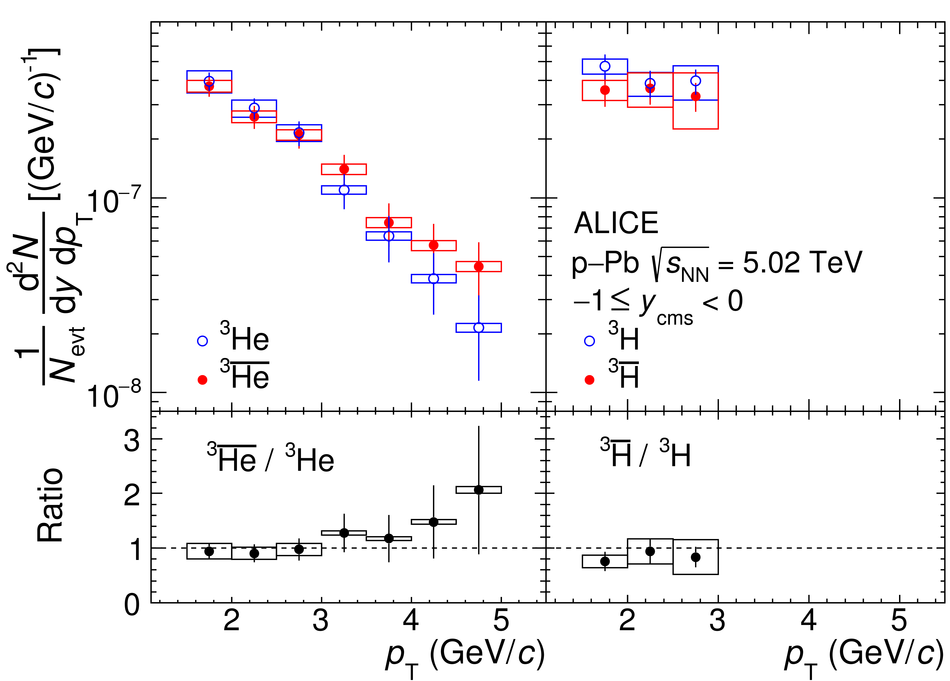 |
Figure 5
Transverse momentum spectra obtained from the average of $^3$He and $^3\overline{\mathrm{He}}$ for four different multiplicity classes and $\mathrm{INEL}>0$ events in p--Pb collisions at $\energy = 5.02$ TeV. Different scaling factors are used for better visibility. Statistical and systematic uncertainties are indicated by vertical bars and boxes, respectively. | 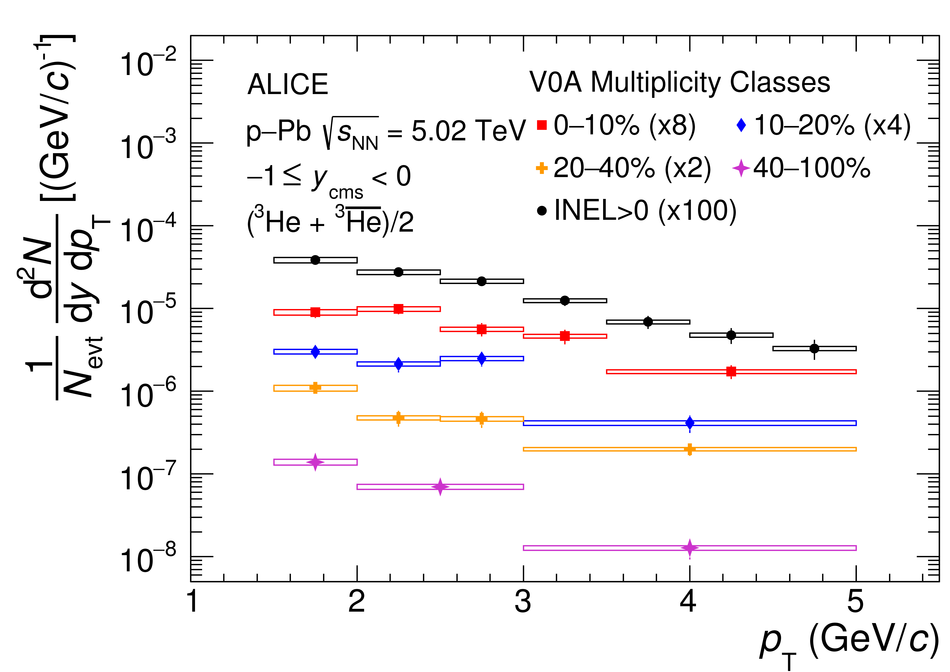 |
Figure 6
Left: Mean transverse momentum of (anti-)$^3$He as a function of the mean charged-particle multiplicity density in p--Pb collisions at $\energy = 5.02$ TeV. Statistical and systematic uncertainties are indicated by vertical bars and boxes, respectively. The published results from pp and Pb--Pb collisions are shown with diamonds and rectangles, respectively Right: Mean transverse momentum measured in p--Pb collisions at $\energy = 5.02$ TeV as a function of the particle mass is shown for different mean charged-particle multiplicity densities. The linear scaling with the mass found for the results for $\pi$, K, p, $\Lambda$ , $\Xi$, and $\Omega$ is indicated by dashed lines. The deuteron $\langle p_{\mathrm{T}}\rangle$ is taken from . | 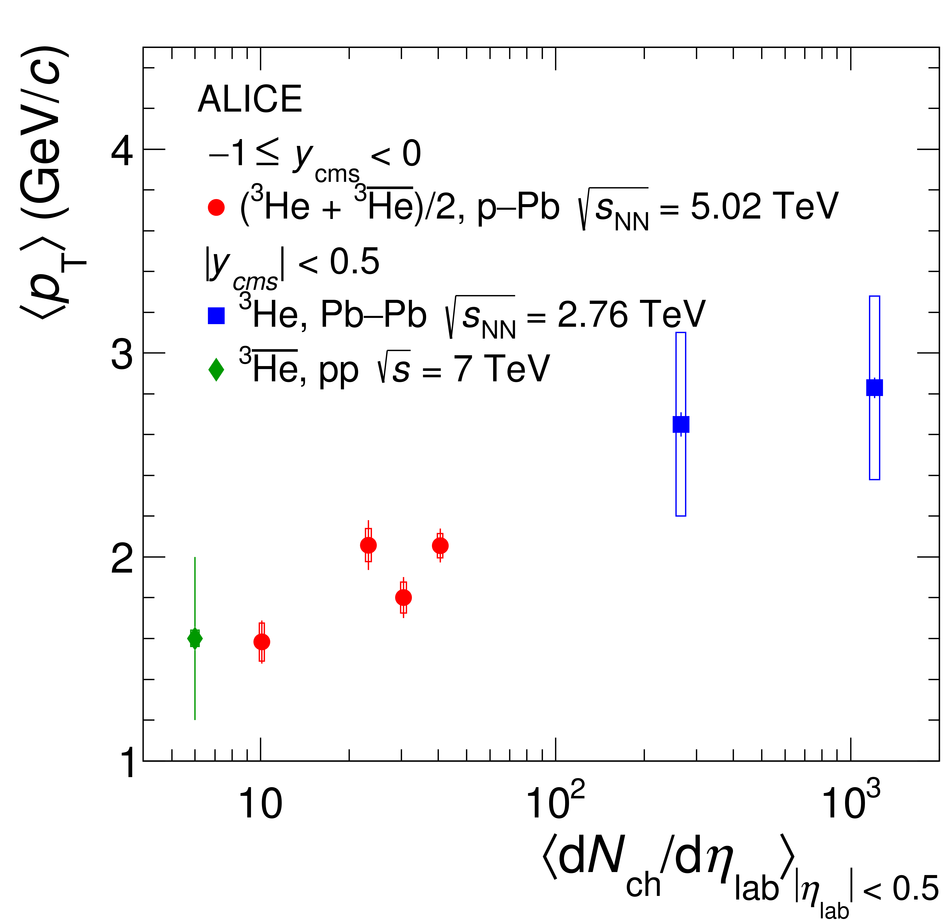 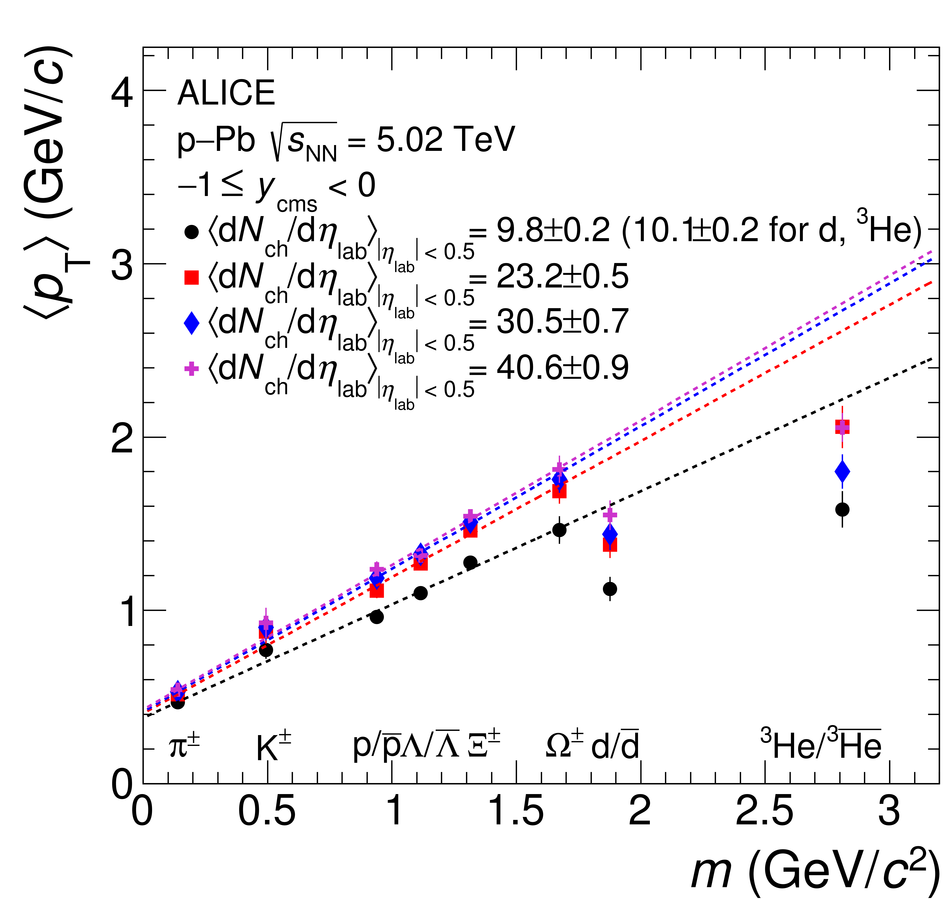 |
Figure 7
$^3$He/p ratio in pp, p--Pb, and Pb--Pb collisions as a function of the mean charged-particle multiplicity density, together with the $^3$H/p ratio. Statistical and systematic uncertainties are indicated by vertical bars and boxes, respectively. The expectations for the canonical statistical hadronization model (Thermal-FIST ) and two coalescence approaches are shown. For the thermal model, two different values of the correlation volume are displayed The uncertainties of the coalescence calculations, which are due to the theoretical uncertainties on the emission source radius, are denoted as shaded bands. |  |
Figure 8
Top: The coalescence parameter $B_3$ calculated using the average of $\mathrm{INEL}>0$ $^3$He and $^3\overline{\mathrm{He}}$ yields is shown together with the corresponding result for the average of the $^3$H and $^3\overline{\mathrm{H}}$ yields Bottom: The $^3$H/$^3$He yield ratio is shown together with the expectation values from three coalescence approaches . The uncertainties of the coalescence calculations, which are due to the theoretical uncertainties on the emission source radius, are denoted as shaded bands Statistical and systematic uncertainties are indicated by vertical bars and boxes, respectively | 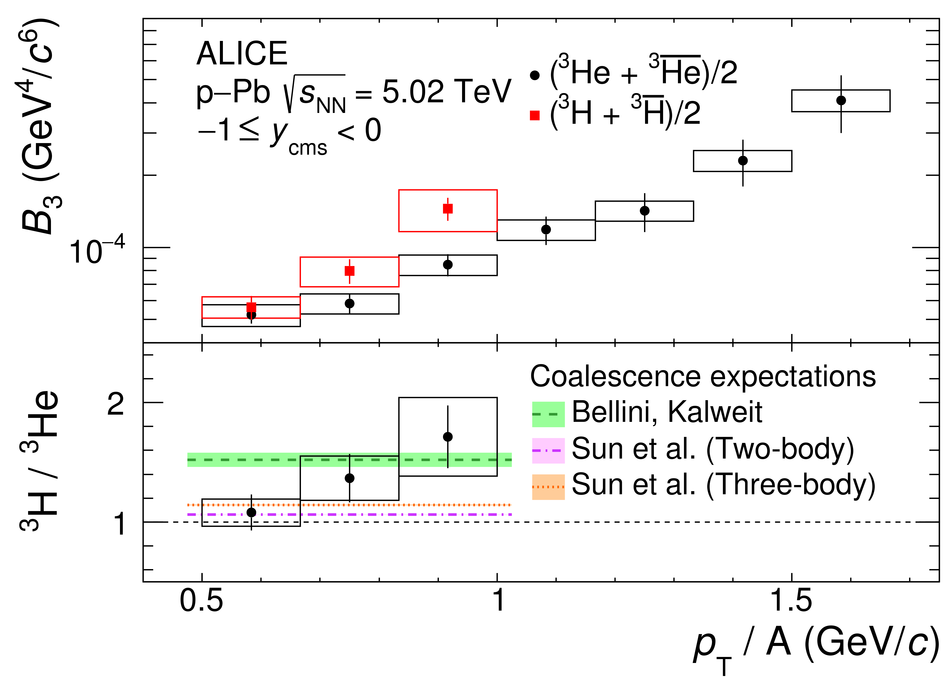 |
Figure 9
The coalescence parameter $B_3$ calculated with the average of $^3$He and $^3\overline{\mathrm{He}}$ is shown for four multiplicity classes together with the $\mathrm{INEL}>0$ result. For better visibility, the distributions are scaled by different factors Statistical and systematic uncertainties are indicated by vertical bars and boxes, respectively. |  |
Figure 11
The coalescence parameter $B_3$, calculated using the average of $^3$He and $^3\overline{\mathrm{He}}$, is shown as a function of the mean charged-particle multiplicity density for $\pt/A = 0.73$ GeV/$c$ (left) and $\pt/A = 0.90$ GeV/$c$ (right) The coalescence parameter is shown with its statistical (line) and systematical (shaded area) uncertainties. In addition, the expectations from the coalescence and the SHM plus Blast-Wave approaches are shown . |  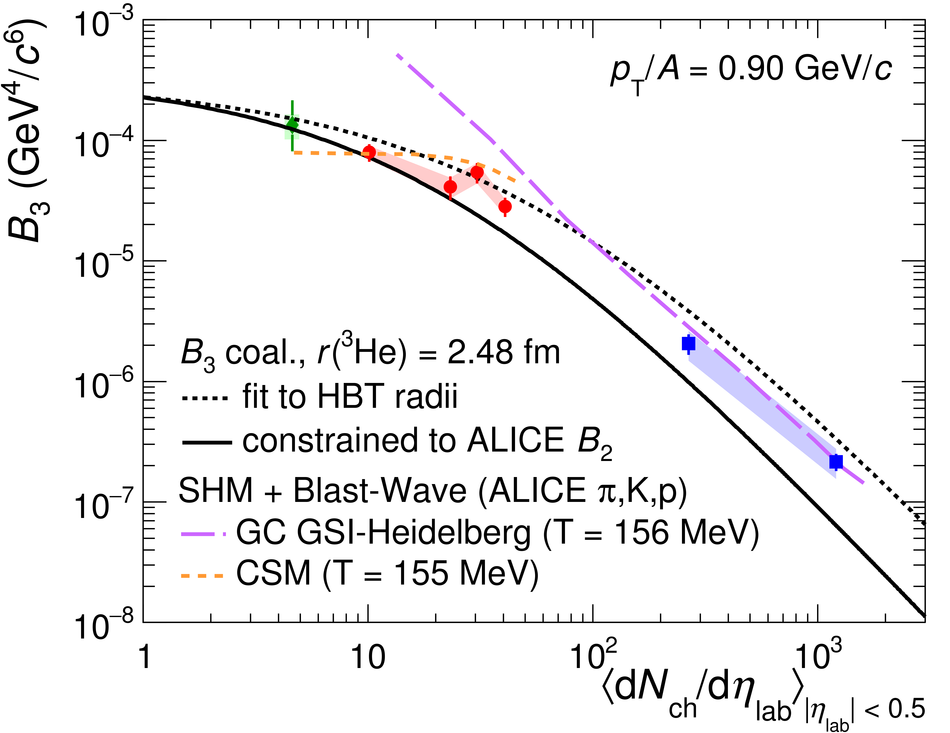 |
Figure 12
Left: The distribution of the specific ionization energy loss (\dEdx) in the TPC for candidate tracks compared to the expected one for $^4\overline{\text{He}}$, $n_{\sigma}^\mathrm{TPC}$, in the \pt range from 2 to 10 GeV/$c$. The background is fitted with a Gaussian function (red line) Right: The production yield \dNdy corrected for the spin degeneracy factor $(2J +1)$ as a function of the mass number for minimum-bias p--Pb collisions at \energy = 5.02 TeV is shown. The empty boxes represent the total systematic uncertainty while the statistical uncertainties are shown by the vertical bars. The line represents a fit with an exponential function | 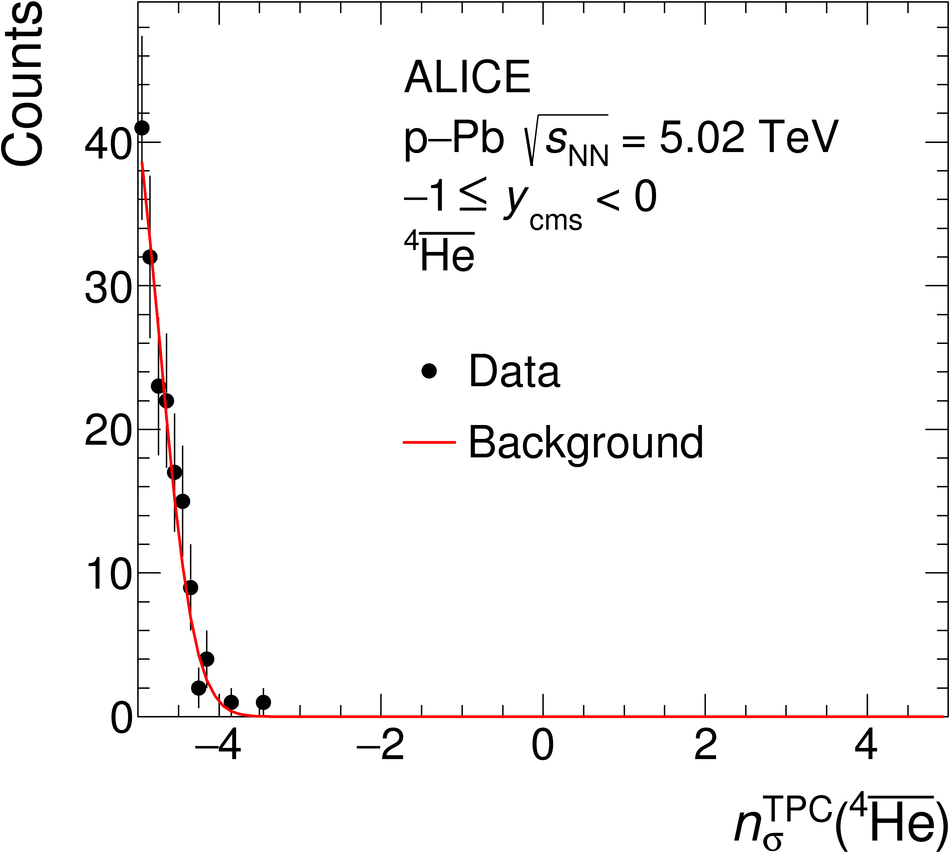 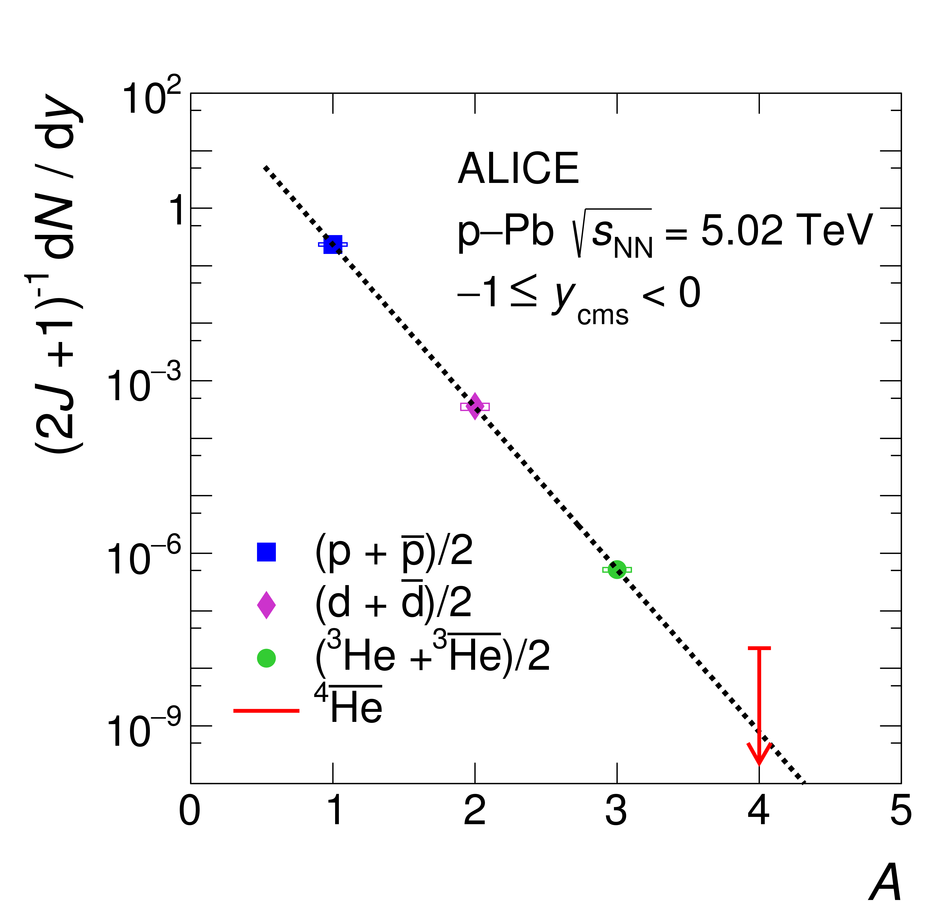 |