Left: The distribution of the specific ionization energy loss (\dEdx) in the TPC for candidate tracks compared to the expected one for $^4\overline{\text{He}}$, $n_{\sigma}^\mathrm{TPC}$, in the \pt range from 2 to 10 GeV/$c$. The background is fitted with a Gaussian function (red line) Right: The production yield \dNdy corrected for the spin degeneracy factor $(2J +1)$ as a function of the mass number for minimum-bias p--Pb collisions at \energy = 5.02 TeV is shown. The empty boxes represent the total systematic uncertainty while the statistical uncertainties are shown by the vertical bars. The line represents a fit with an exponential function | 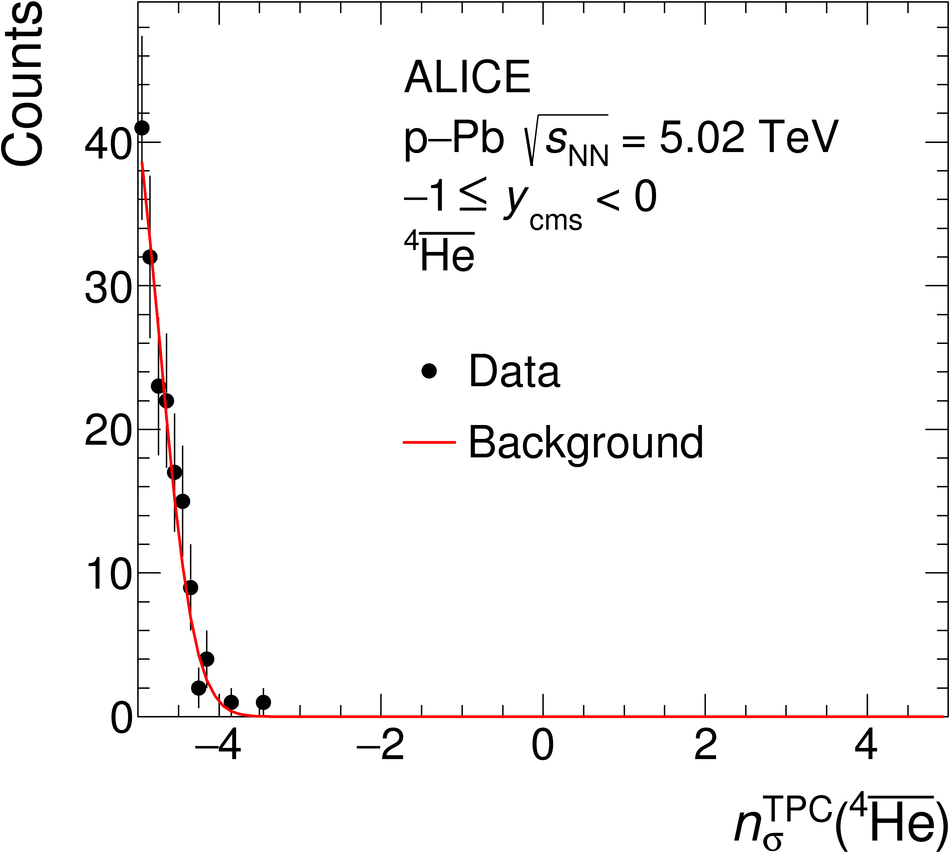 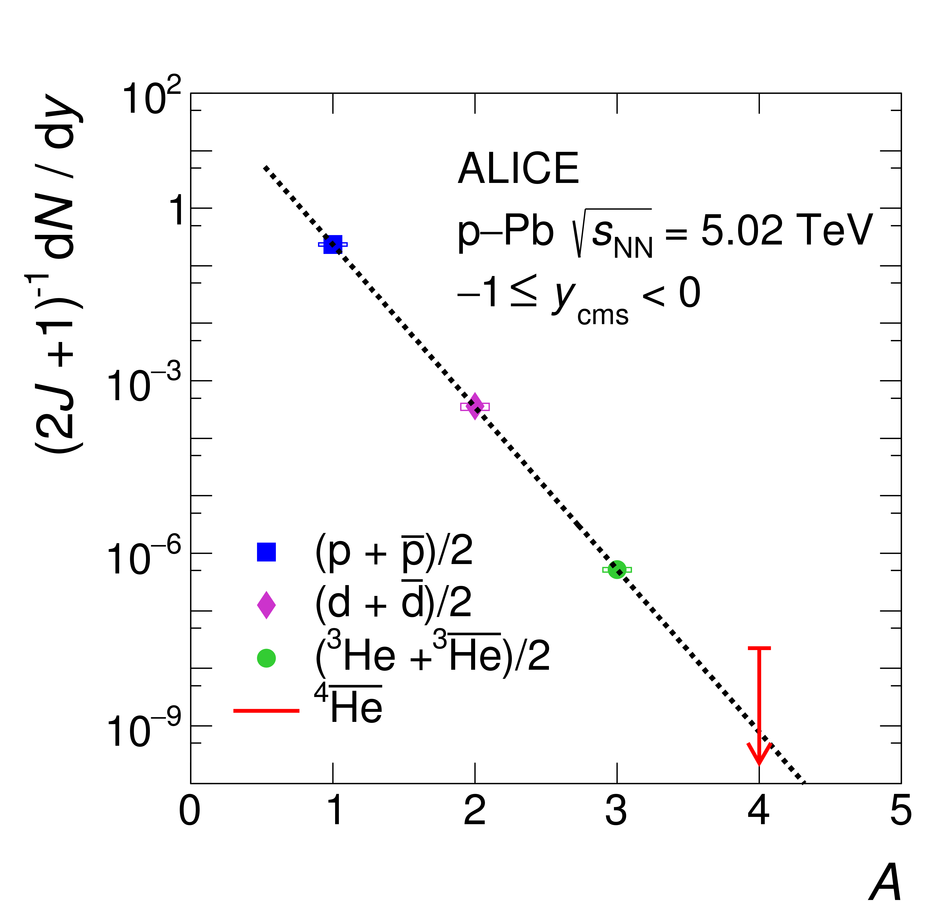 |