The lower limit of $\la\cos n(\Psi_2(\pt)-\Psi_2)\ra$ (blue boxes), the upper limit of $\la v_2(\pt)v_2\ra/\sqrt{\la v_2^2(\pt)\ra\la v_2^2\ra}$ (red boxes) and the flow vector fluctuations $v_{2}\{2\}/v_2[2]$ (grey diamonds) as a function of $\pt$. The different panels display results in different centrality intervals. The red (blue) arrows denote the upper (lower) limits, and the statistical (systematic) uncertainties are represented by open (shaded) boxes). | 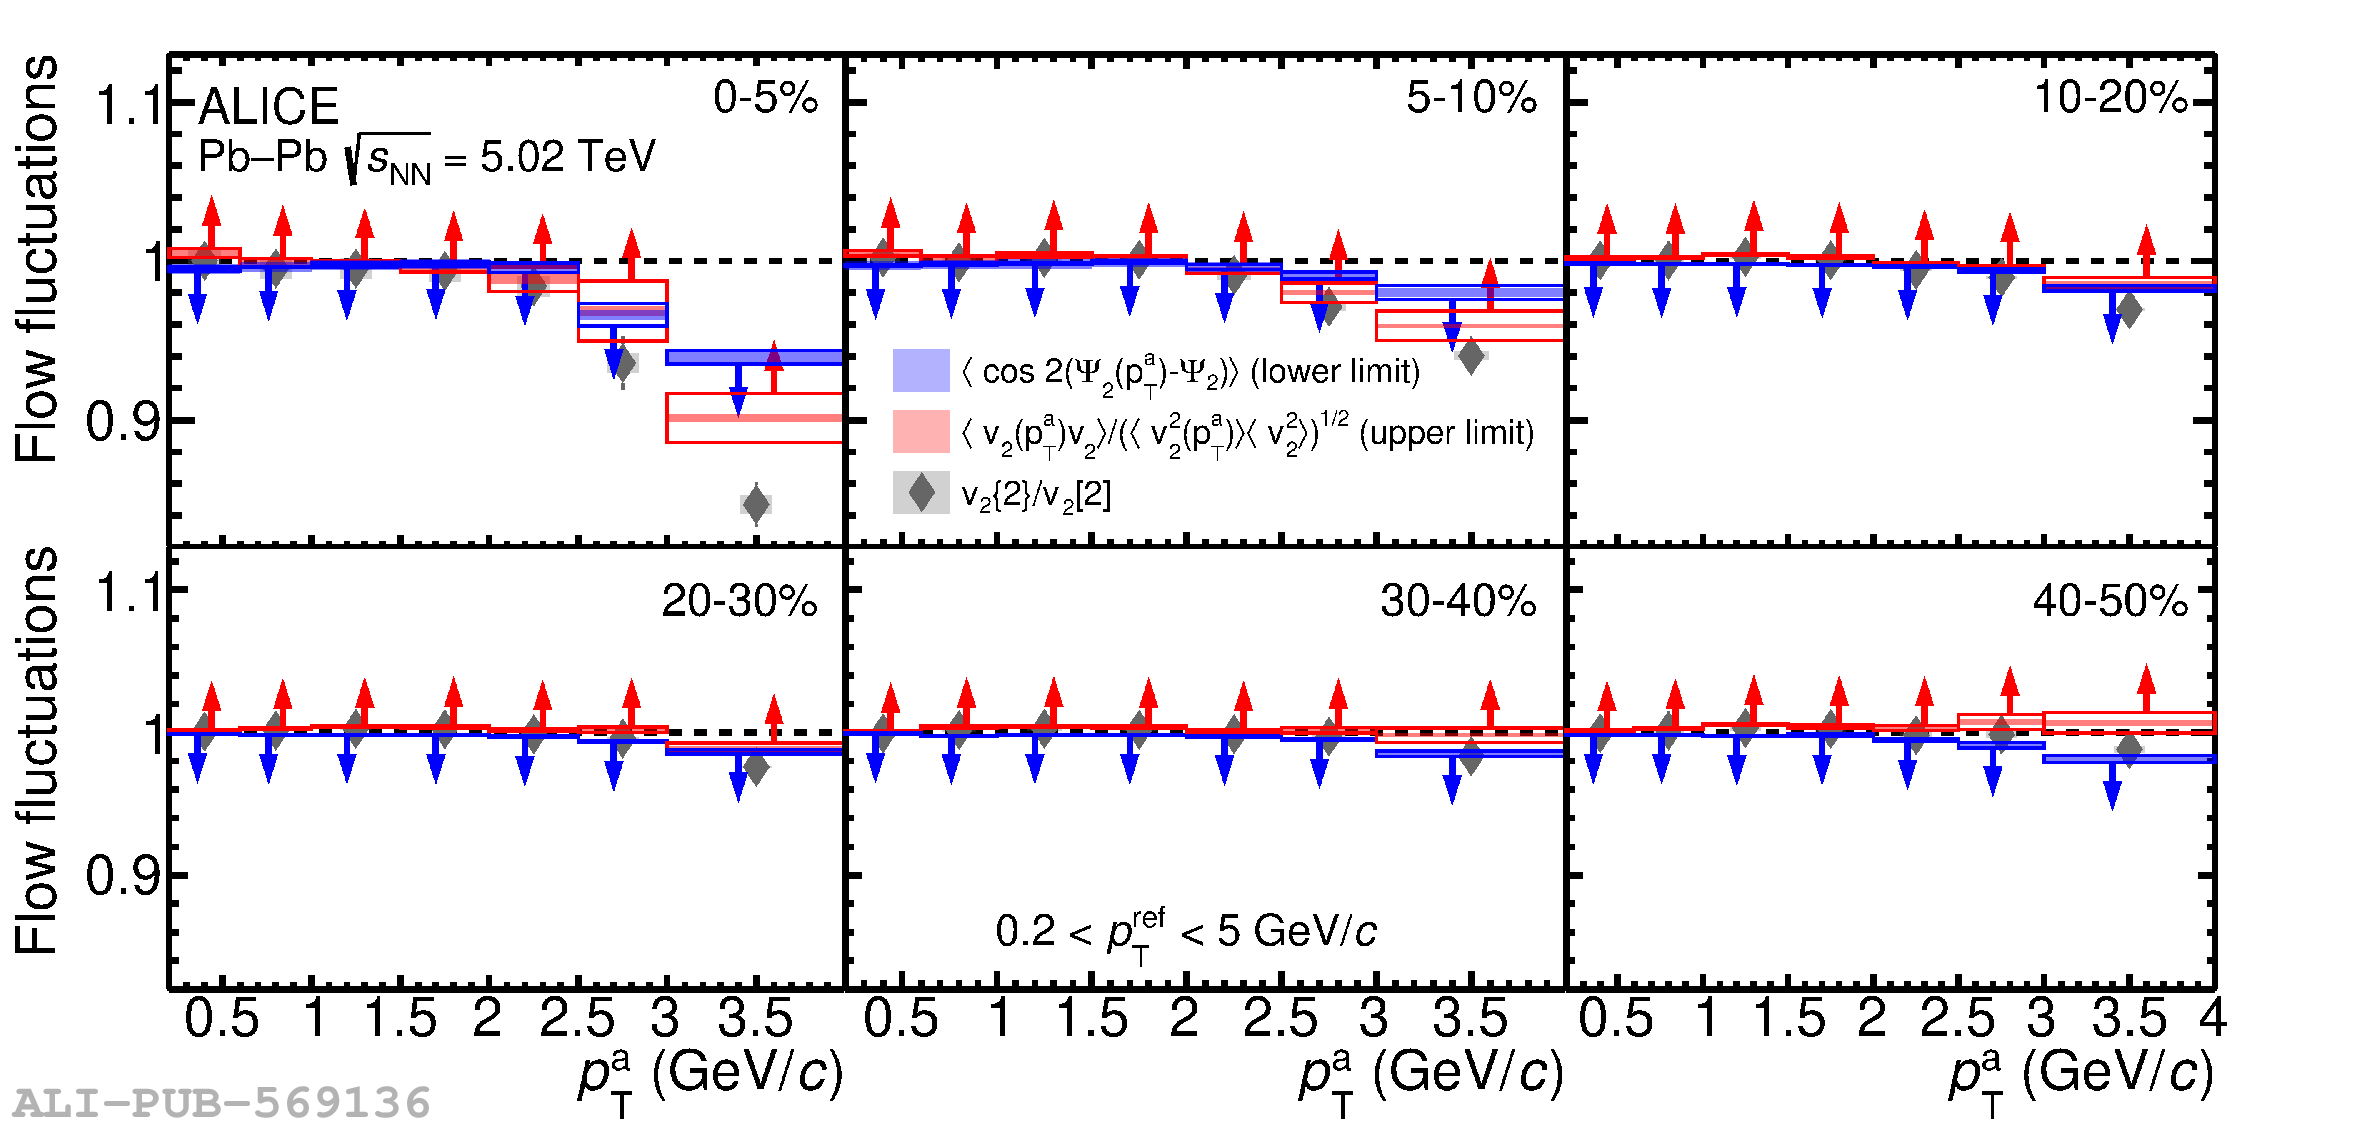 |