The flow magnitude fluctuations $\Fvn{2}$ in $\PbPb$ collisions at $\snn$ = 5.02 TeV (red squares) as a function of $\pt$. The different panels display results in different centrality intervals. Statistical (systematic) uncertainties are represented by solid bars (faded boxes). Predictions from iEBE-VISHNU with AMPT initial conditions and $\eta/s = 0.08, 0.20$ and iEBE-VISHNU with \trento initial conditions and $\eta/s(T)$ as well as AMPT are shown in colored bands. | 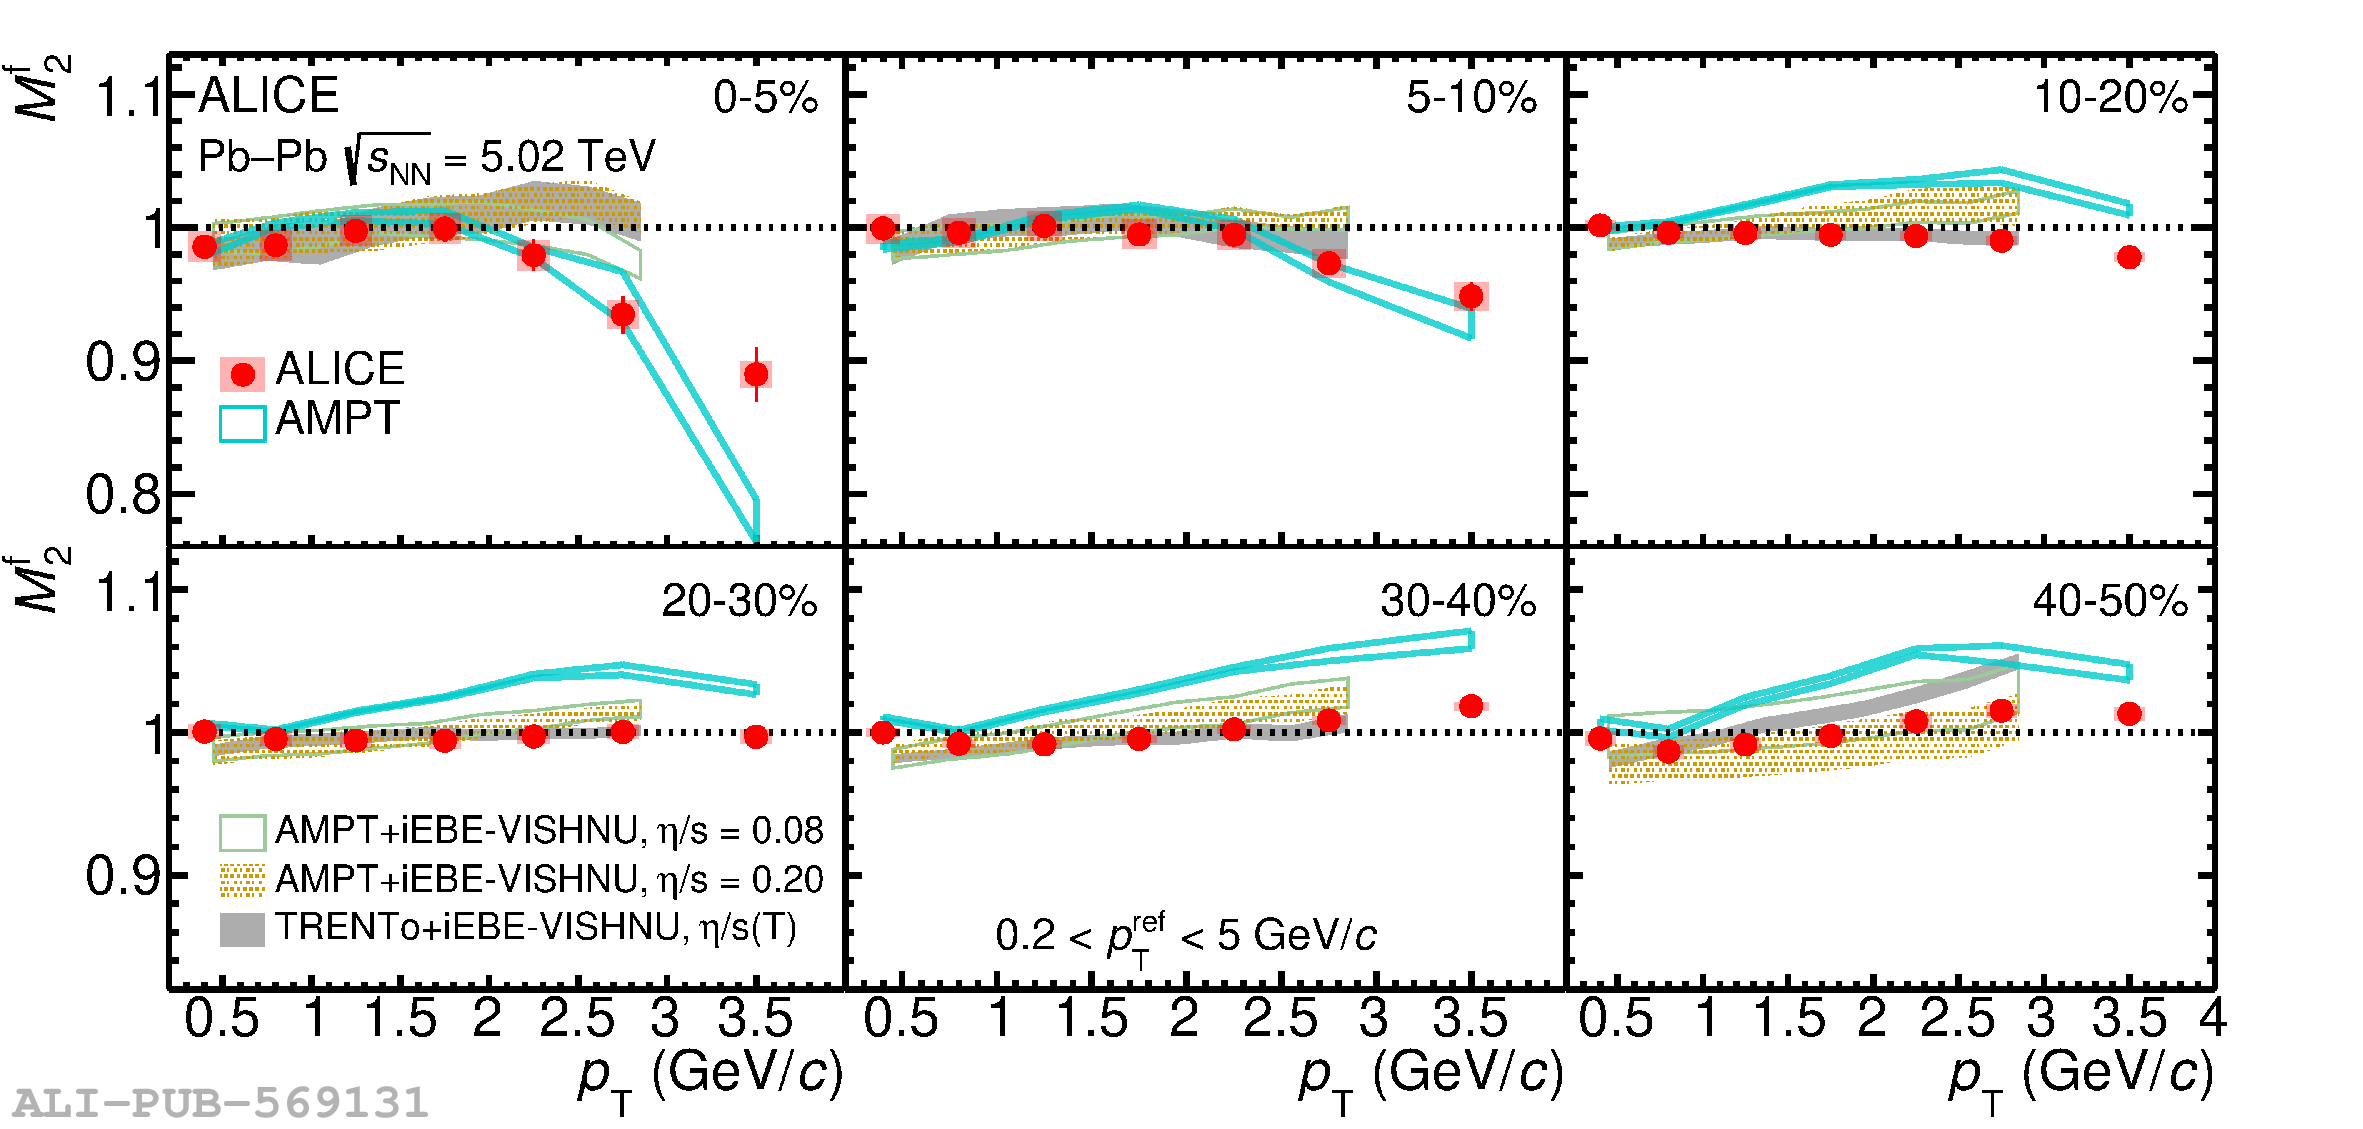 |