The factorization ratio $r_2$ for $\PbPb$ collisions at $\snn$ = 5.02 TeV (dark blue circles) and 2.76 TeV (light blue circles) as a function of associated particle $\pta$. The columns show the results in centrality intervals 0--5\%, 20--30\%, and 40--50\%, while the rows show the results for different trigger particle $p_\mathrm{T}^t$ intervals. Statistical (systematic) uncertainties are represented by solid bars (faded boxes). | 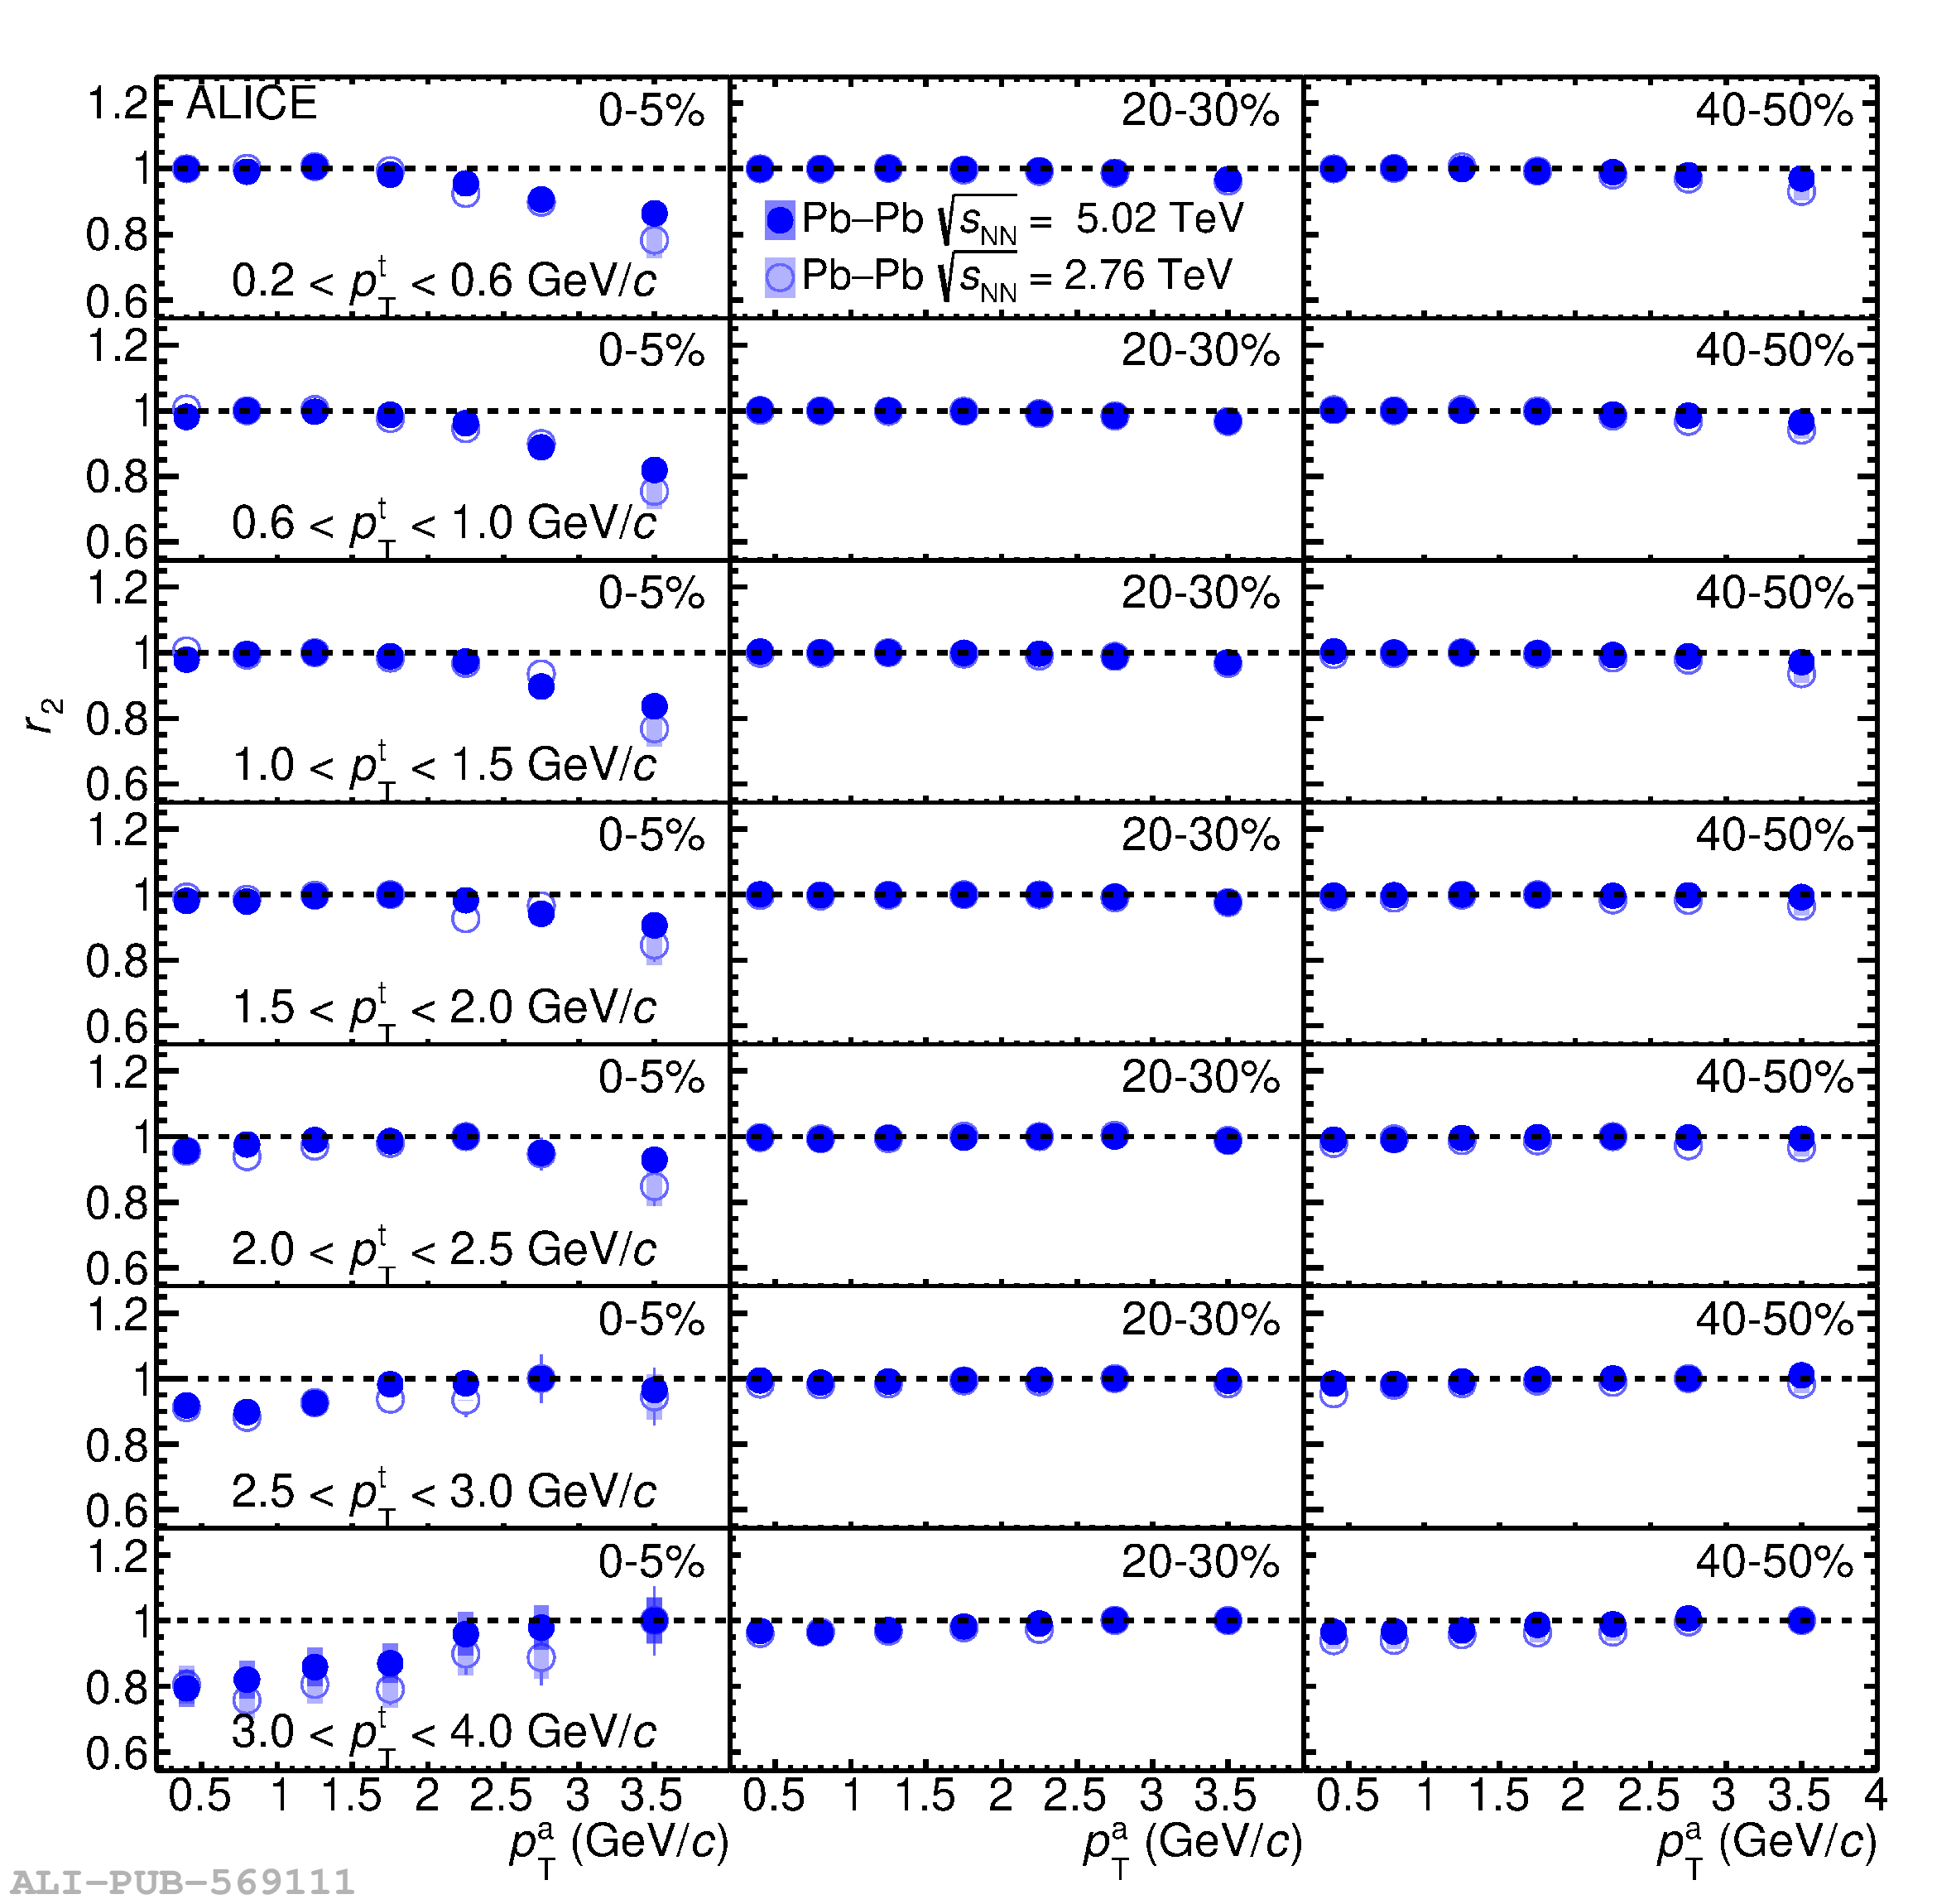 |