Comparison of the D meson $\RAA$ (average of $\Dzero$, $\Dplus$ and $\Dstar$) in $8< \pt< 16 \gev/c$ and of the $\RAA$ of non-prompt $J/\psi$ mesons in $6.5< \pt< 30 \gev/c$ measured by the CMS Collaboration [2]. The vertical bars represent the statistical uncertainties, while the filled (empty) boxes represent the systematic uncertainties that are correlated (uncorrelated) among centrality intervals. This figure updates Fig. 3 (right) of [1]. | 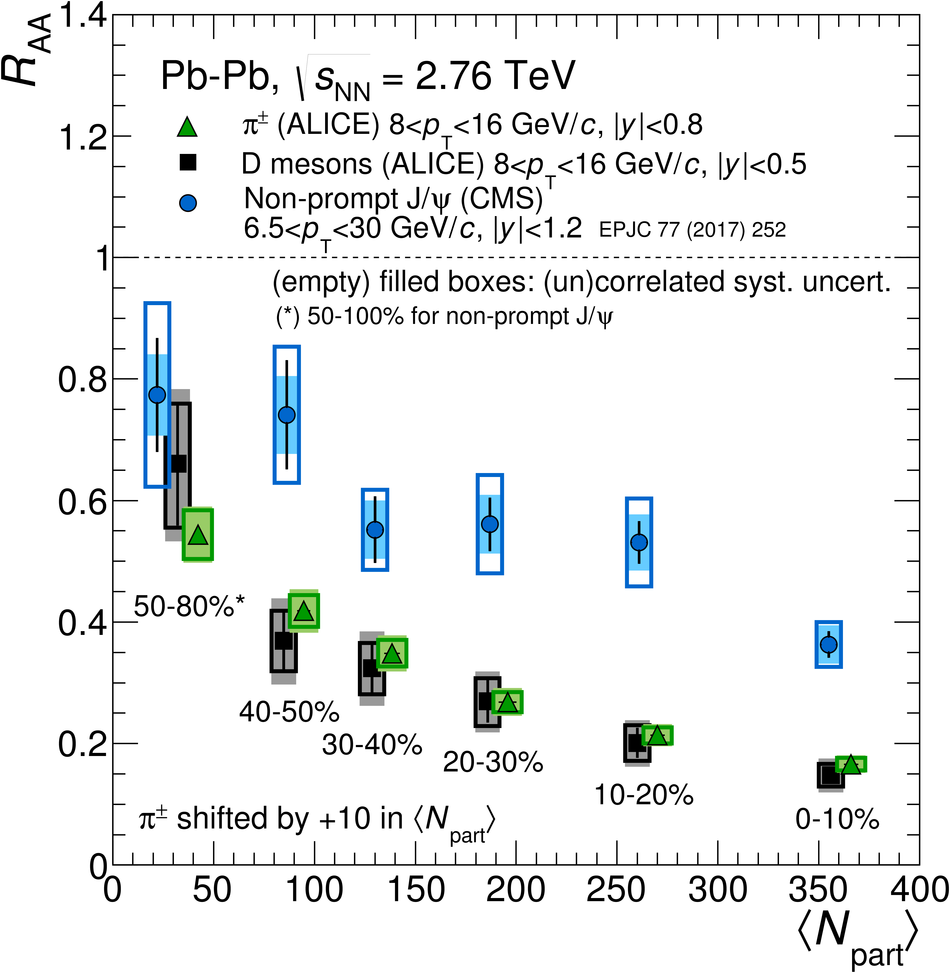 |