Comparison between $\Delta R_{\rm axis}$ measured distributions and analytic predictions for the WTA$-$Standard case with $R=0.4$ Each panel corresponds to a different $p_{\rm T}^{\rm ch\,jet}$ bin. The measured distribution is shown in black The colored distributions correspond to the SCET prediction corrected with different MC event generators. |  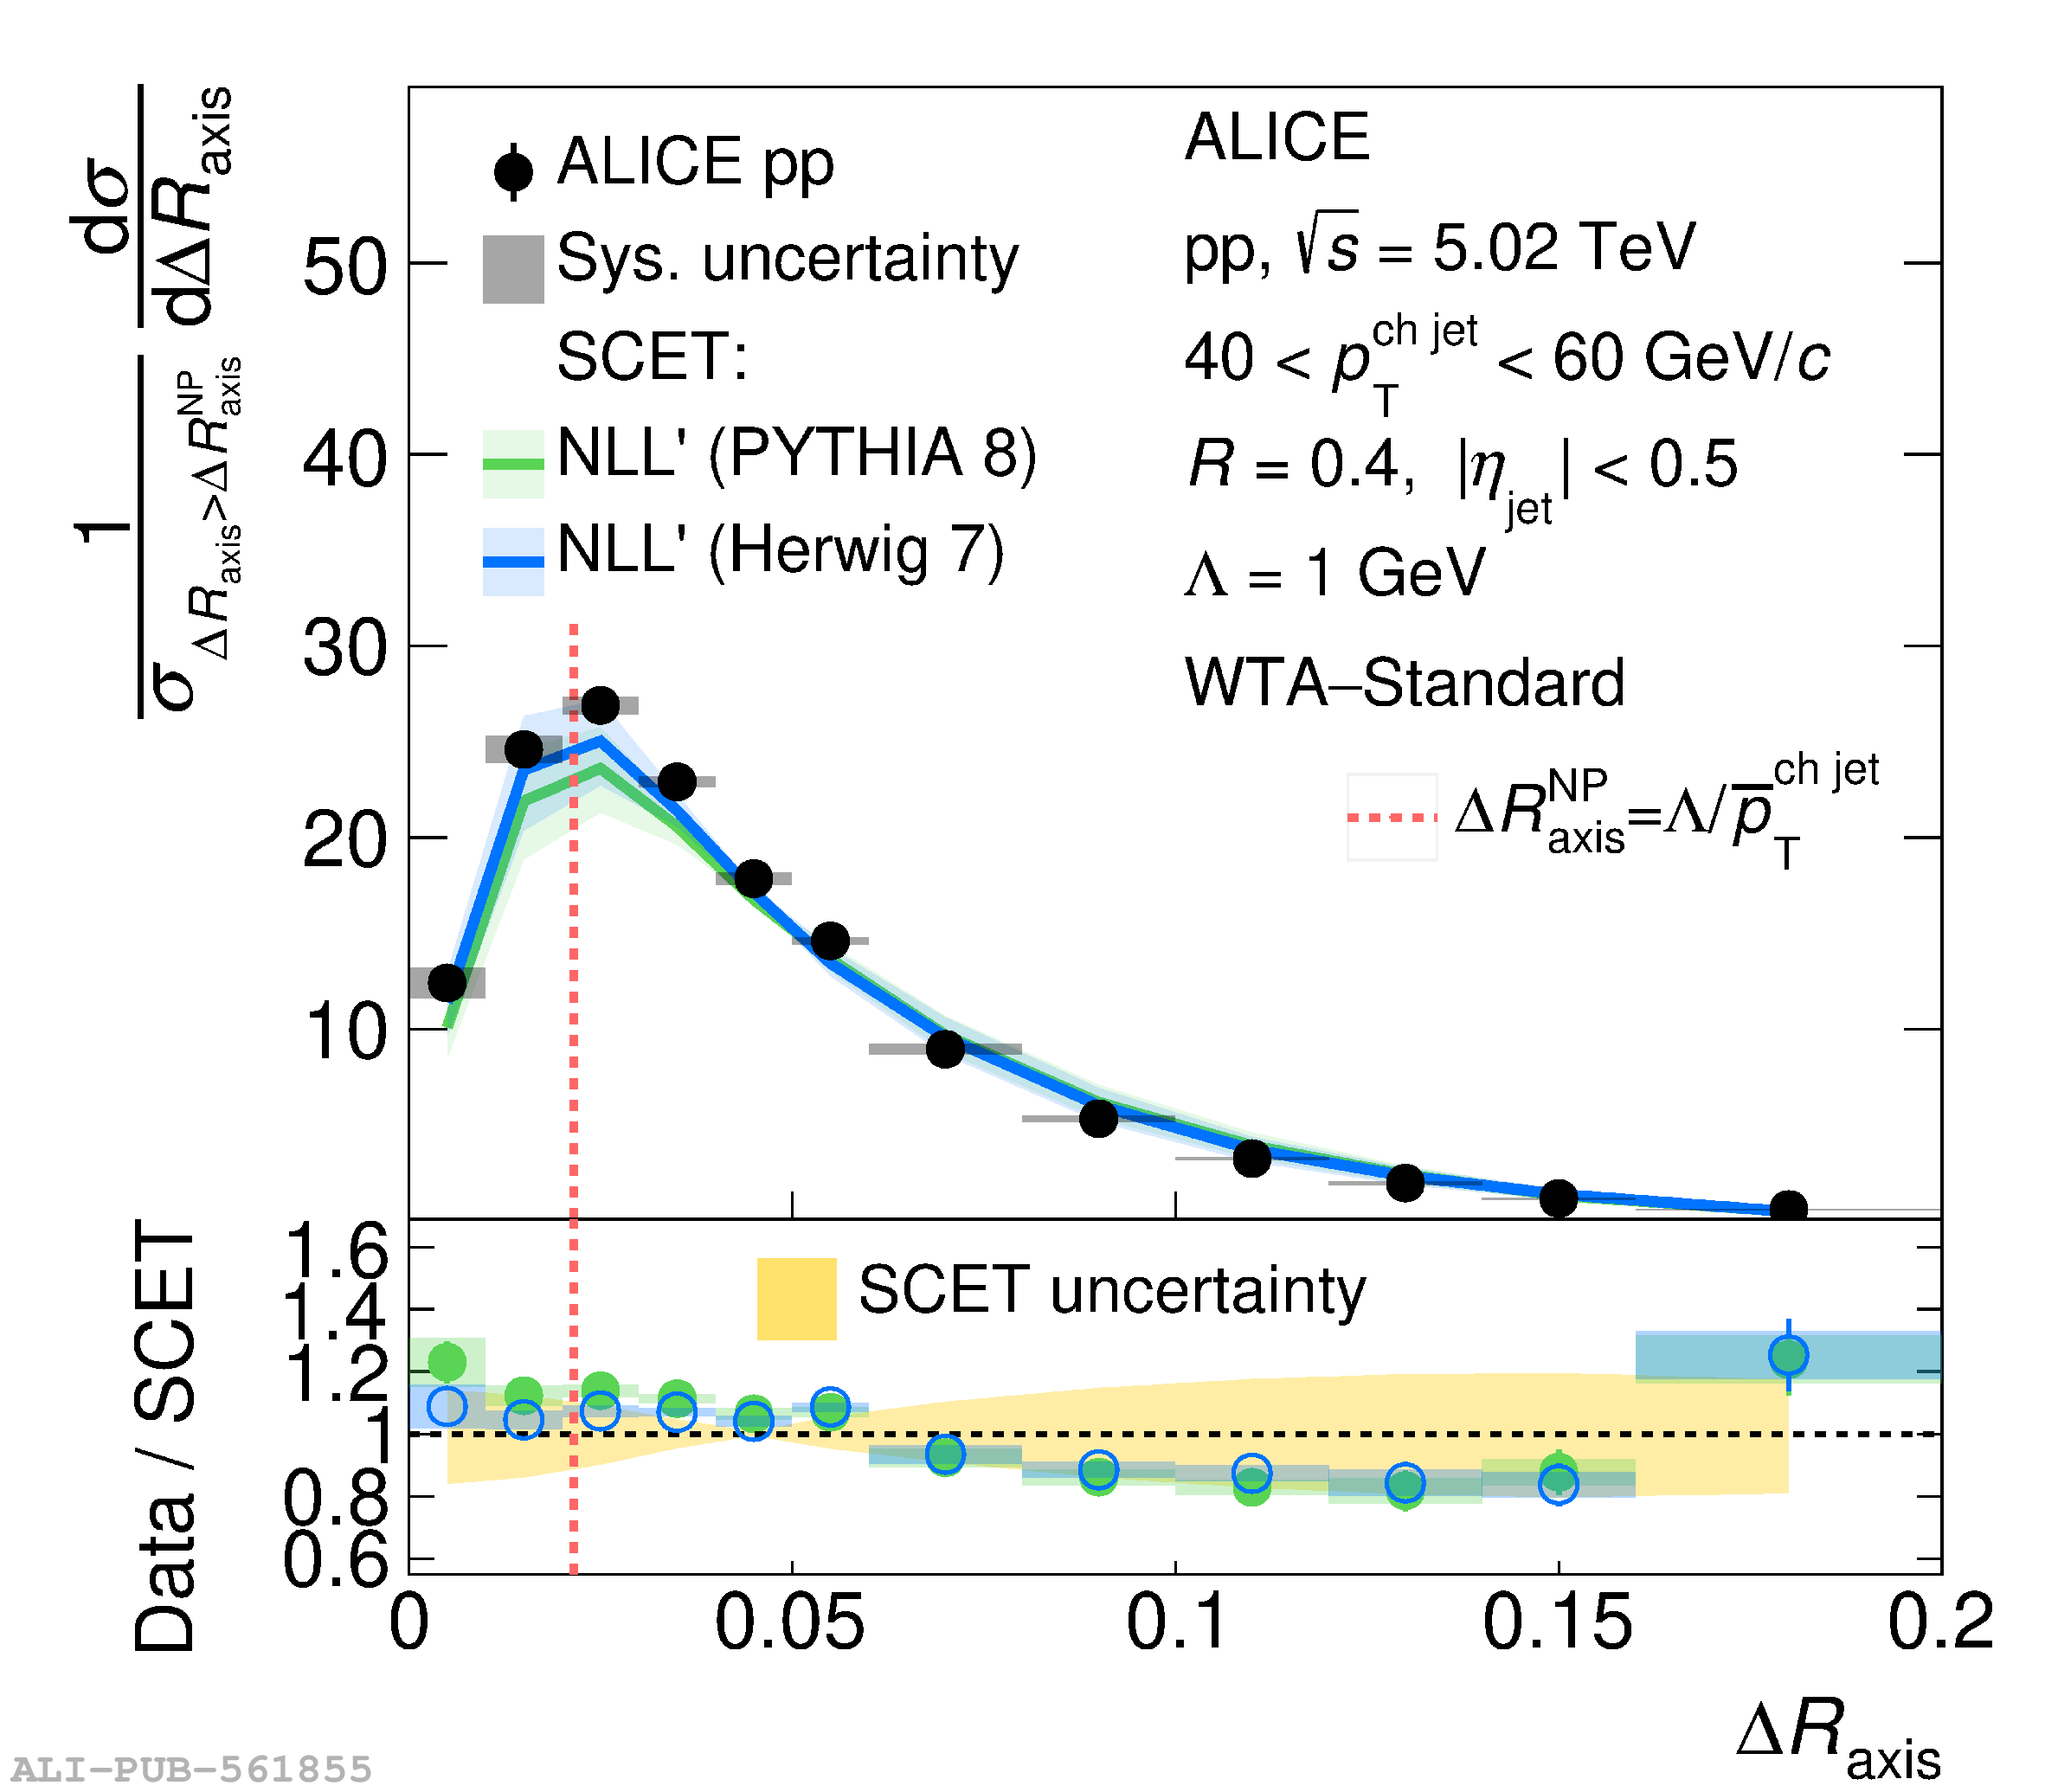 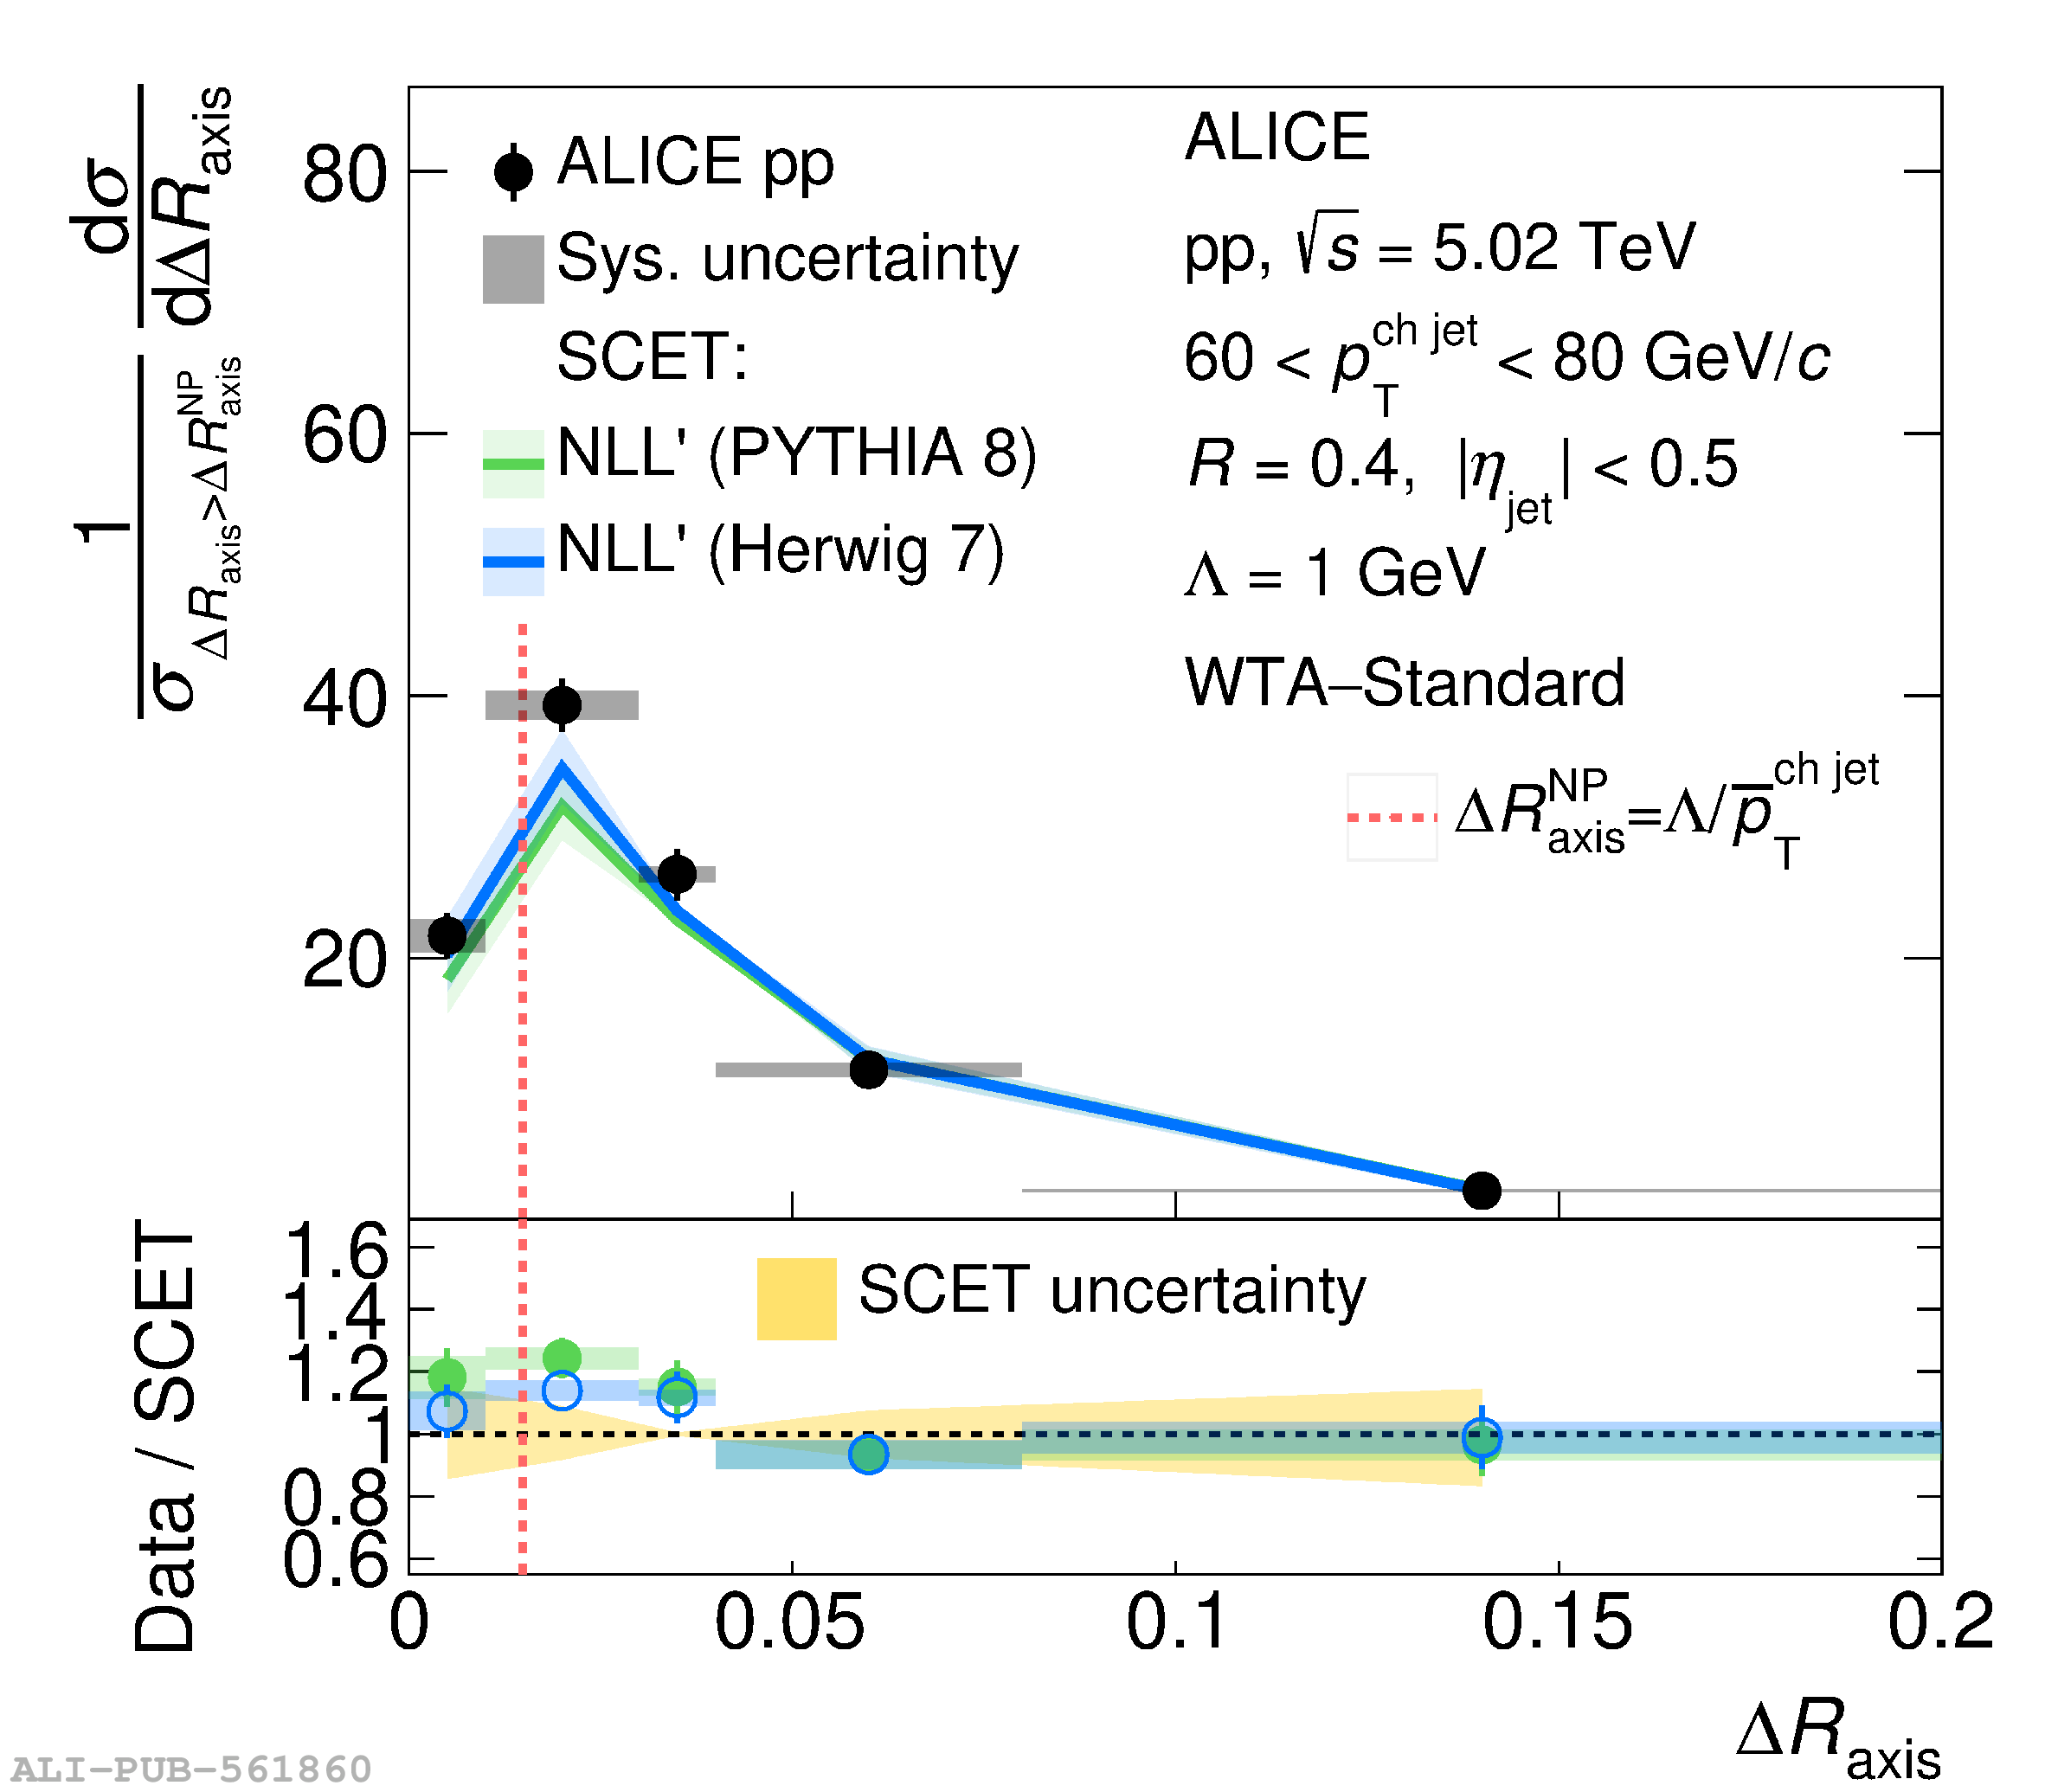  |