(Upper panels) Particle yield ratios of ${\rm f_0(980)}$ to $\pi^{+}+\pi^{-}$ (left panel), $\rm{p}+\overline{\rm{p}}$ (middle panel), and $\phi$ (right panel) measured in inelastic pp collisions at $\sqrt{s}=$ 5.02 TeV as a function of $p_{\mathrm{T}}$. Data are compared to HERWIG 7.2 model predictions. The statistical and systematic uncertainties are shown as bars and boxes, respectively (Lower panels) Ratio of measured particle ratios to the HERWIG model calculations (dashed histogram). The grey boxes at unity represent the sum in quadrature of the statistical and systematic uncertainty on the data. In the right panel, the ratio in the region for $\pt<0.8$ GeV/$c$ is off-scale. The relative uncertainty of 13% due to the branching ratio correction is shown as a green box with an arbitrary horizontal width for visibility. | 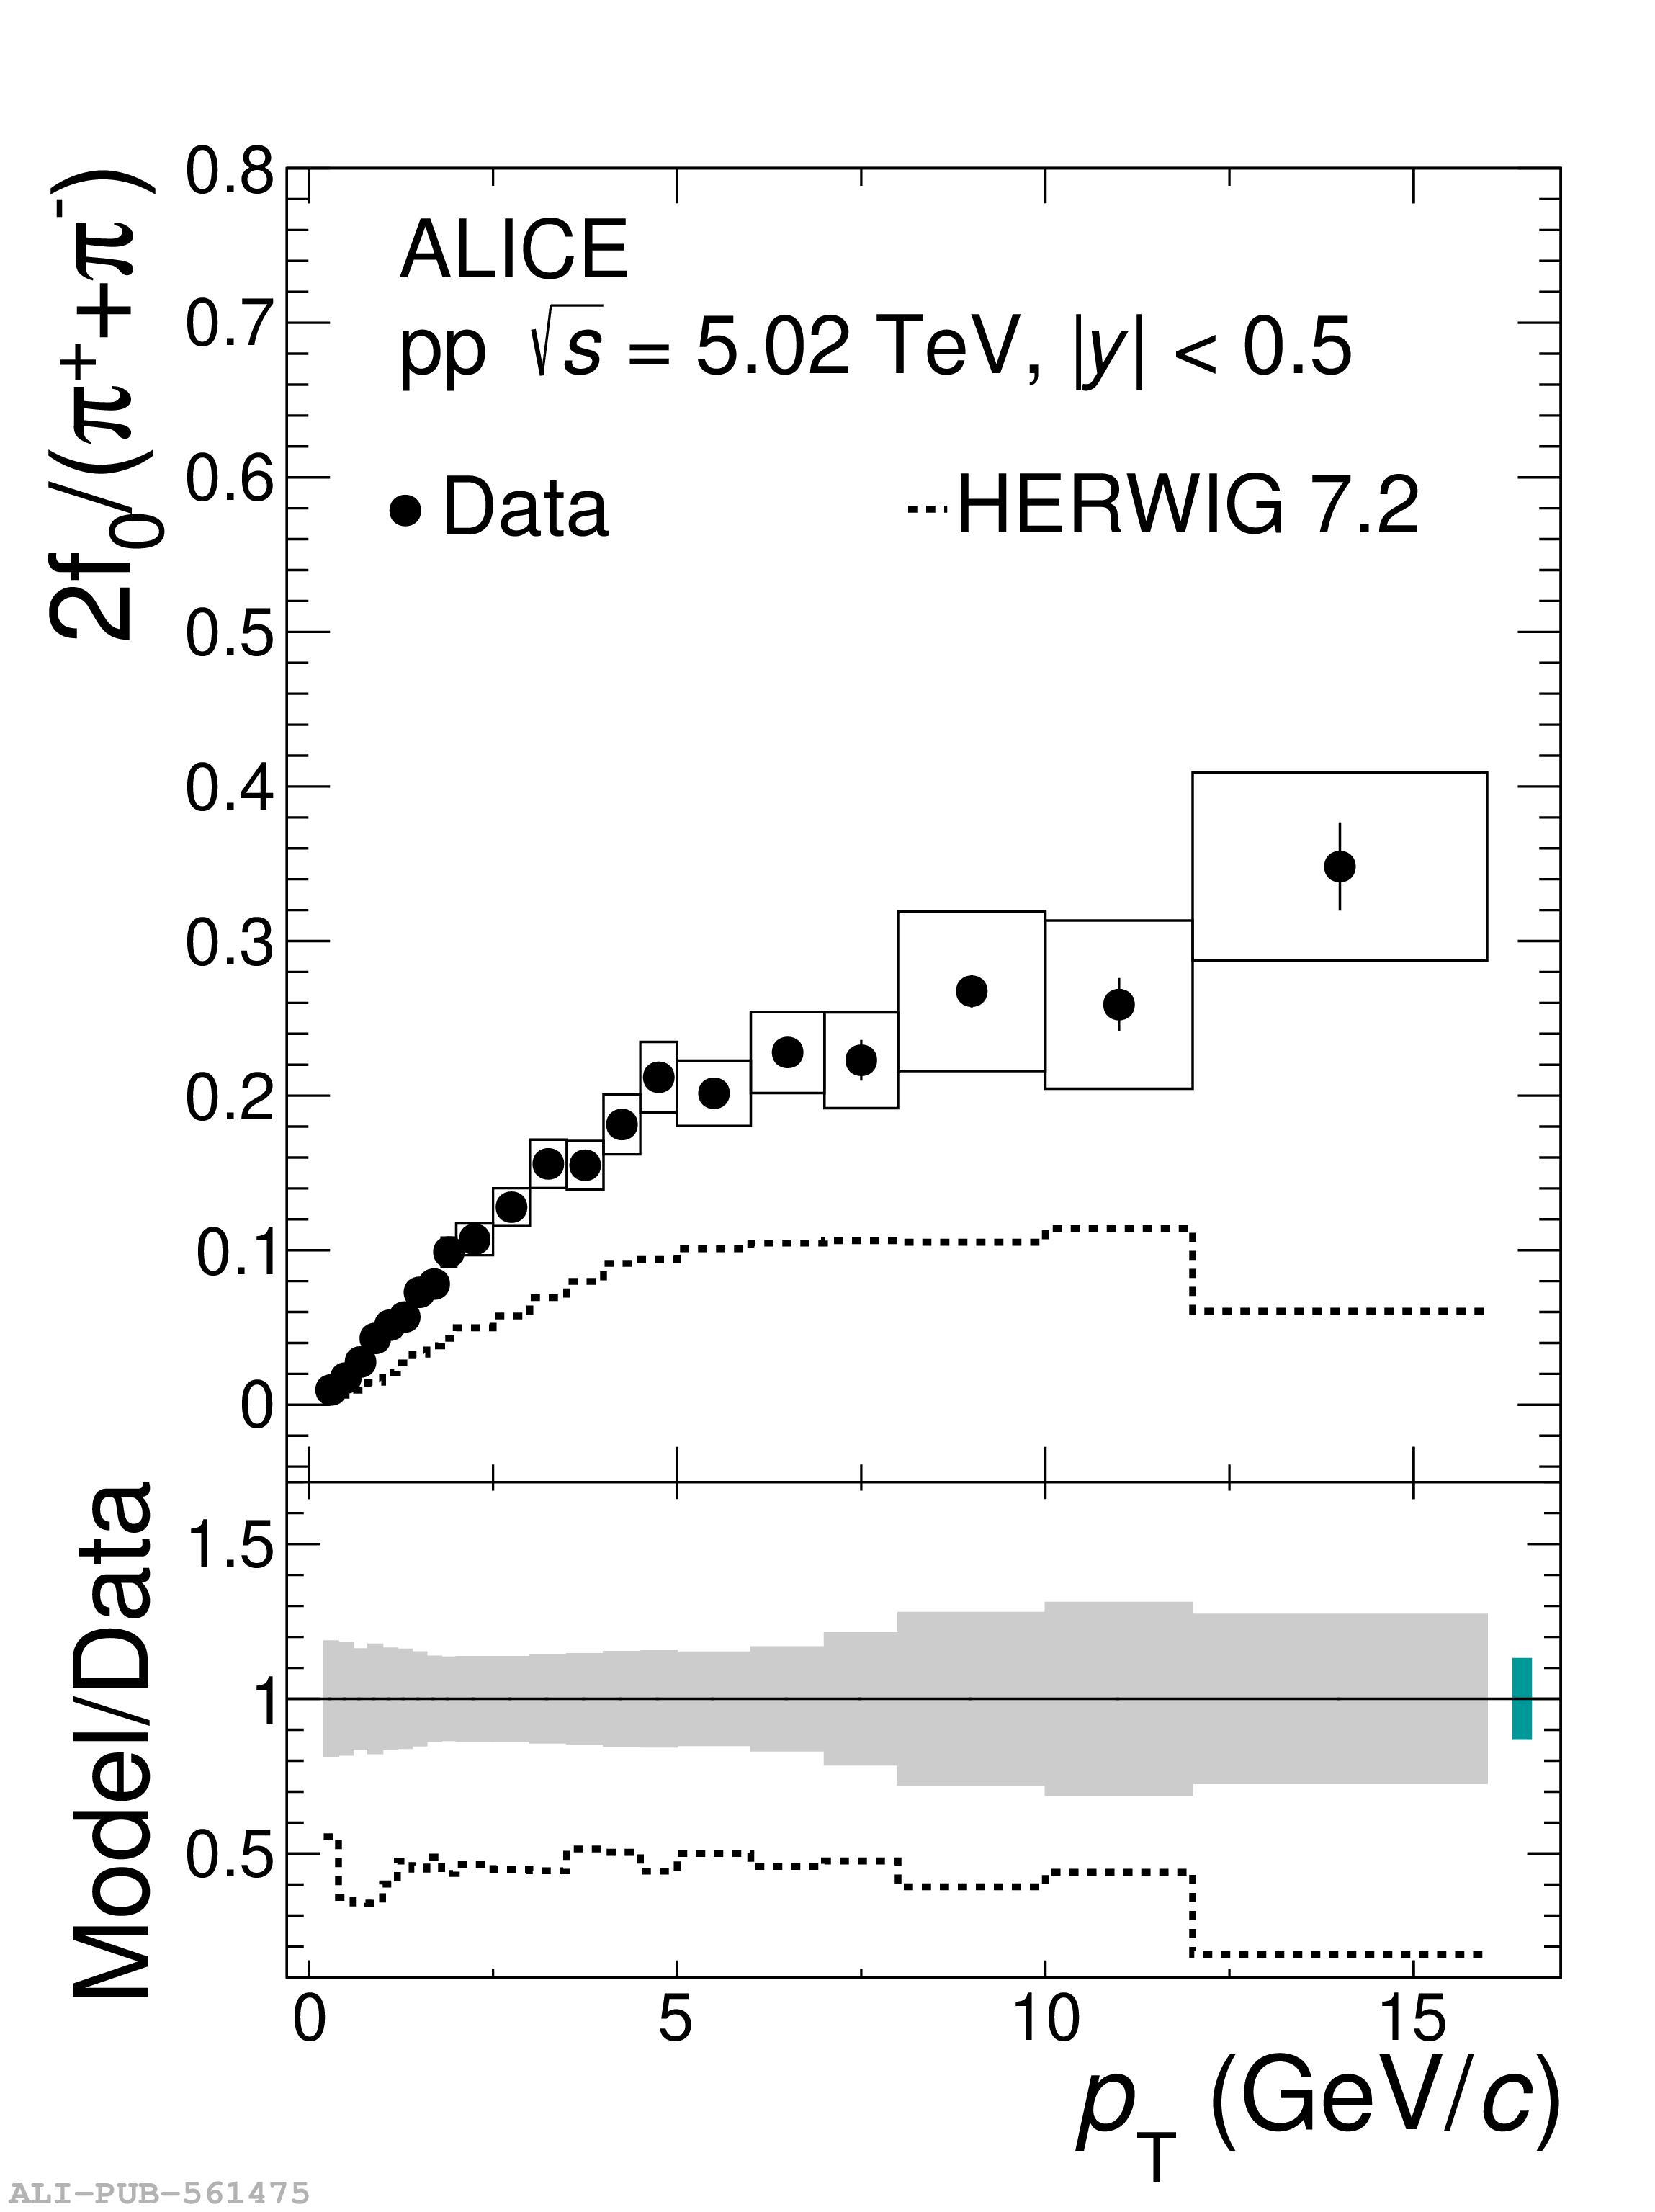 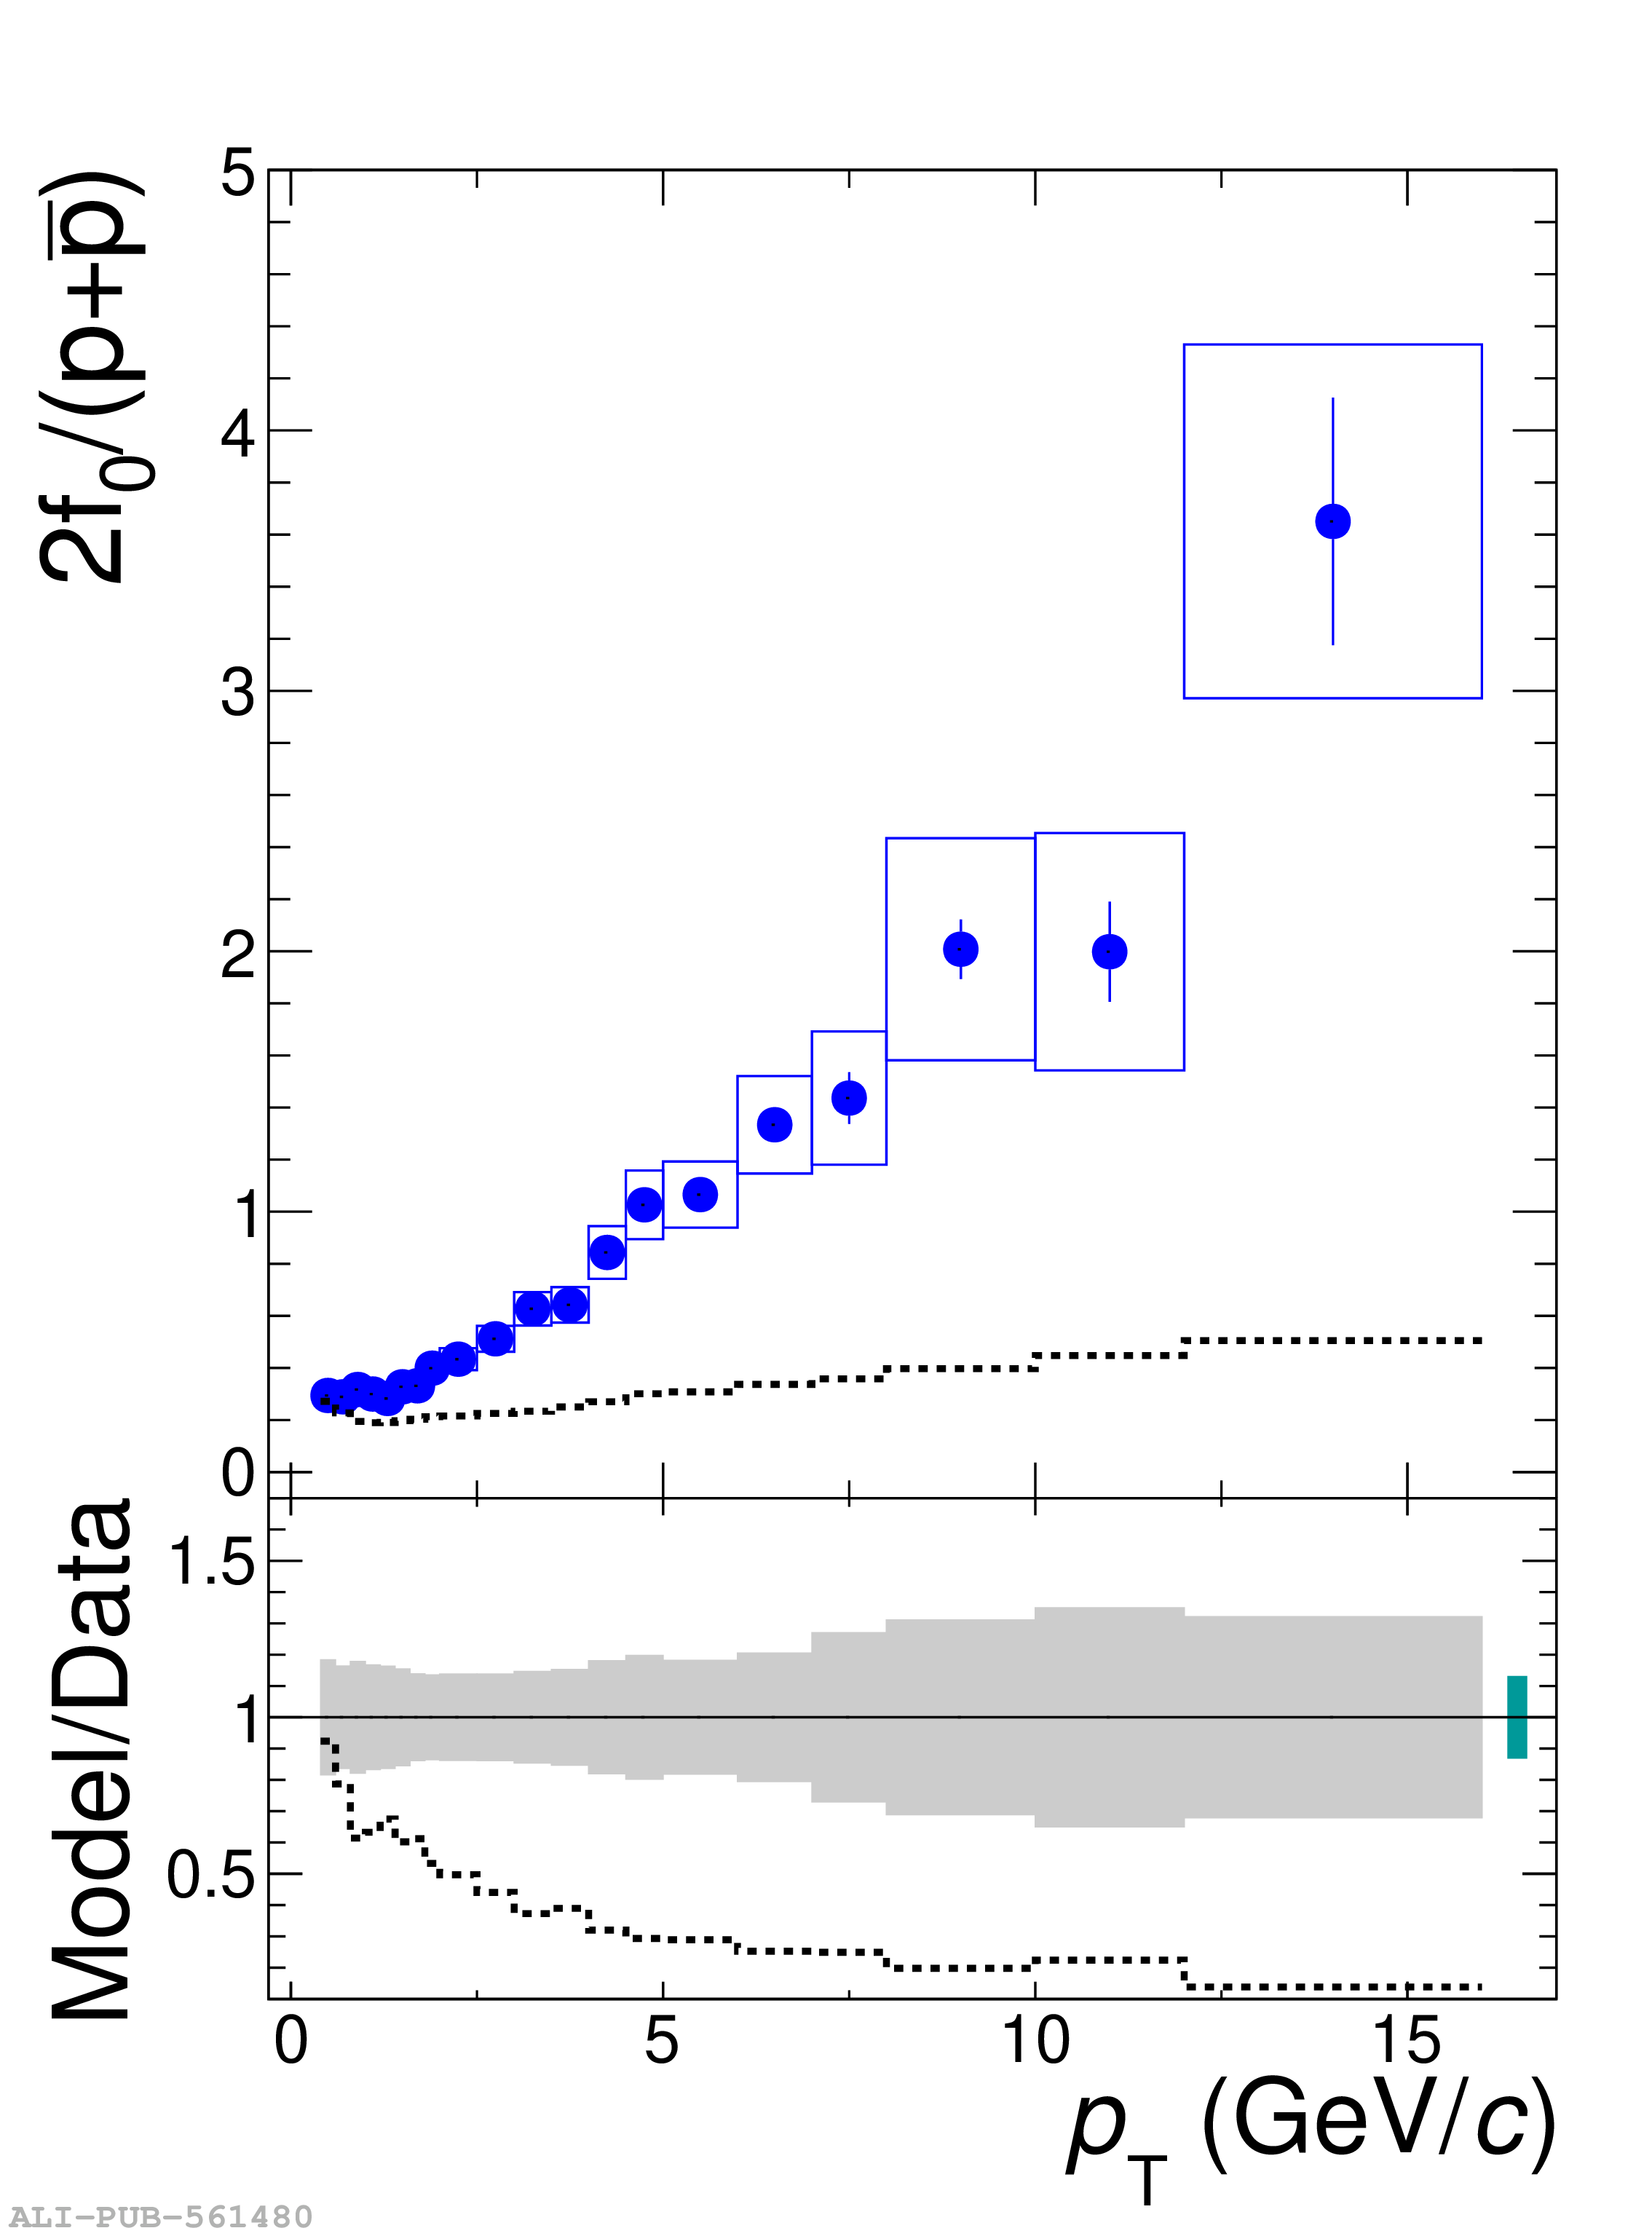 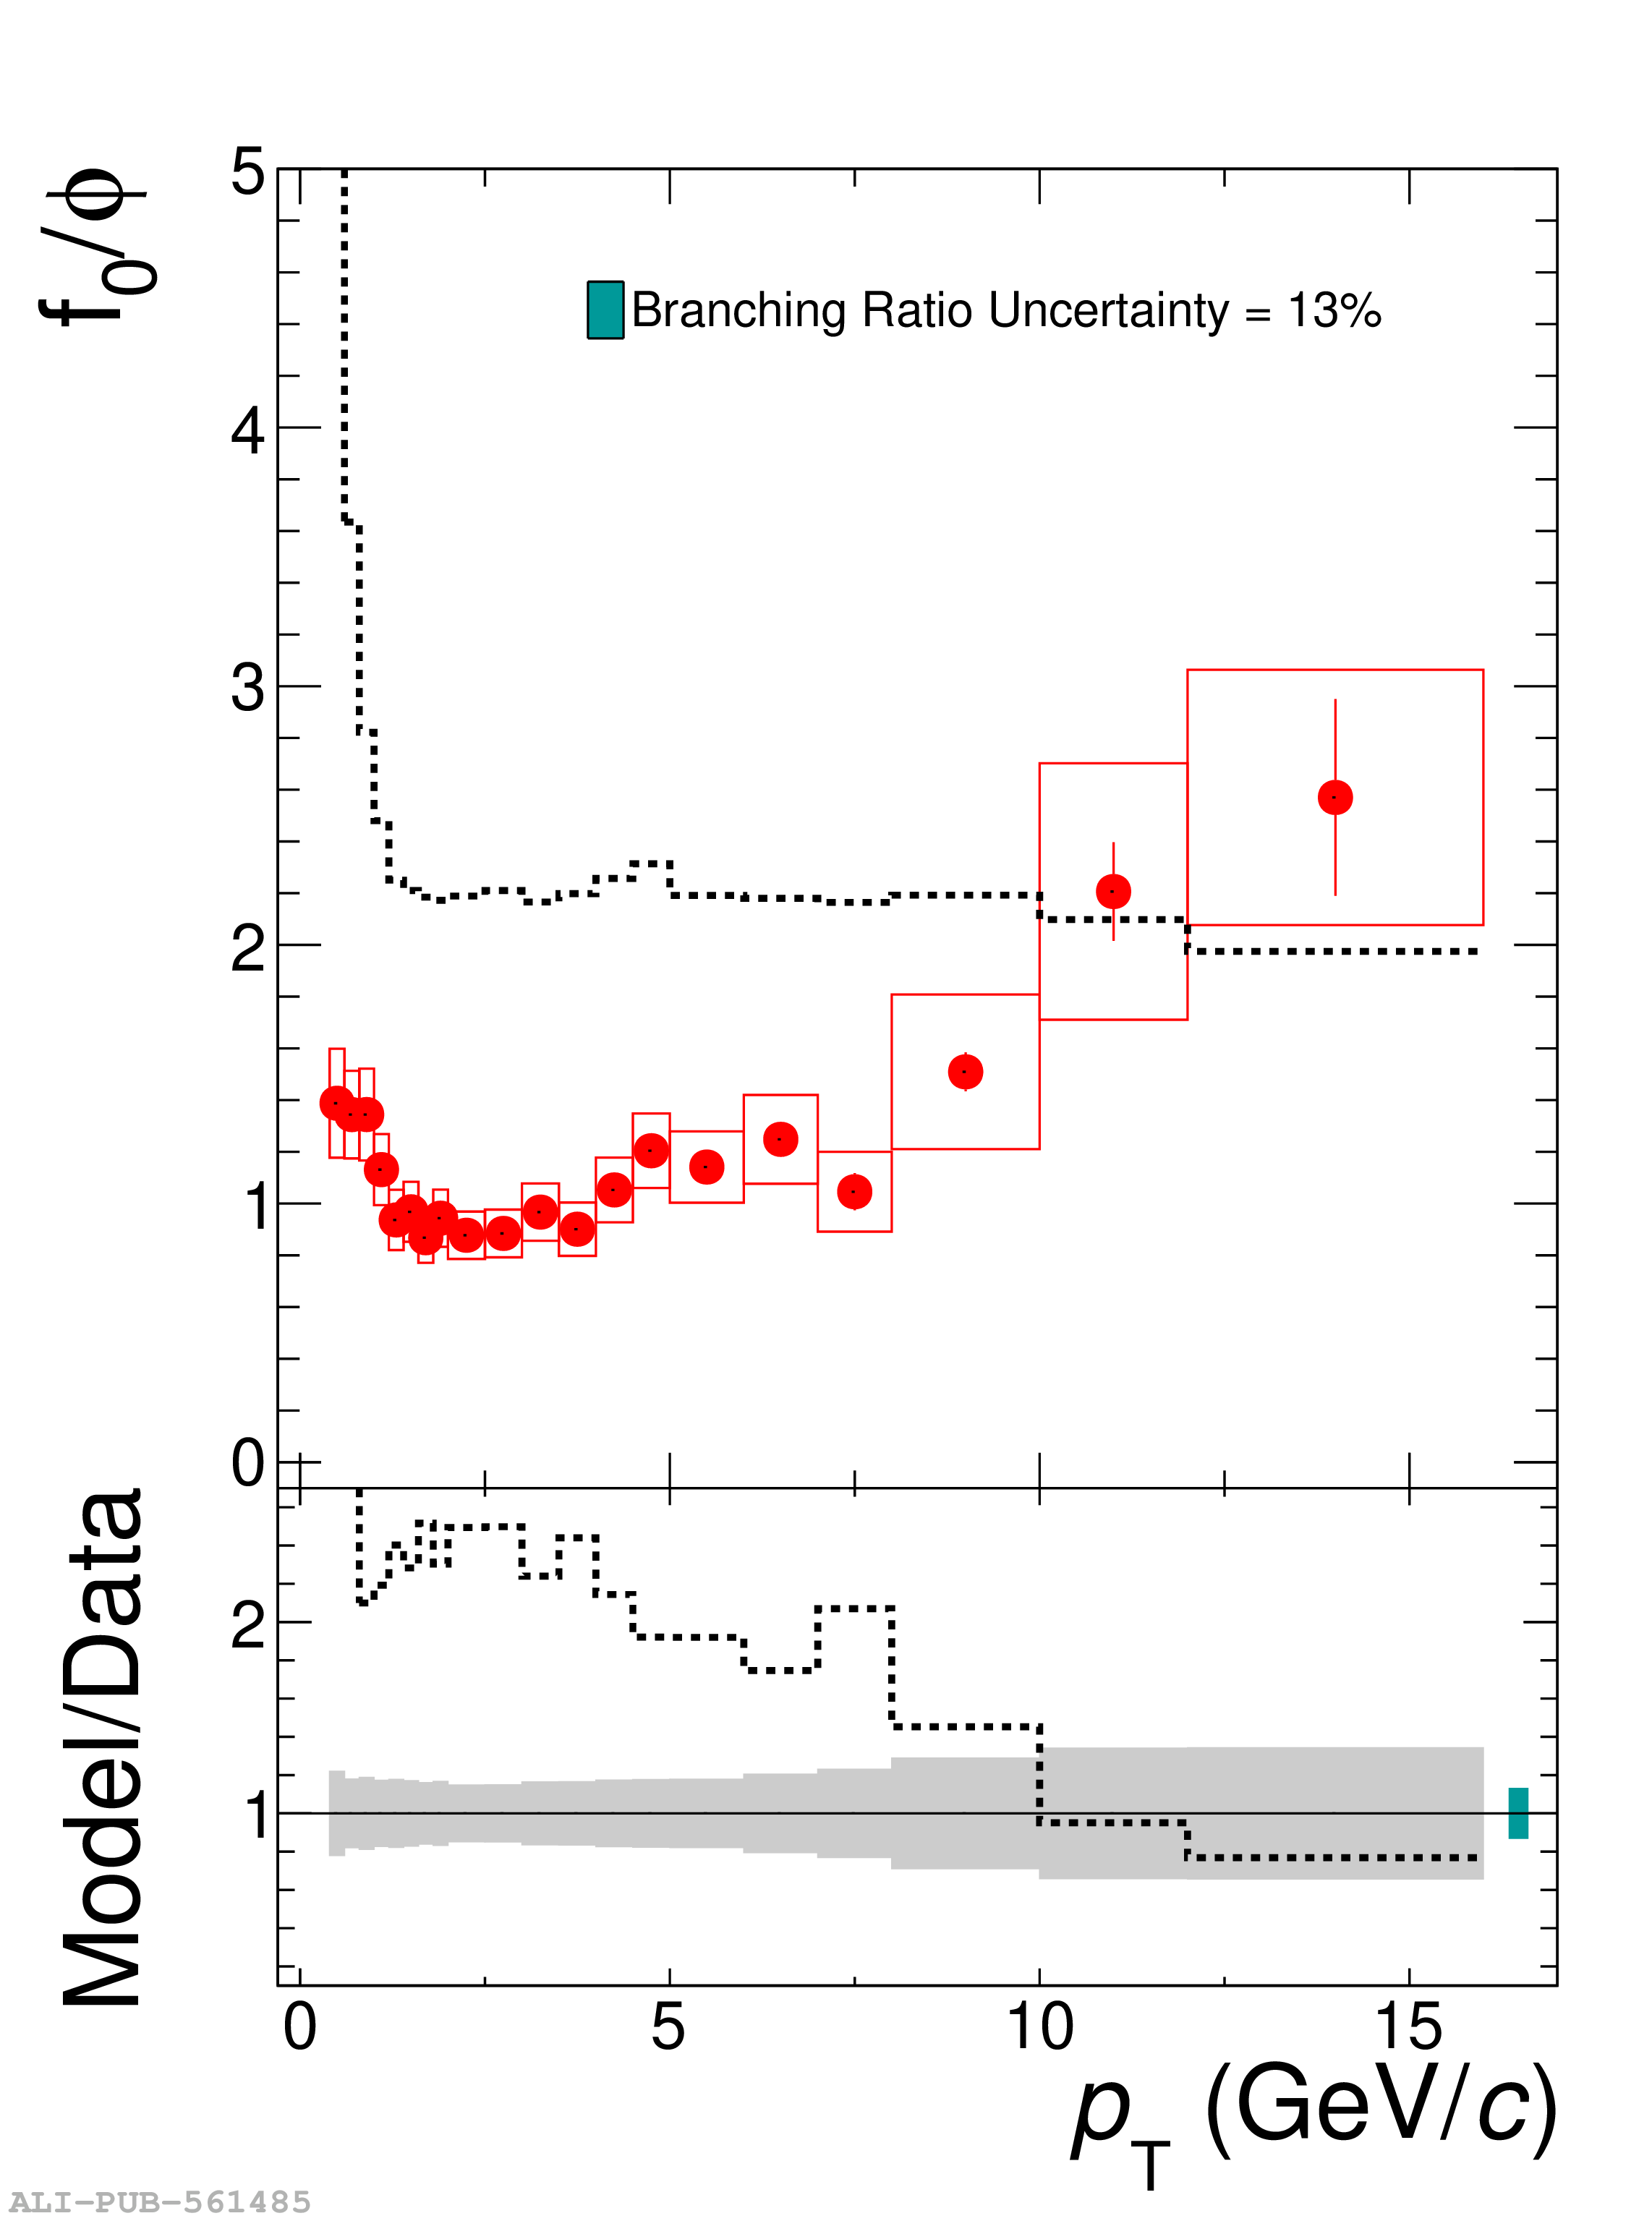 |