Left (right) plot shows the invariant mass distribution of $\pi^{+}\pi^{-}$ pairs after like-sign background subtraction in low (high) transverse-momentum interval in pp collisions at $\sqrt{s}$ = 5.02 TeV in $\vert y\vert < 0.5$. Solid blue curves represent fits with the function shown in Eq. (1) and a residual background shown in Eq. (3). Solid red curve represents ${\rm f_0(980)}$ signal while other dashed curves represent the background contributions from $\rho{\rm(770)}$, ${\rm f_2(1270)}$ and residual background. | 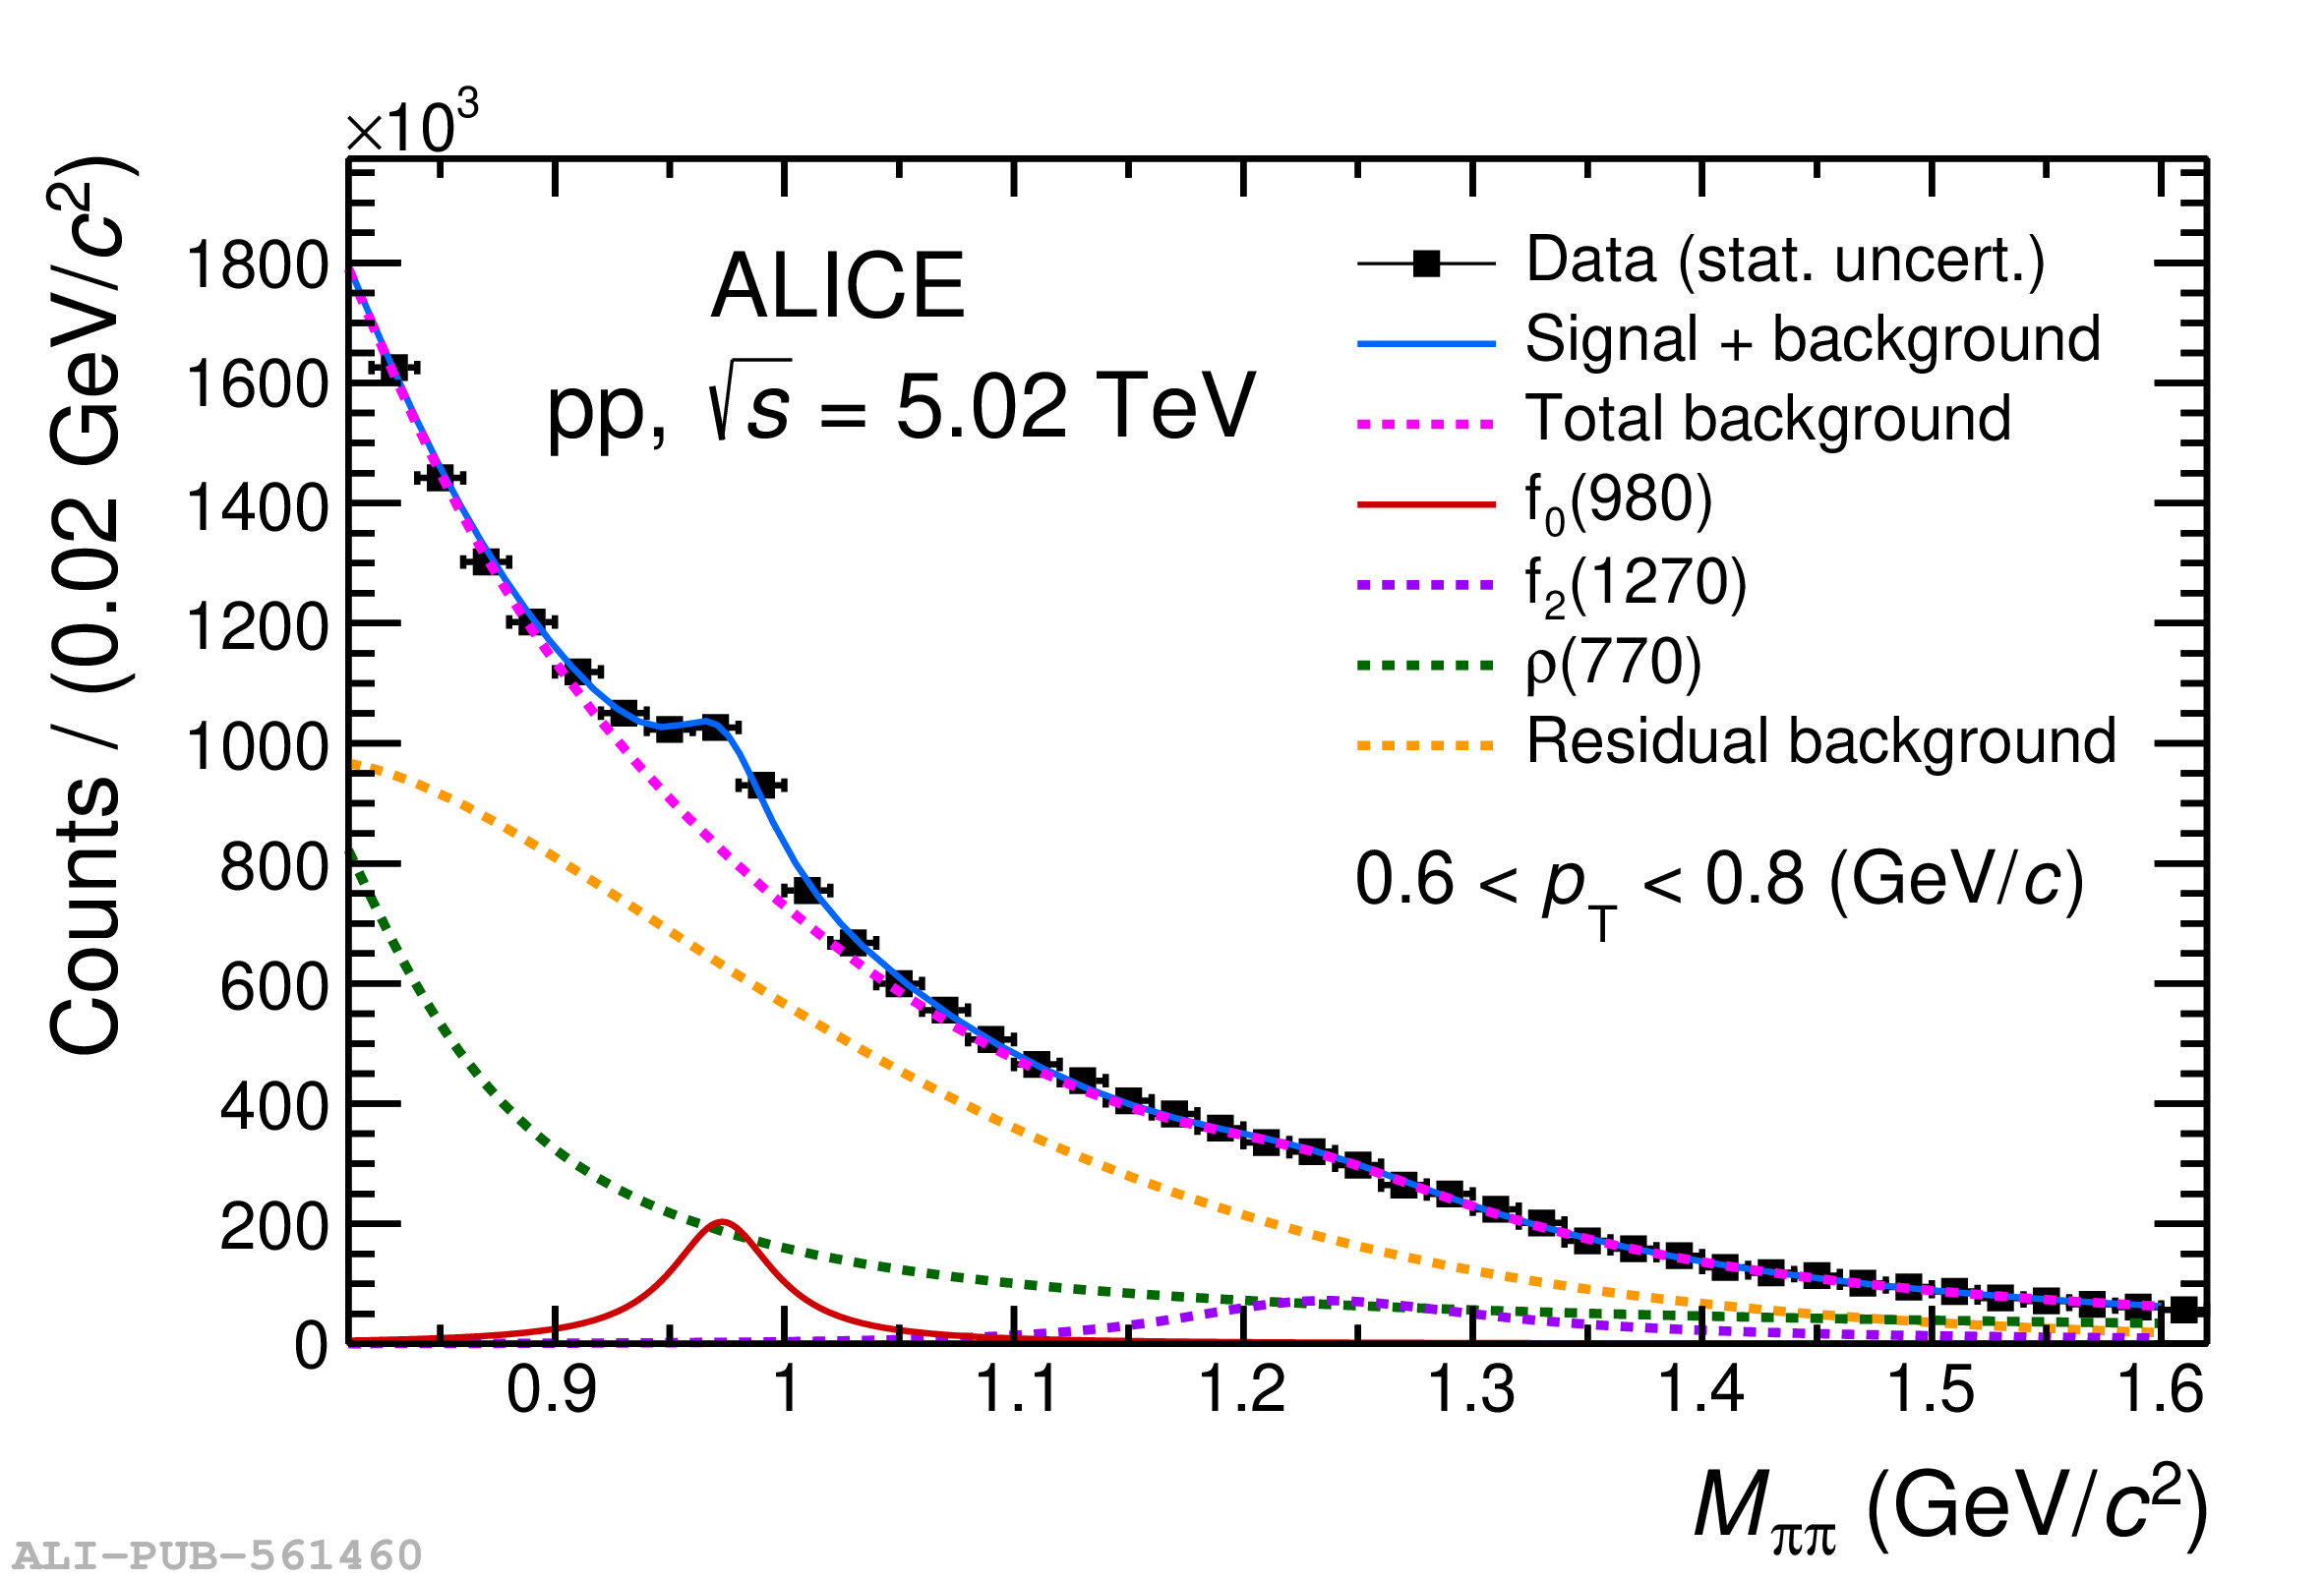 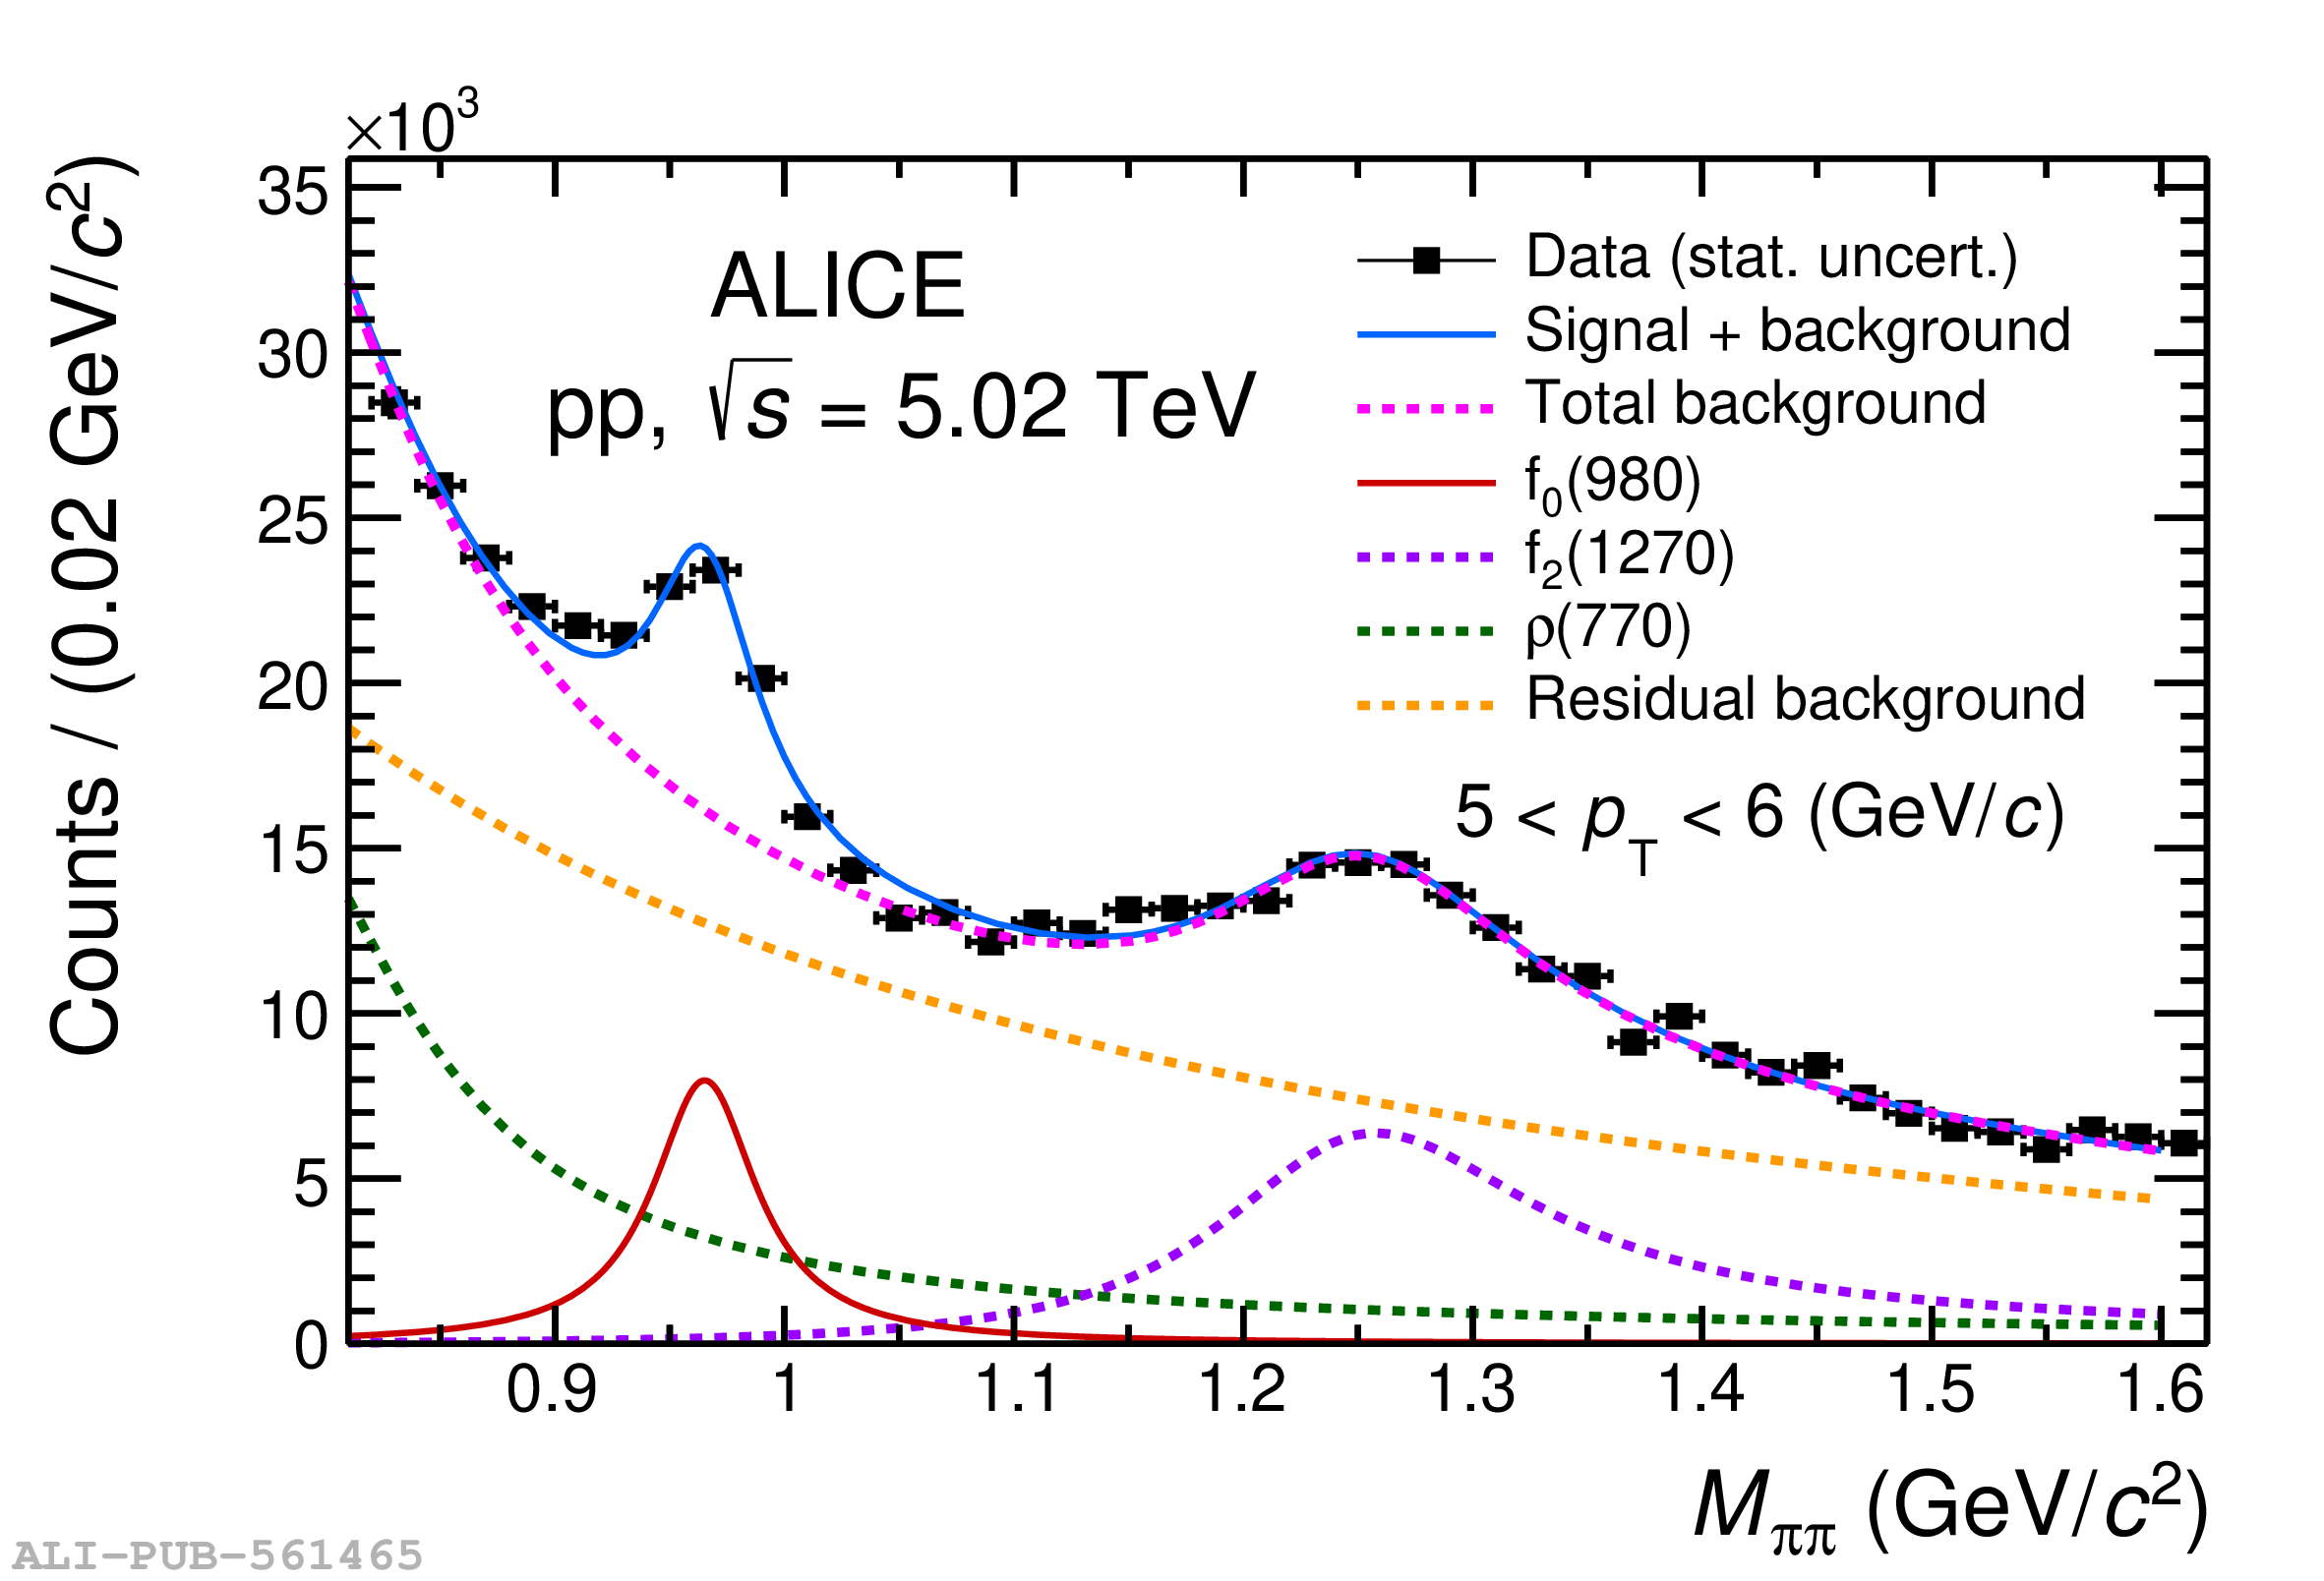 |