Inclusive transverse momentum spectra of primary charged particles in Pb-Pb collisions at $\sqrt{s_{_{\rm NN}}}$ = 2.76 TeV have been measured by the ALICE Collaboration at the LHC. The data are presented for central and peripheral collisions, corresponding to 0-5% and 70-80% of the hadronic Pb-Pb cross section. The measured charged particle spectra in $|\eta|<~0.8$ and $0.3 <~ p_T <~ 20$ GeV/$c$ are compared to the expectation in pp collisions at the same $\sqrt{s_{\rm NN}}$, scaled by the number of underlying nucleon-nucleon collisions. The comparison is expressed in terms of the nuclear modification factor $R_{\rm AA}$. The result indicates only weak medium effects ($R_{\rm AA} \approx $ 0.7) in peripheral collisions. In central collisions, $R_{\rm AA}$ reaches a minimum of about 0.14 at $p_{\rm T}=6$-7GeV/$c$ and increases significantly at larger $p_{\rm T}$. The measured suppression of high-$p_{\rm T}$ particles is stronger than that observed at lower collision energies, indicating that a very dense medium is formed in central Pb-Pb collisions at the LHC.
Phys. Lett. B 696 (2011) 30-39
HEP Data
e-Print: arXiv:1012.1004 | PDF | inSPIRE
CERN-PH-EP-2010-066
Figure 1
Upper panel: Correlation between VZERO amplitude and the uncorrected track multiplicity in the TPC. Indicated are the cuts for the centrality ranges used in this analysis Lower panel: Minimum-bias distribution of the TPC track multiplicity. The central (0--5%) and peripheral (70--80%) event sub samples used for this analysis are shown as grey histograms. | 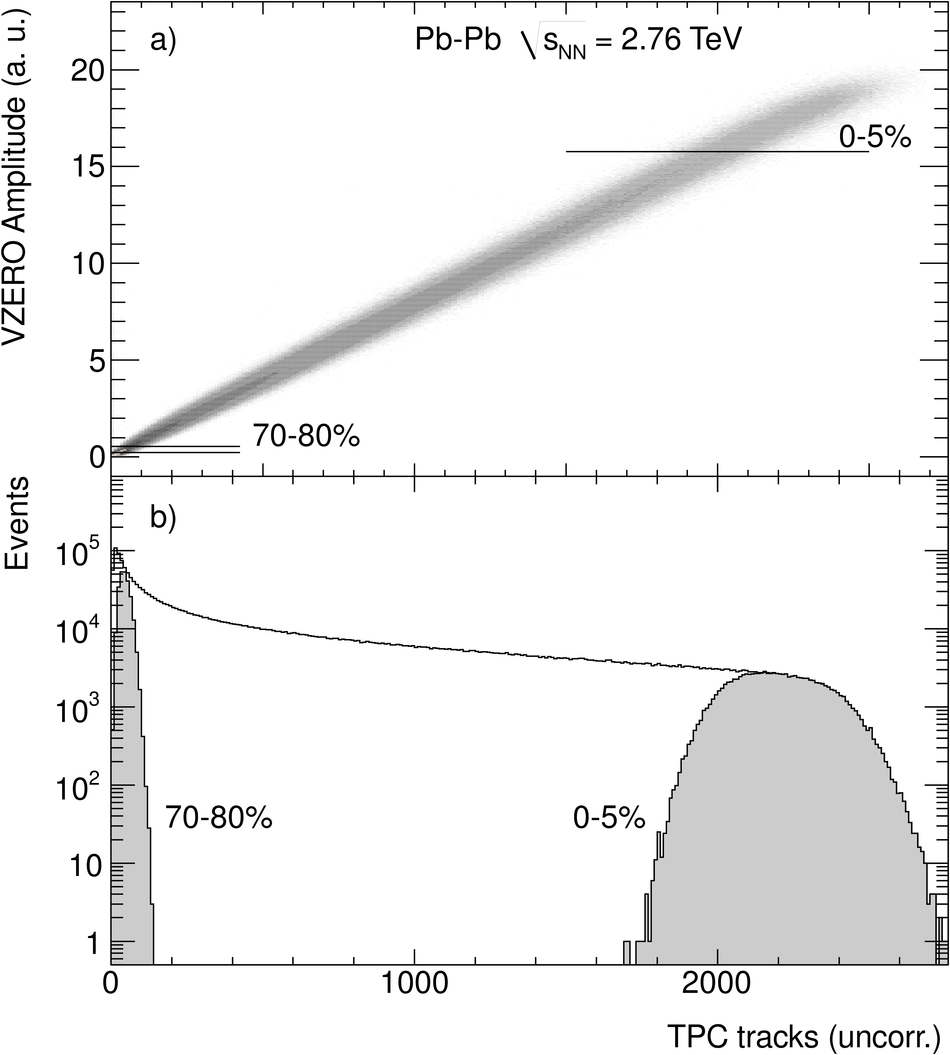 |
Figure 2
The $p_T$ distributions of primary charged particles at mid-rapidity ($|\eta|< 0.8$) in central (0--5%) and peripheral (70--80%)Pb--Pb collisions at $\sqrt{s_{_{NN}}} = 2.76 $TeV. Error bars are statistical only. The systematic data errors are smaller than the symbols The scaled pp references are shown as the two curves, the upper for 0--5% centrality and the lower for 70--80% The systematic uncertainties of the pp reference spectra are contained within the thickness of the line. | 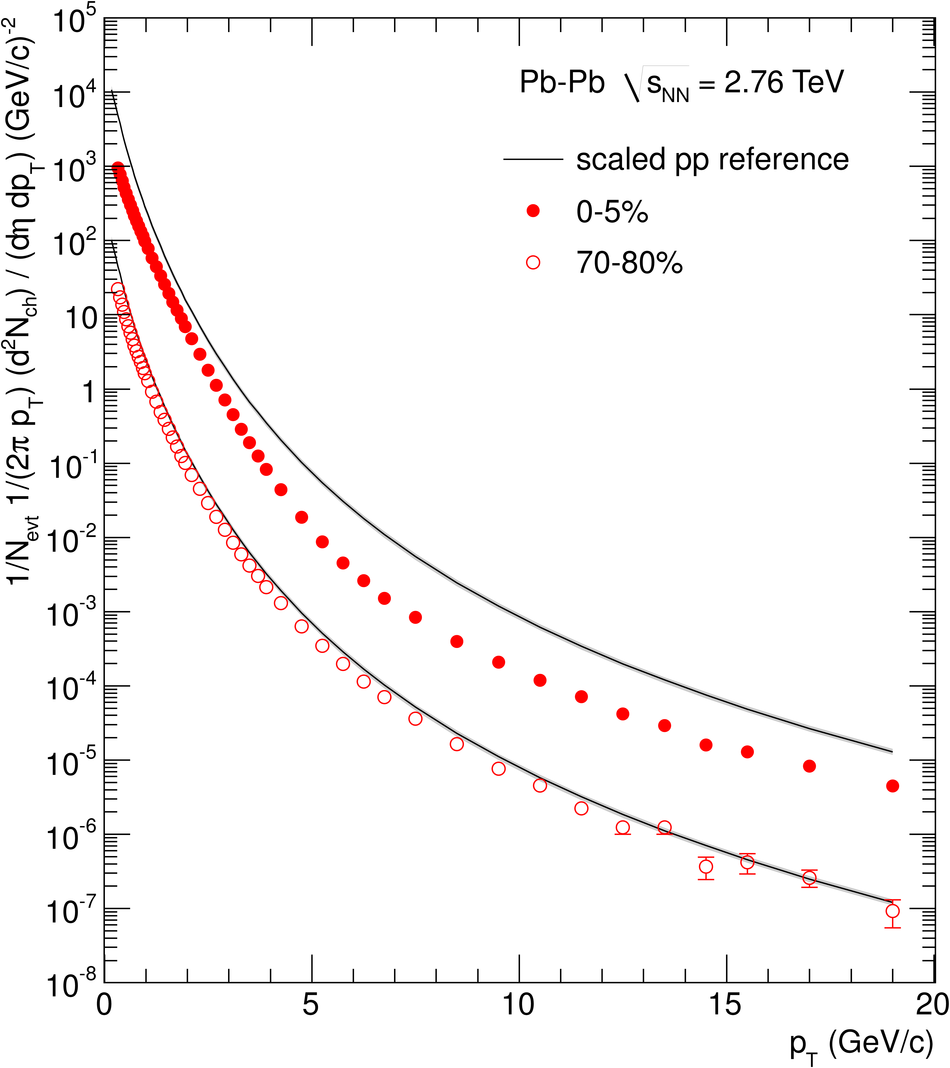 |
Figure 3
$R_{AA}$ in central (0--5%) and peripheral (70--80%) Pb--Pb collisions at $\sqrt{s_{_{NN}}} =2.76$ TeV. Error bars indicate the statistical uncertainties. The boxes contain the systematic errors in the data and the $p_T$ dependent systematic errors on the pp reference, added in quadrature. The histograms indicate, for central collisions only, the result for$R_{AA}$ at $p_T>6.5$ GeV/$c$ using alternative pp references obtained by the use of the p$\bar{\rm p}$measurement at $\sqrt{s_{_{NN}}}=1.96$ TeV [26] in the interpolation procedure (solid) and by applying NLO scaling to the pp data at 0.9 TeV (dashed) (see text) The vertical bars around $R_{AA}=1$ show the $p_T$ independent uncertainty on $\langle N_{\rm{ coll}} \rangle$ | 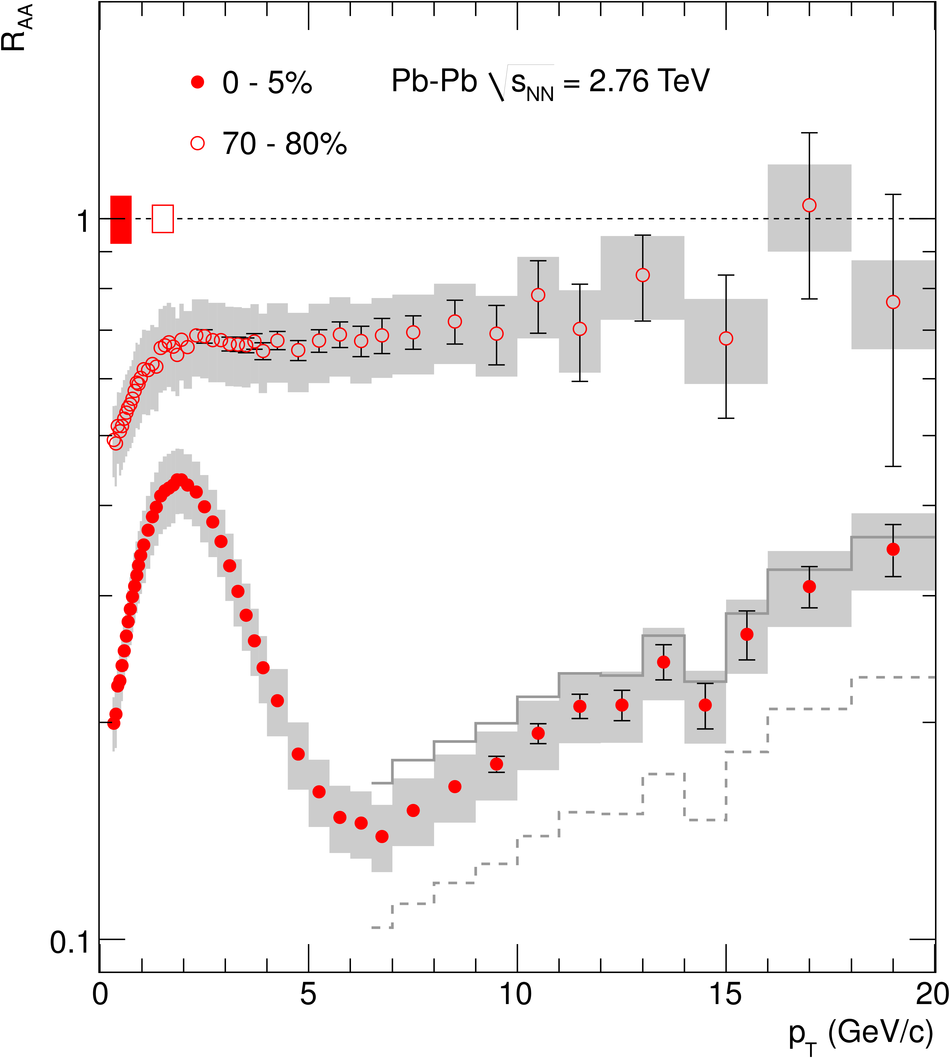 |
Figure 4
Comparison of $R_{AA}$ in central Pb-Pb collisions at LHC to measurements at $\sqrt{s_{_{ NN}}}=200$ GeV by the PHENIX [30] and STAR [31] experiments at RHIC. The error representation of the ALICE data is as in Fig.3. The statistical and systematic errors of the PHENIX data are shown as error bars and boxes, respectively The statistical and systematic errors of the STAR data are combined and shown as boxes. The vertical bars around $R_{AA} = 1$ indicate the $p_T$ independent scaling errors on $R_{AA}$. | 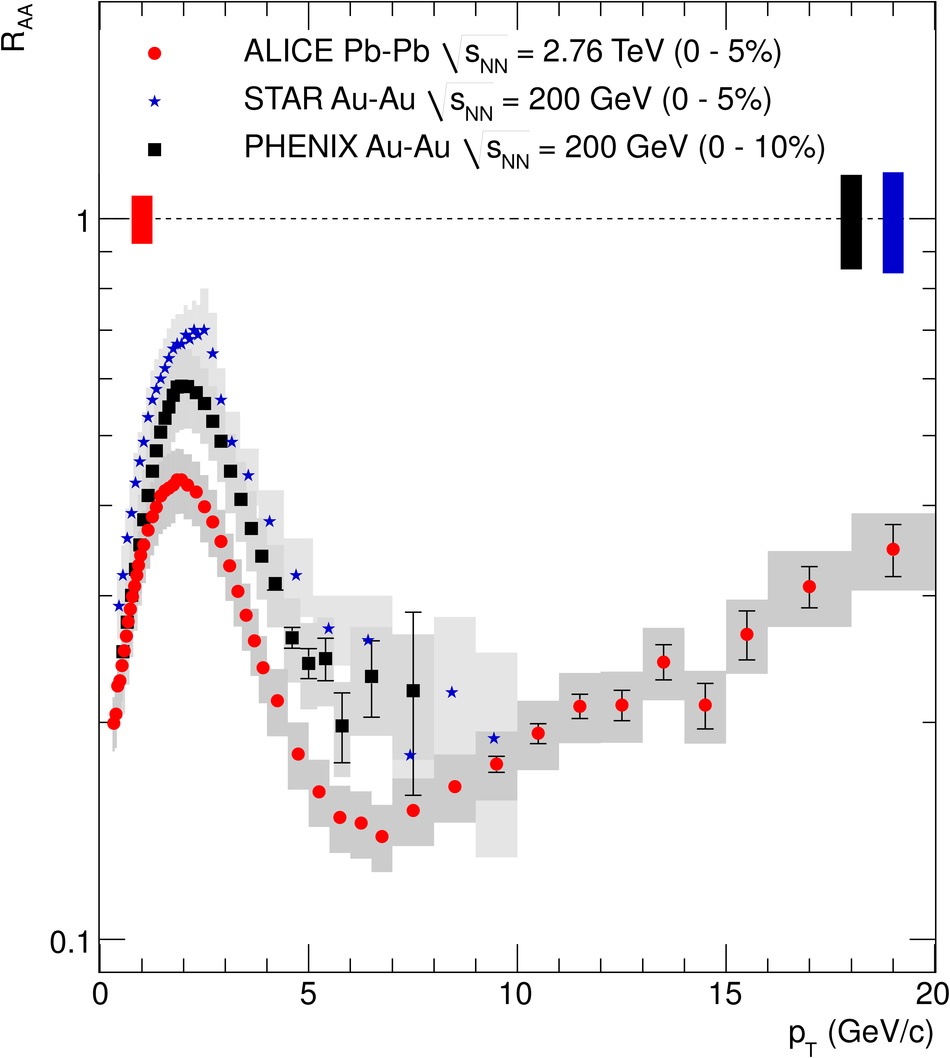 |