Top panels: $z_{||}^{\textrm{ch}}$-differential yield of $R=0.3$ charm jets tagged with $\mathrm{D^{0}}$ mesons normalised by the number of $\mathrm{D^{0}}$ jets within each distribution in pp collisions at $\sqrt{s}$ = 5.02 TeV in four $p_{\mathrm{T,ch\,jet}}$ intervals (top left) ${5< p_{\mathrm{T,ch\,jet}} <7}$ GeV/$c$, (top right) $7< p_{\mathrm{T,ch\,jet}} <10$ GeV/$c$, (bottom left) ${10< p_{\mathrm{T,ch\,jet}} <15}$ GeV/$c$ and (bottom right) ${15< p_{\mathrm{T,ch\,jet}} <50}$ GeV/$c$. They are compared to PYTHIA 8 Monash 2013 (dashed-dotted lines), PYTHIA 8 Monash 2013 SoftQCD Mode 2 (dashed lines) and POWHEG hvq + PYTHIA 8 (open circles) predictions. The shaded bands indicate the systematic uncertainty on the distributions while open boxes represent the theoretical uncertainties on the POWHEG predictions. Bottom panels present ratios of MC predictions to the data. |  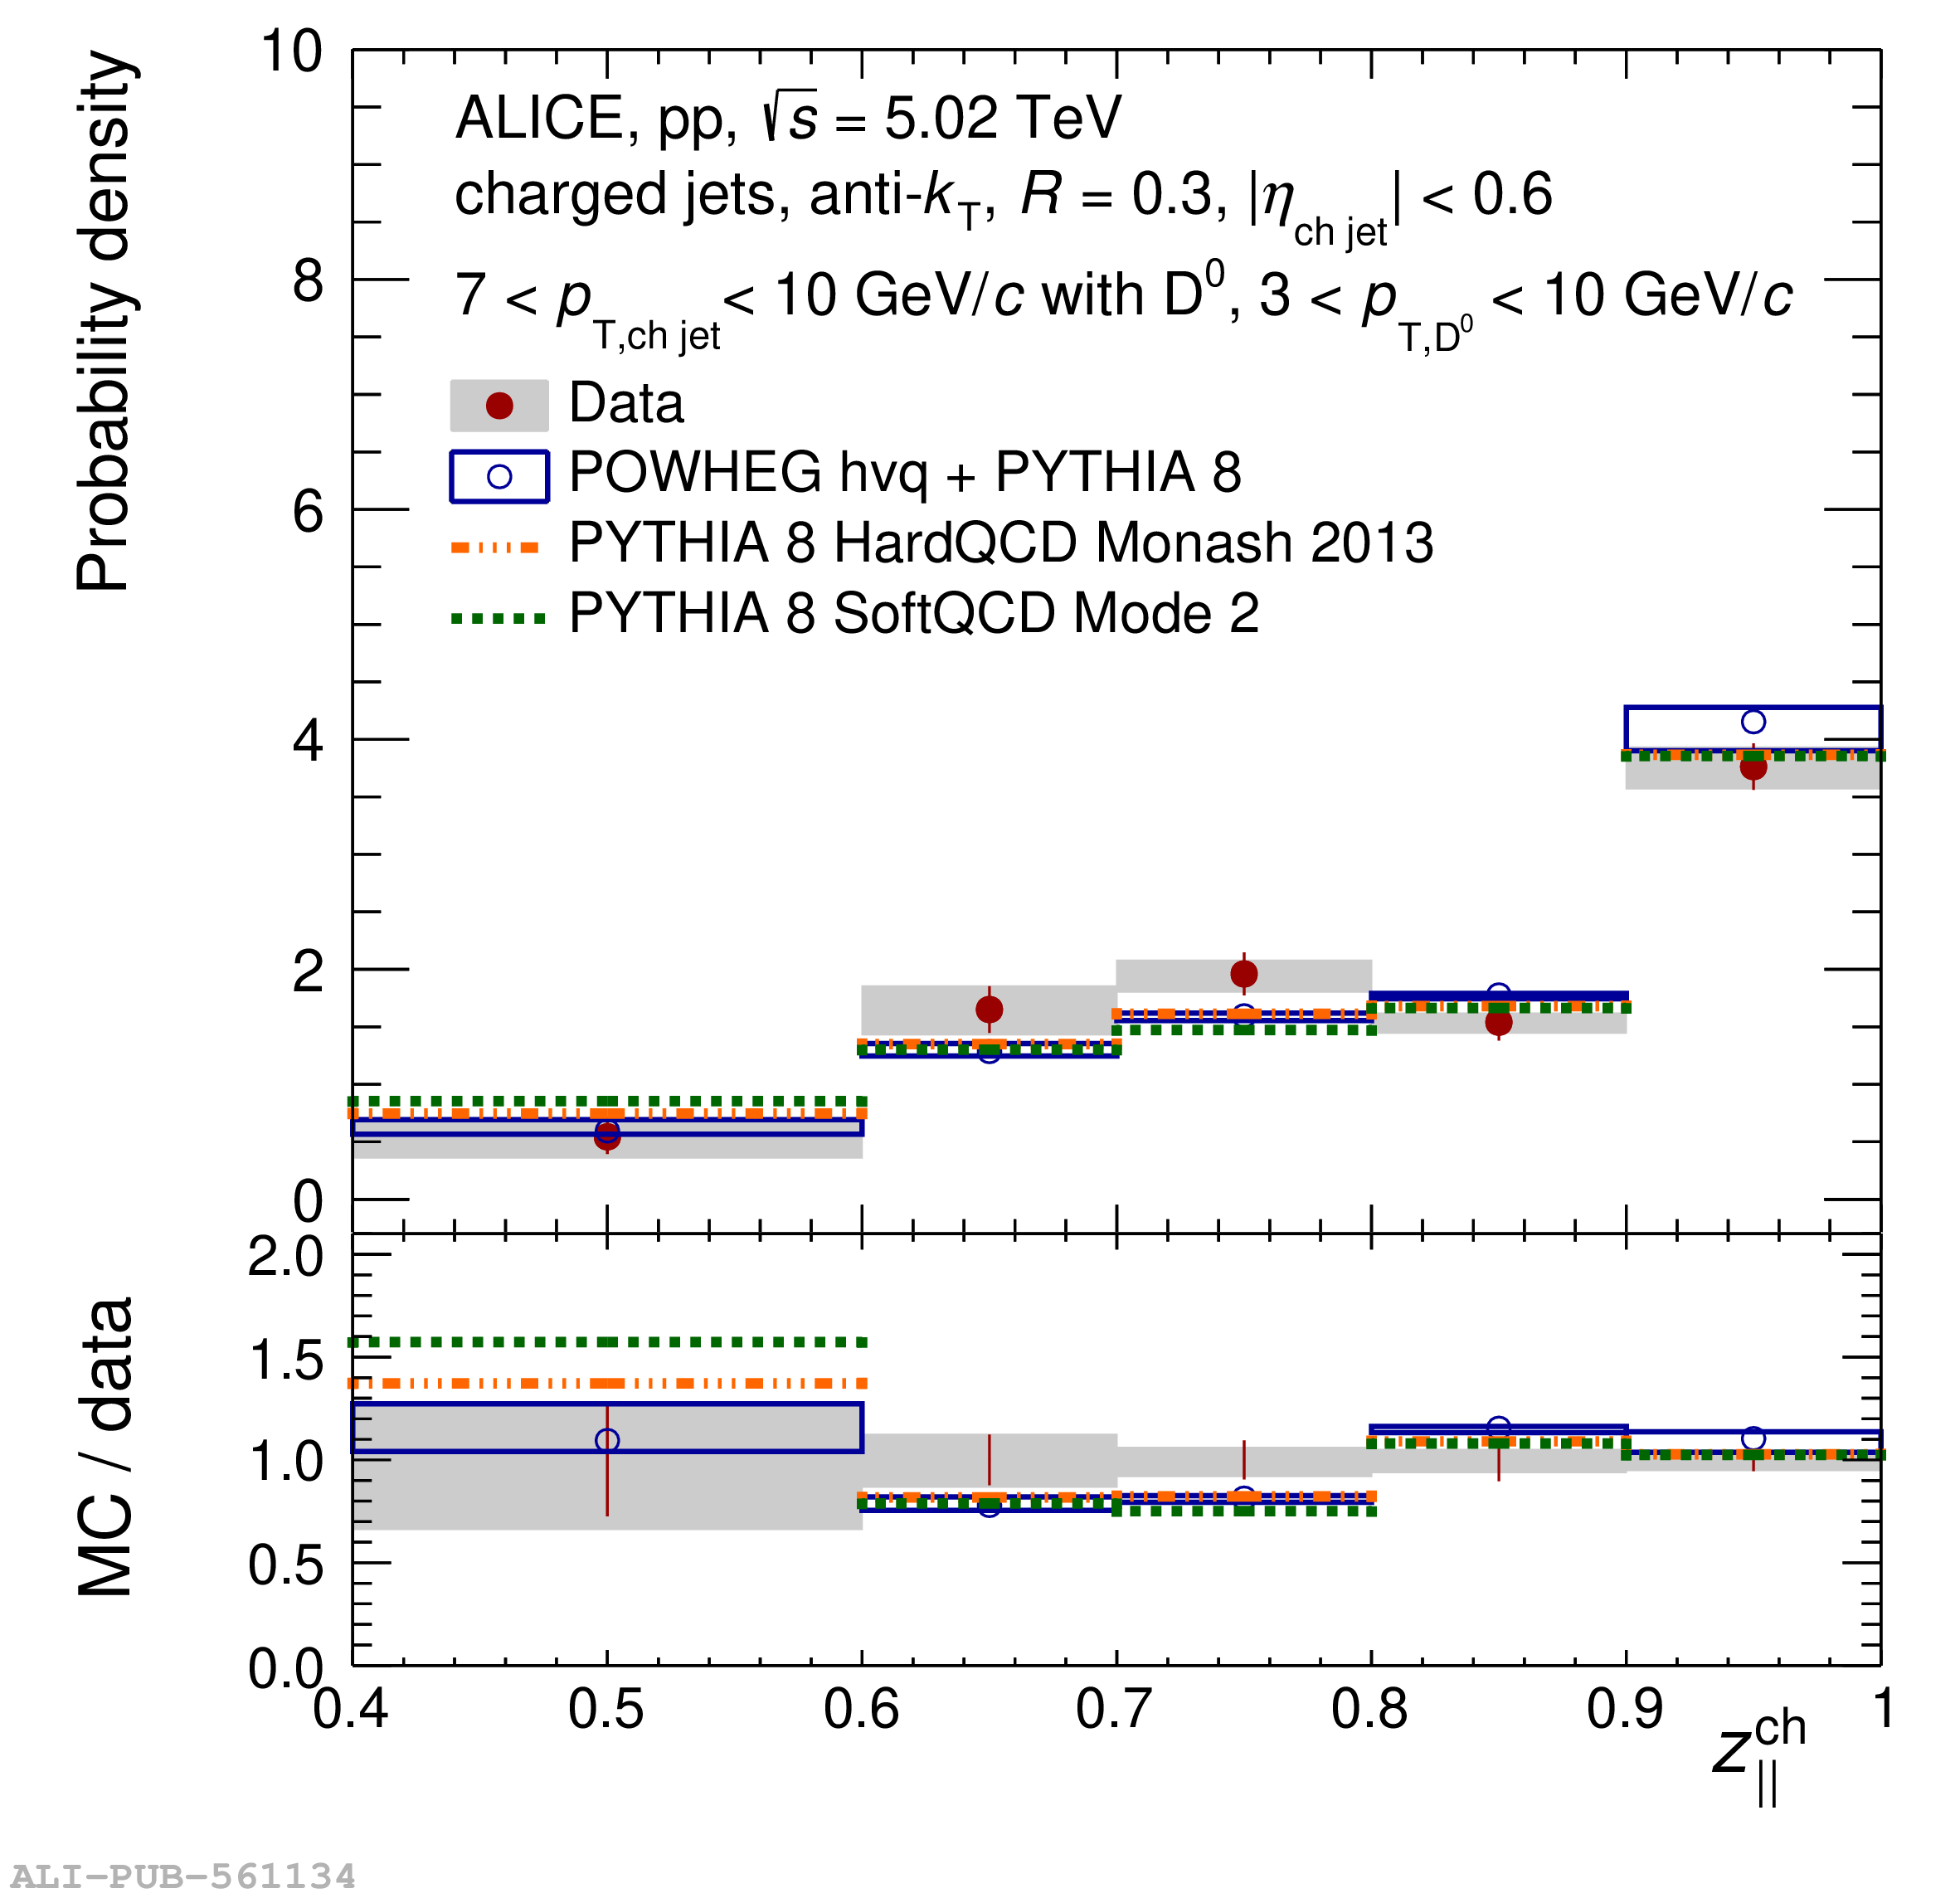 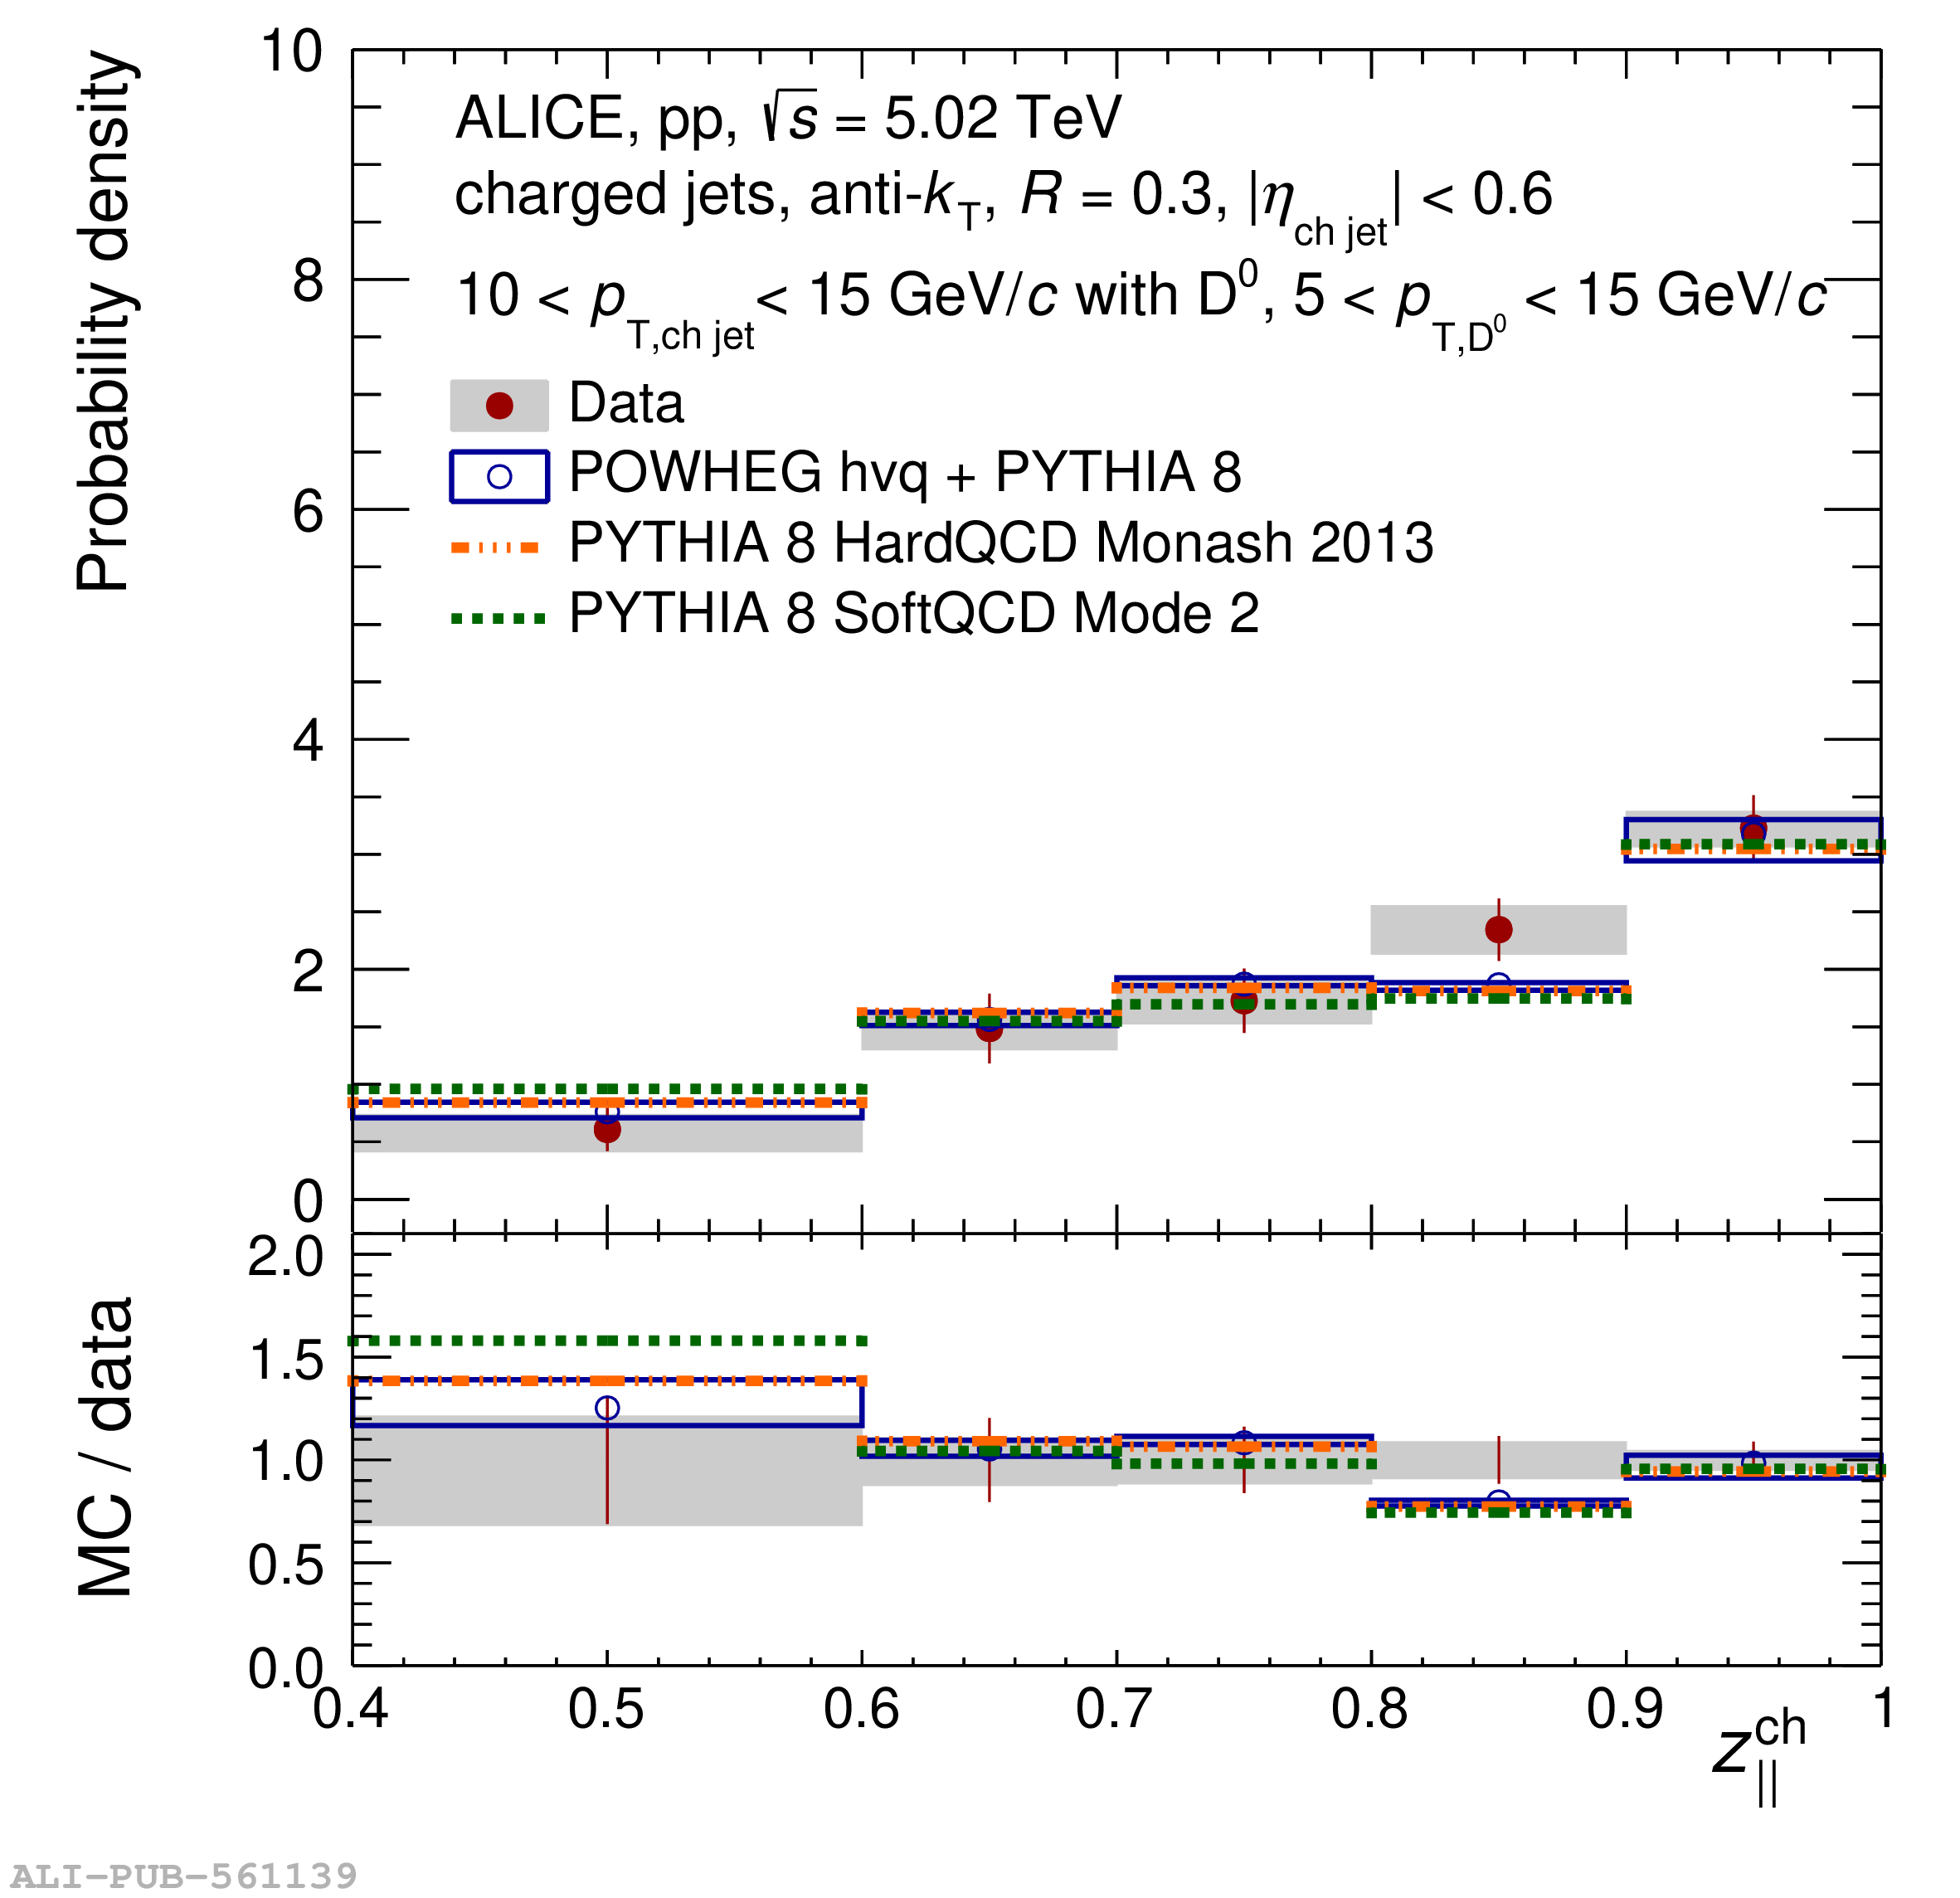 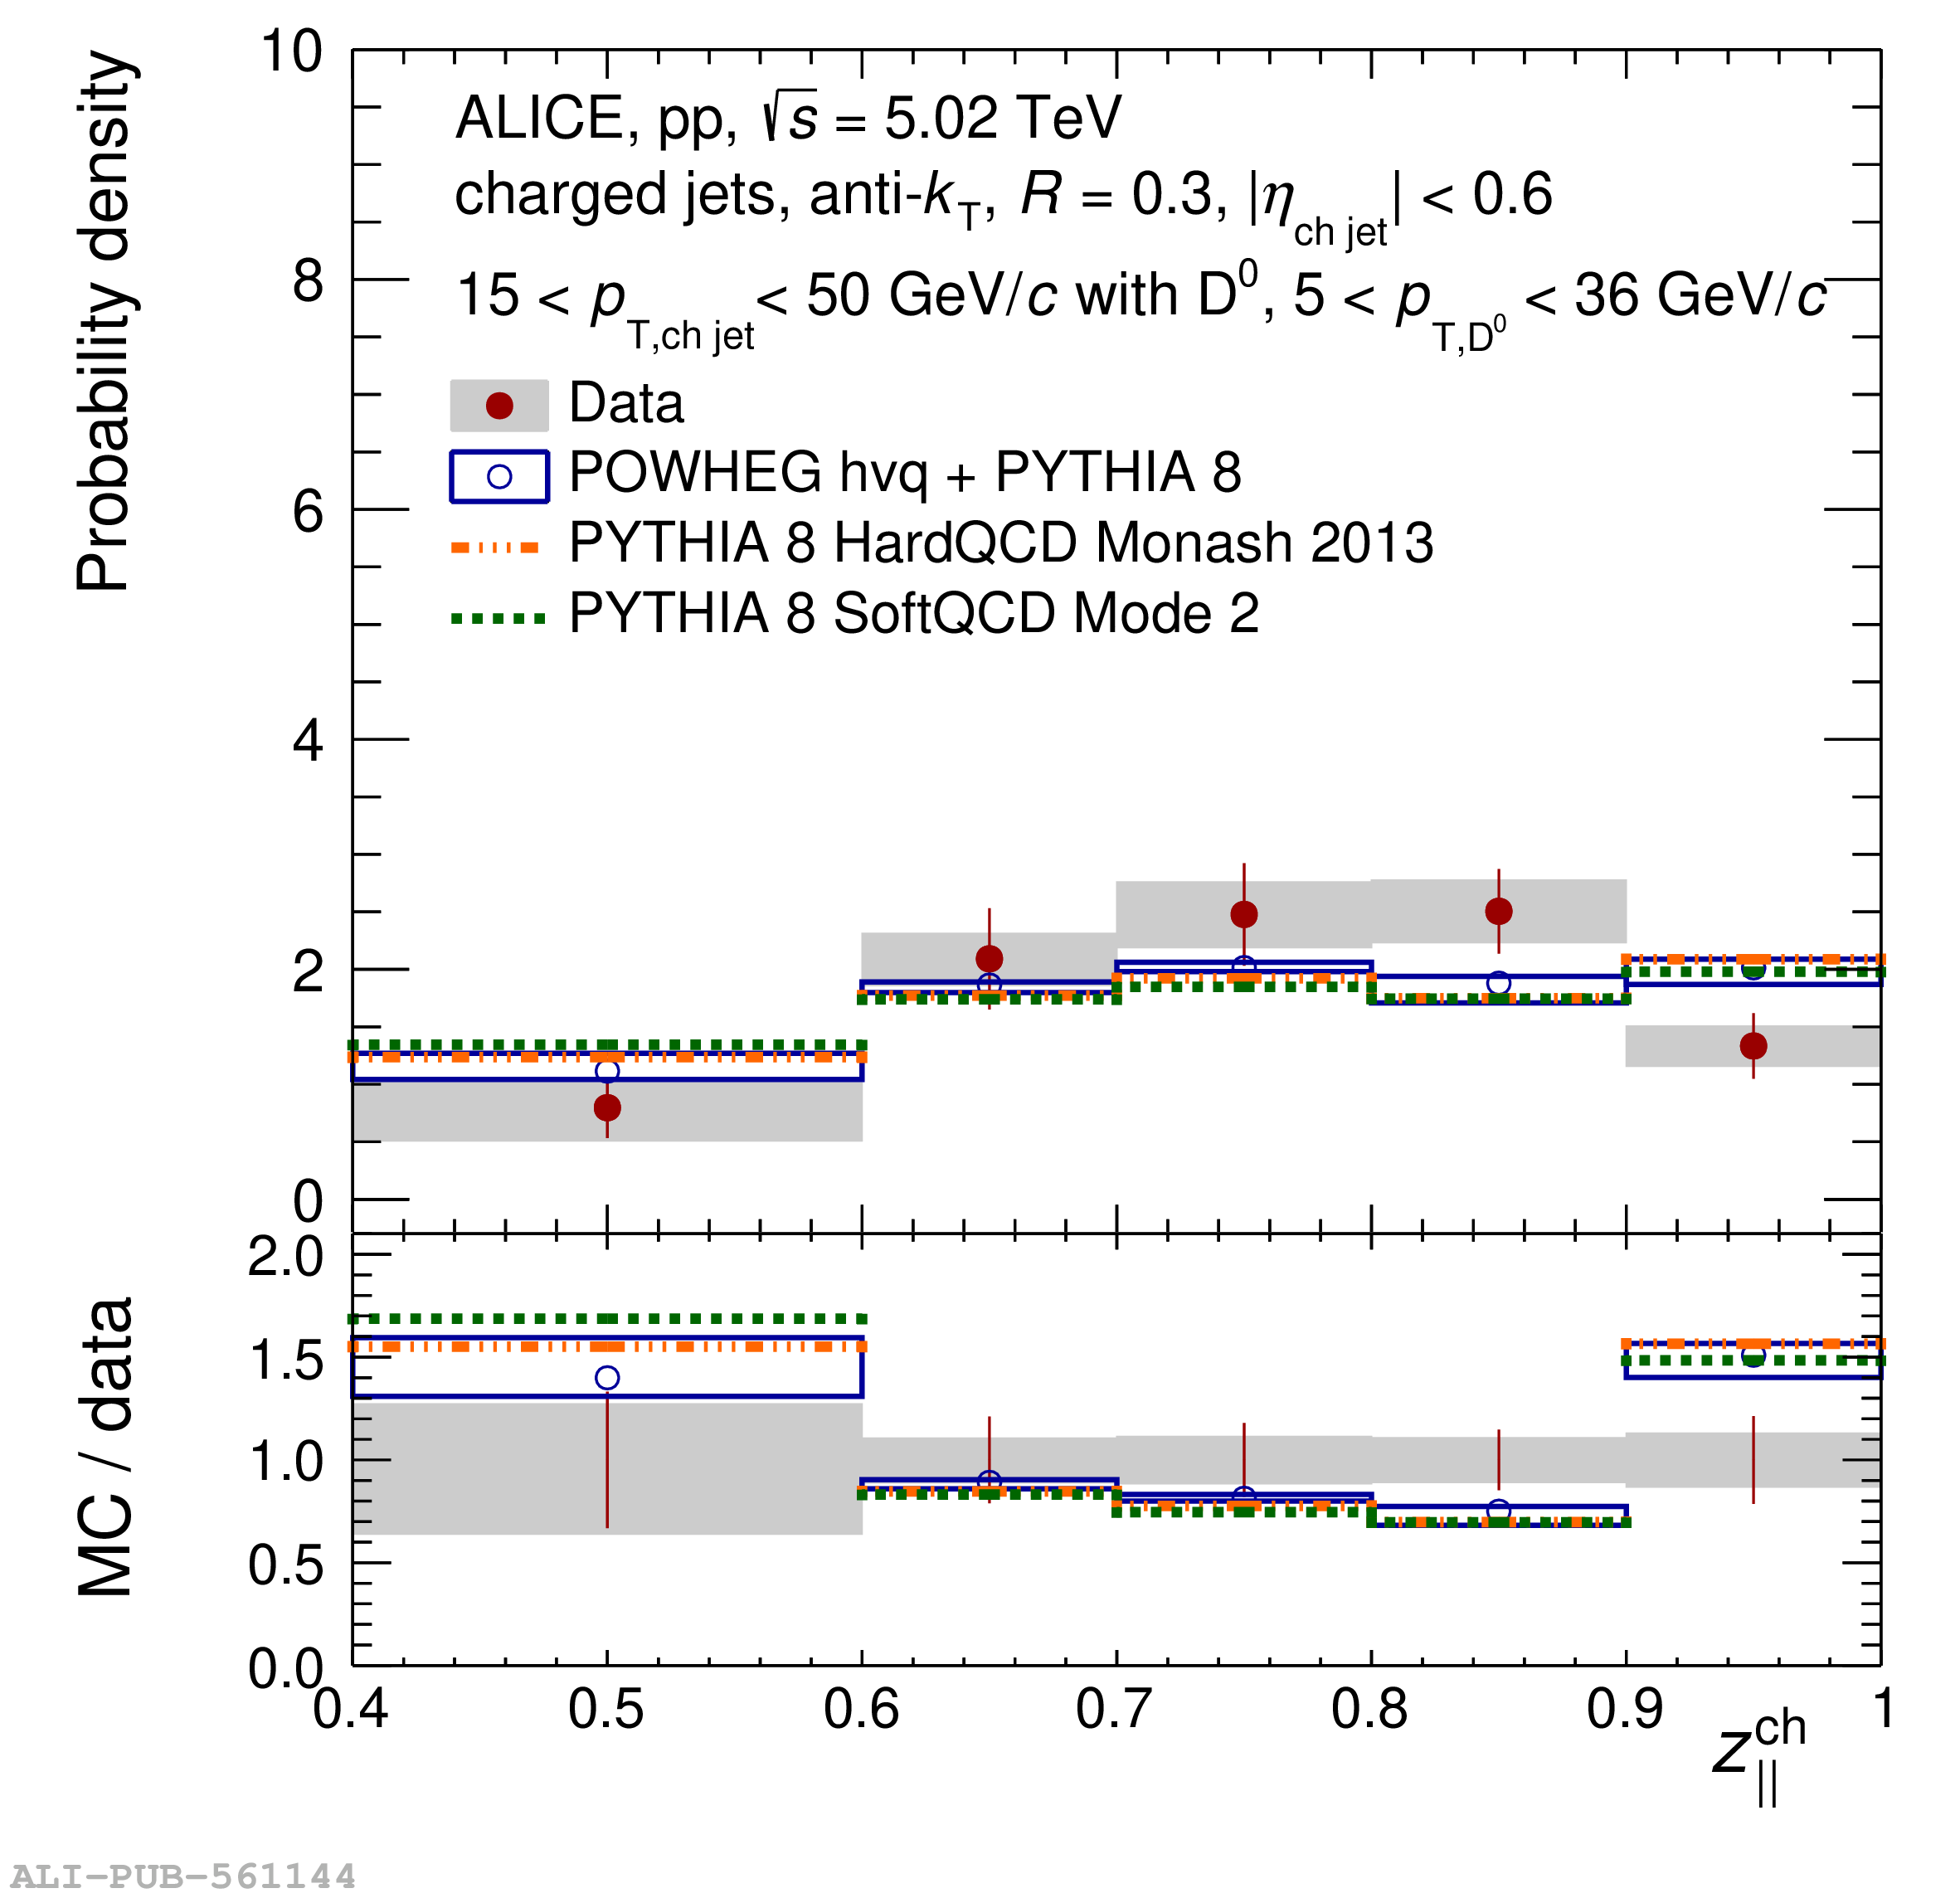 |