Fraction of clusters with $n^{\rm w}_{\rm cell}>4$ within the range $0.1<\sigma_{\rm long}^{2}<0.3$ per \gls{SM}. Left and middle: pp \sthirteen\ \gls{L1} $\gamma$ triggered data. Right: Clusters (enhanced merged decay population by few \%) in \gls{EMCal} for pp \sseven\ minimum bias and \gls{L0} trigger data (black marker), compared to simulations with 2 jets in the final state with different photon trigger thresholds, with (red marker) and without (blue marker) cross-talk tuning. |  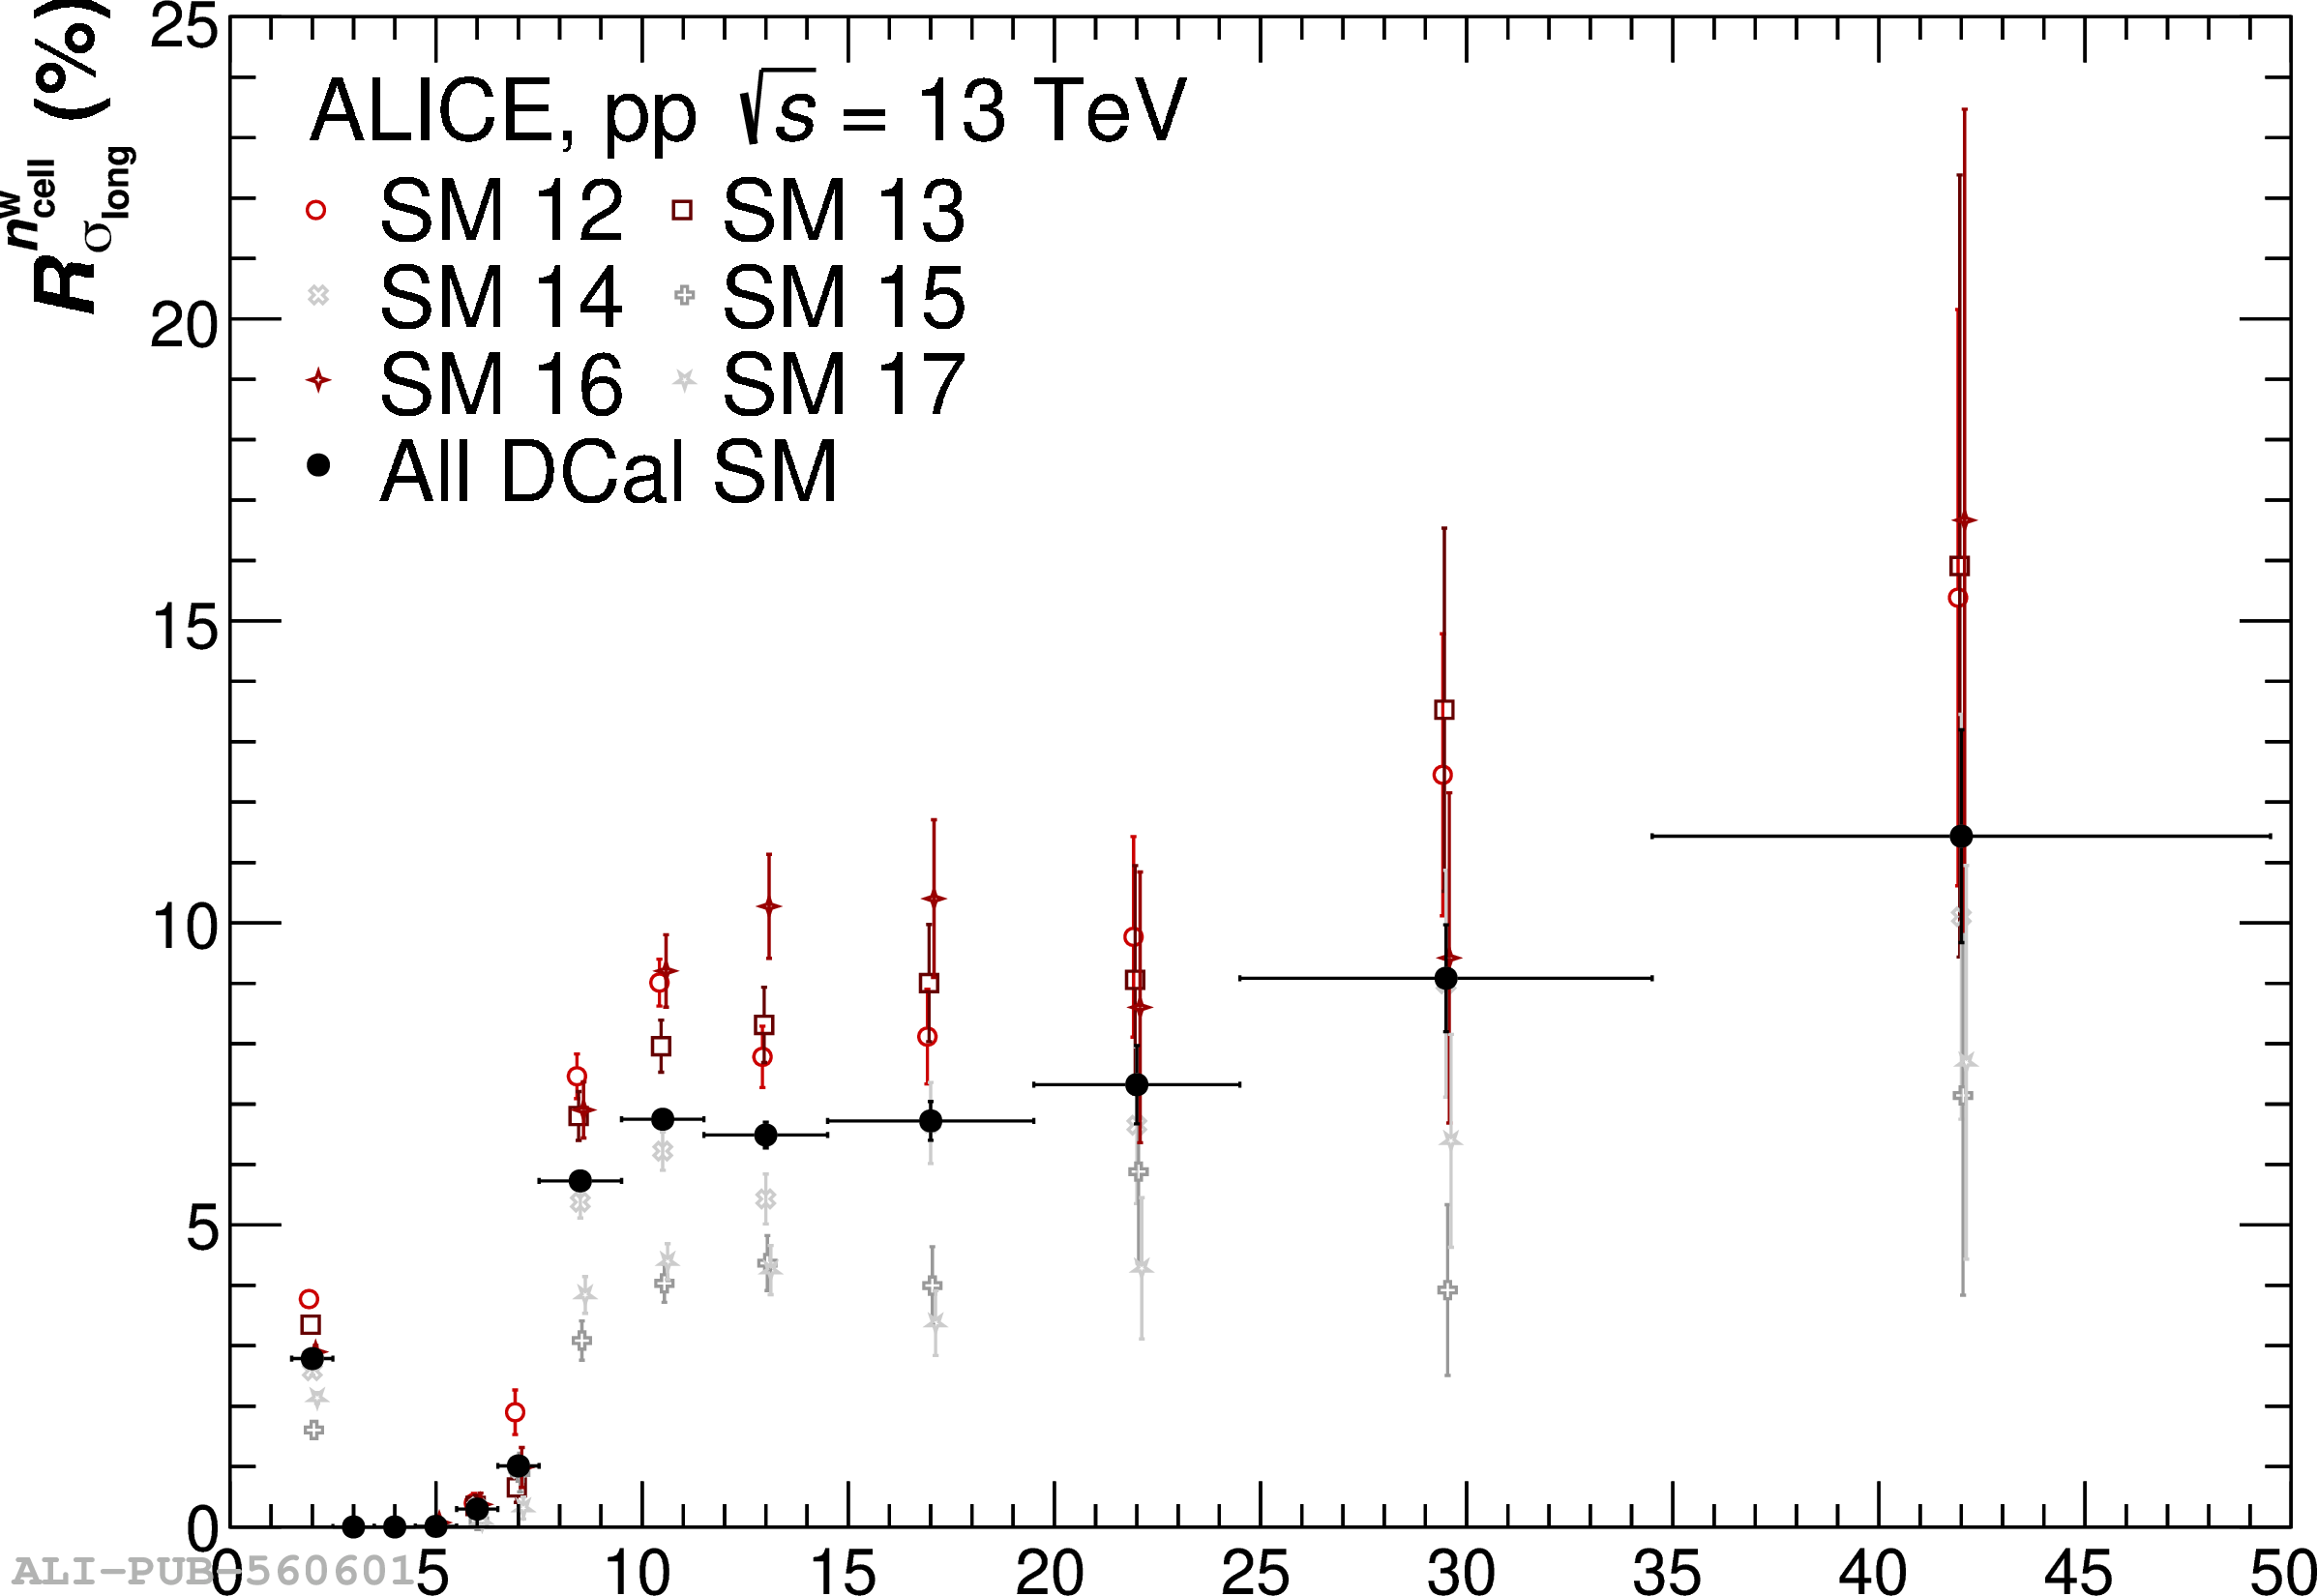 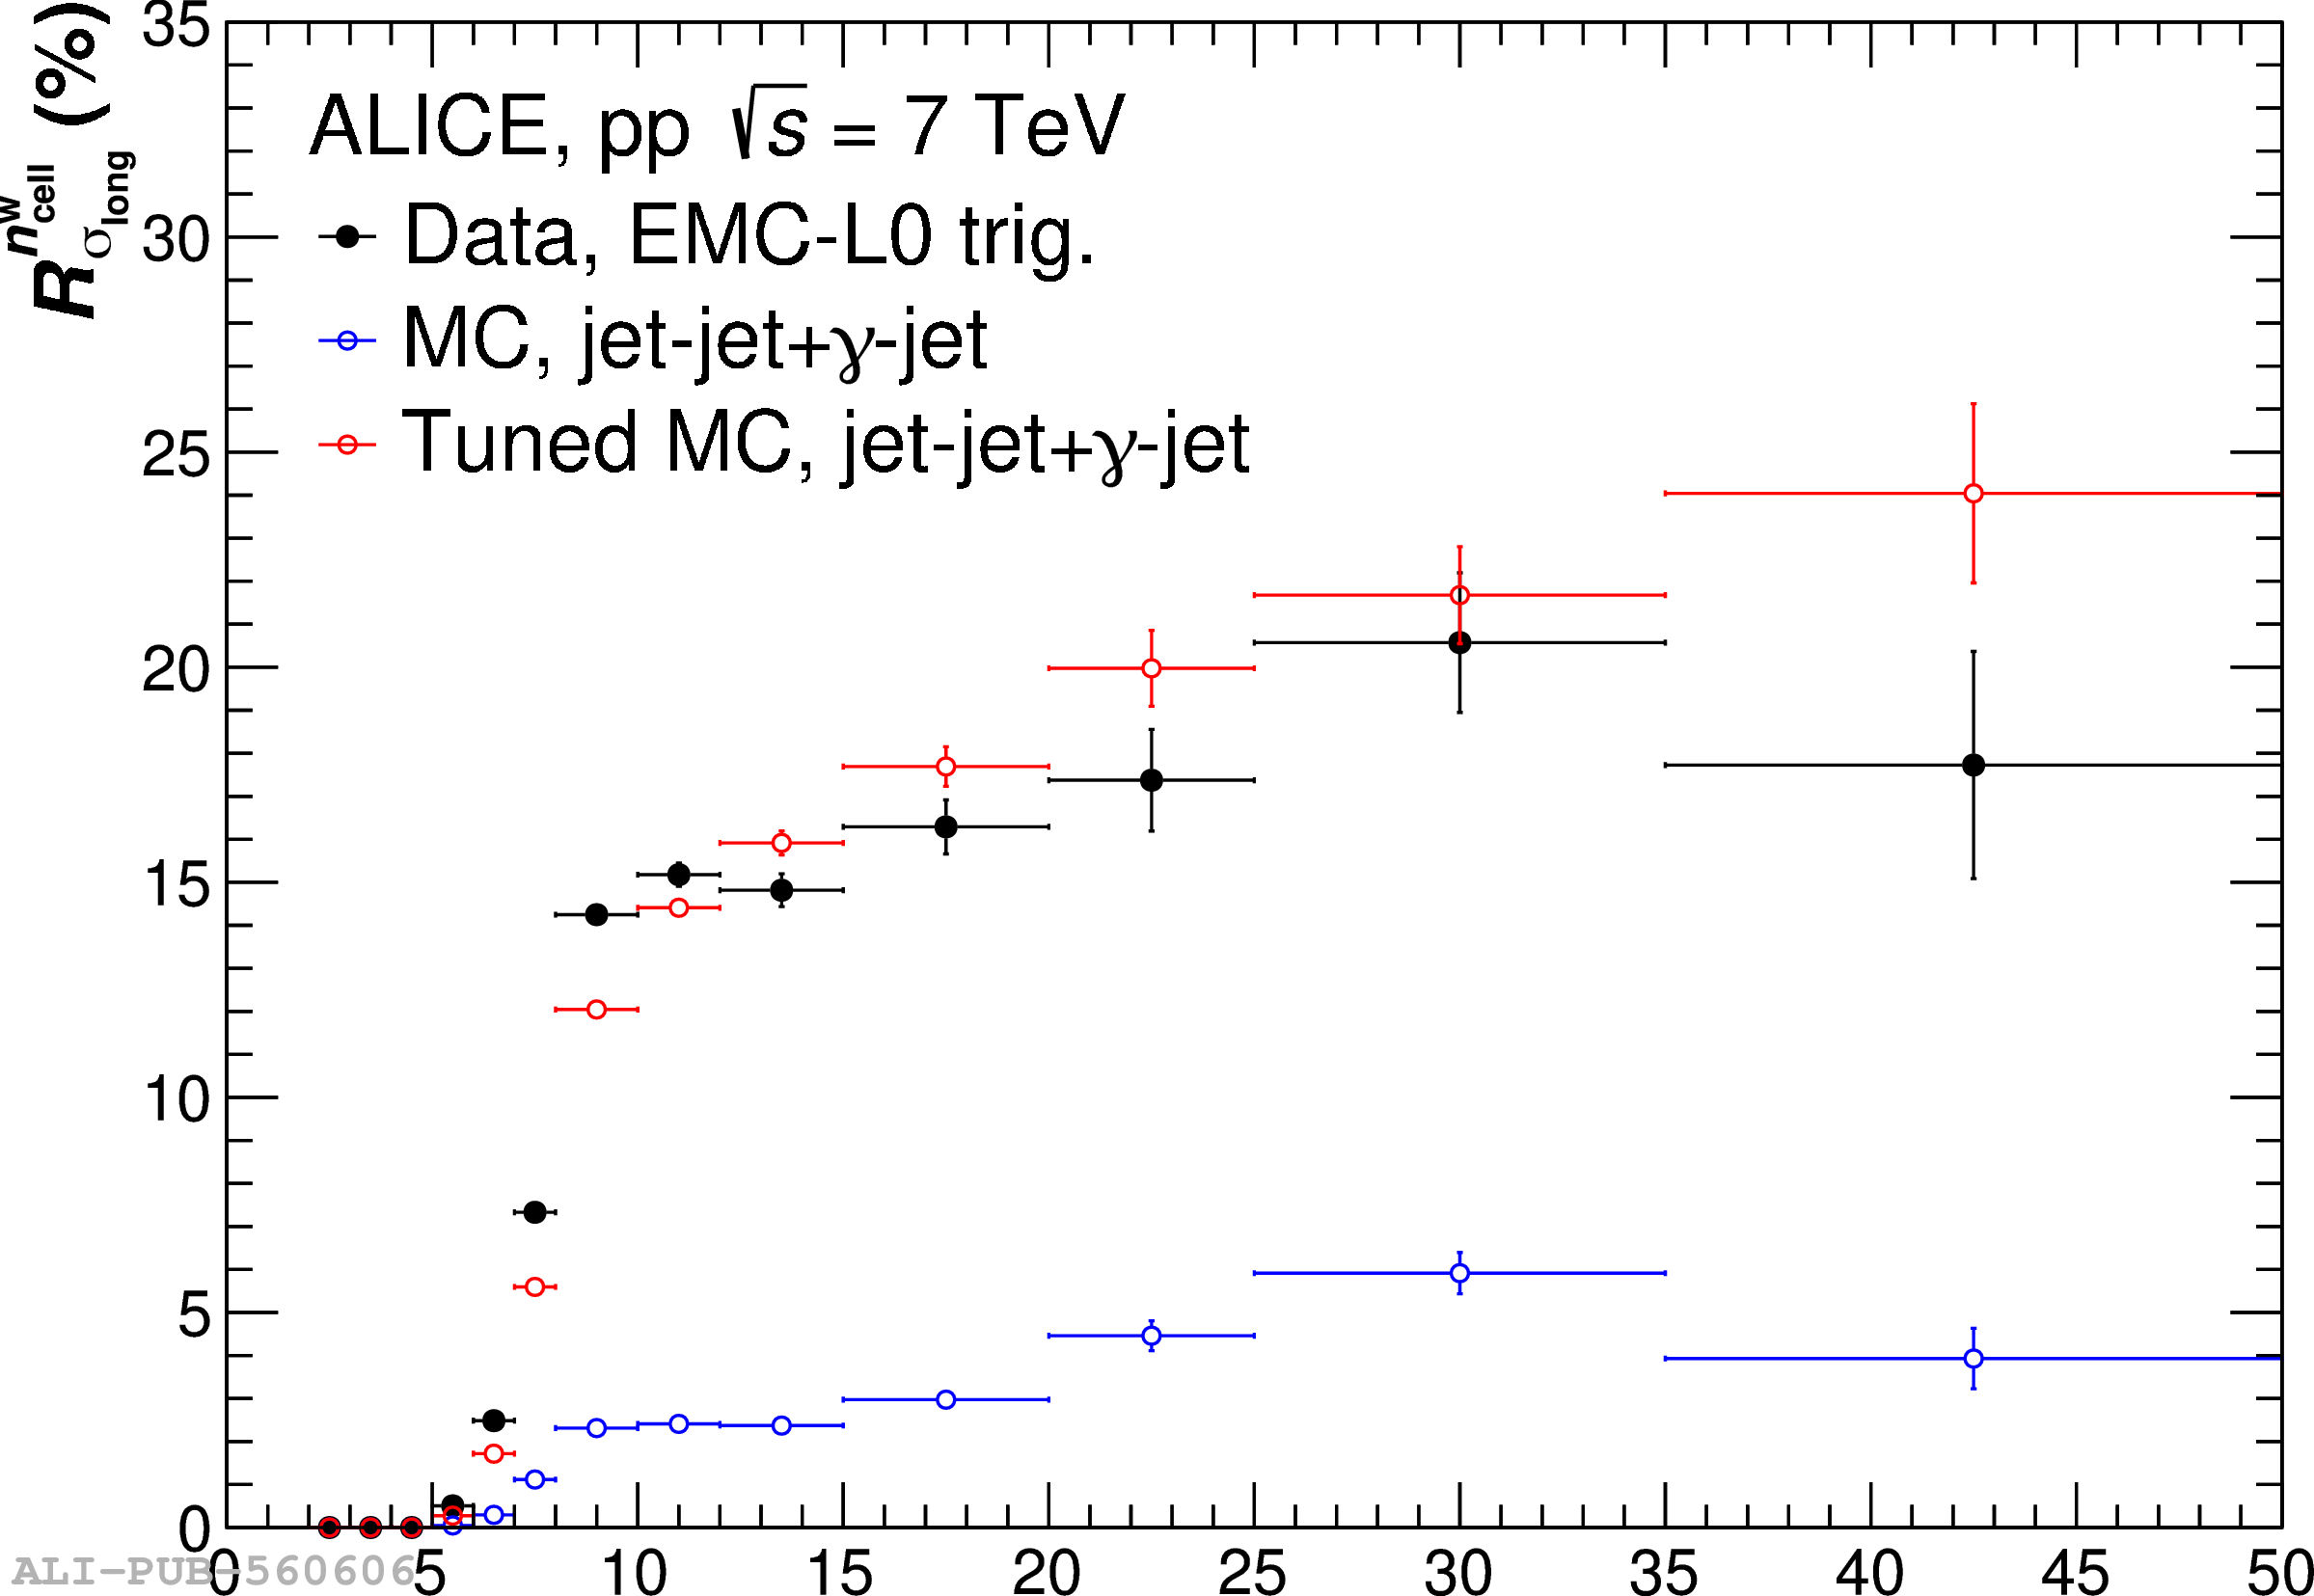 |