Probability distributions of the shower shape parameter $\shshlo$ of neutral clusters in data and simulations The different panels show different neutral cluster energy intervals. All distributions are normalized to their integral Data are shown as black histograms and simulations (\gls{PYTHIA}6 events with two jets or a direct photon and a jet in the final state, with \gls{GEANT}3 default settings) in blue. For the red histograms the modelling of the cross-talk observed in the \gls{EMCal} electronics was included in the simulations. | 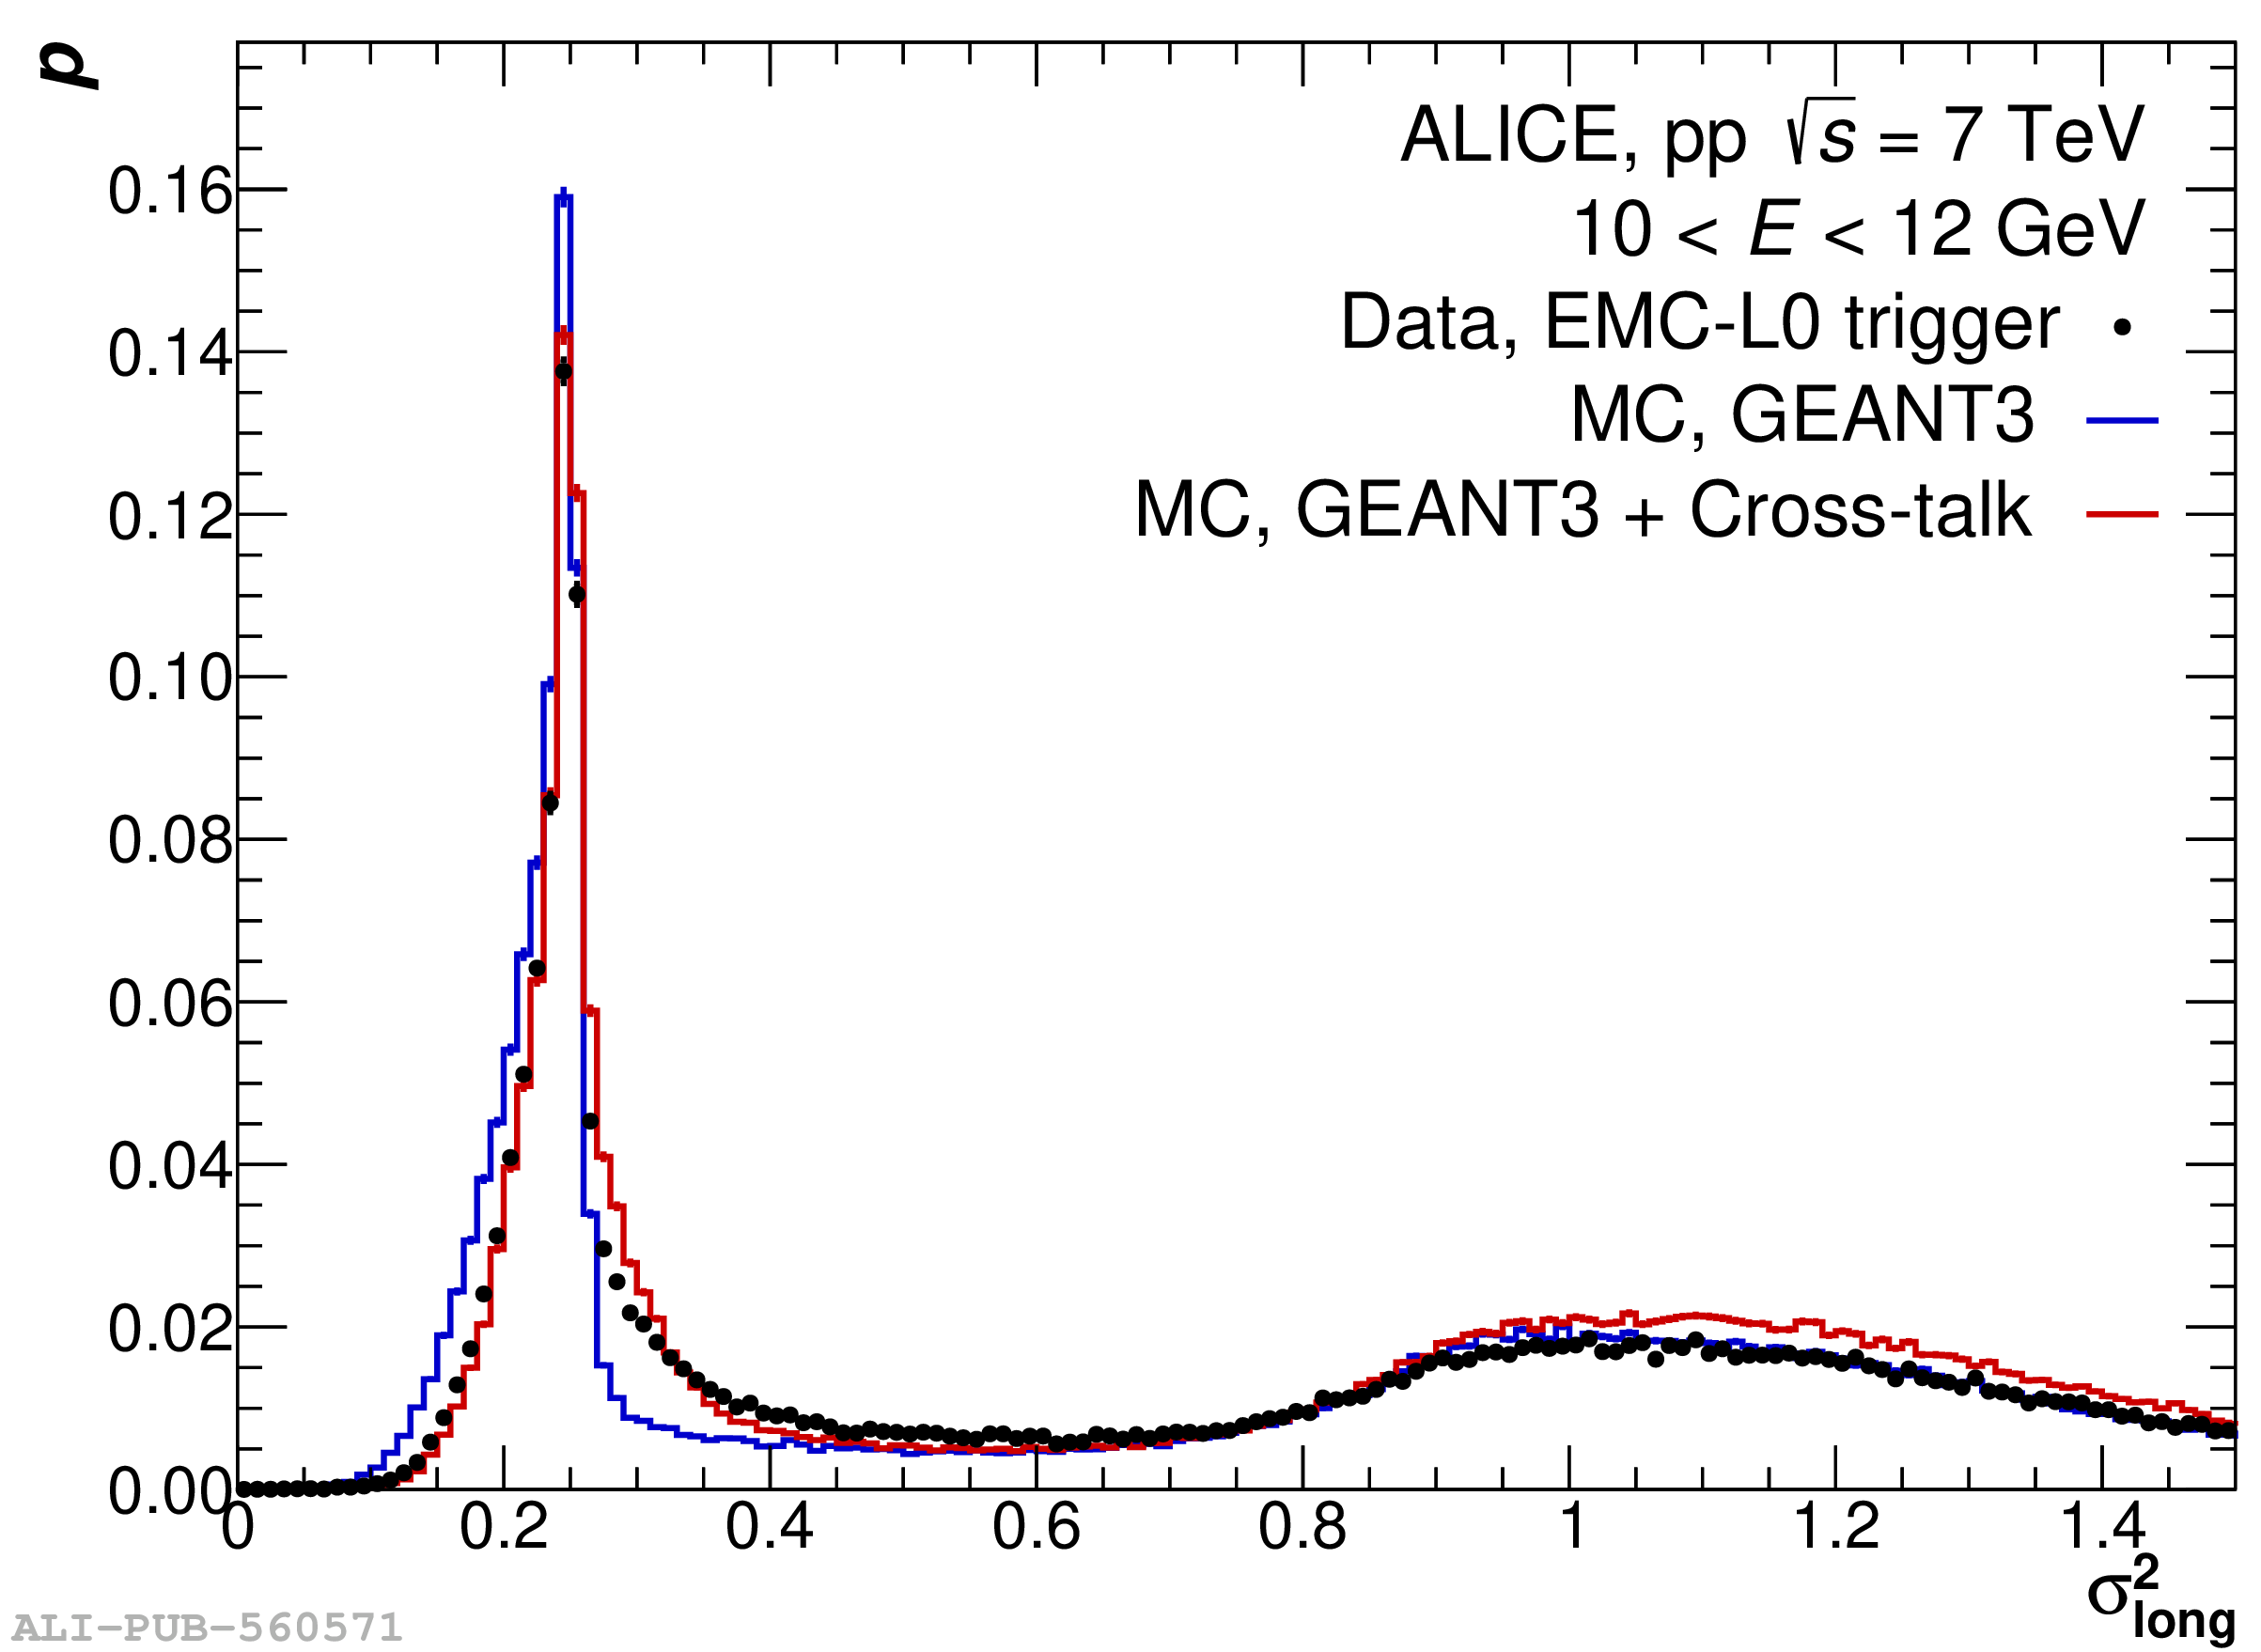 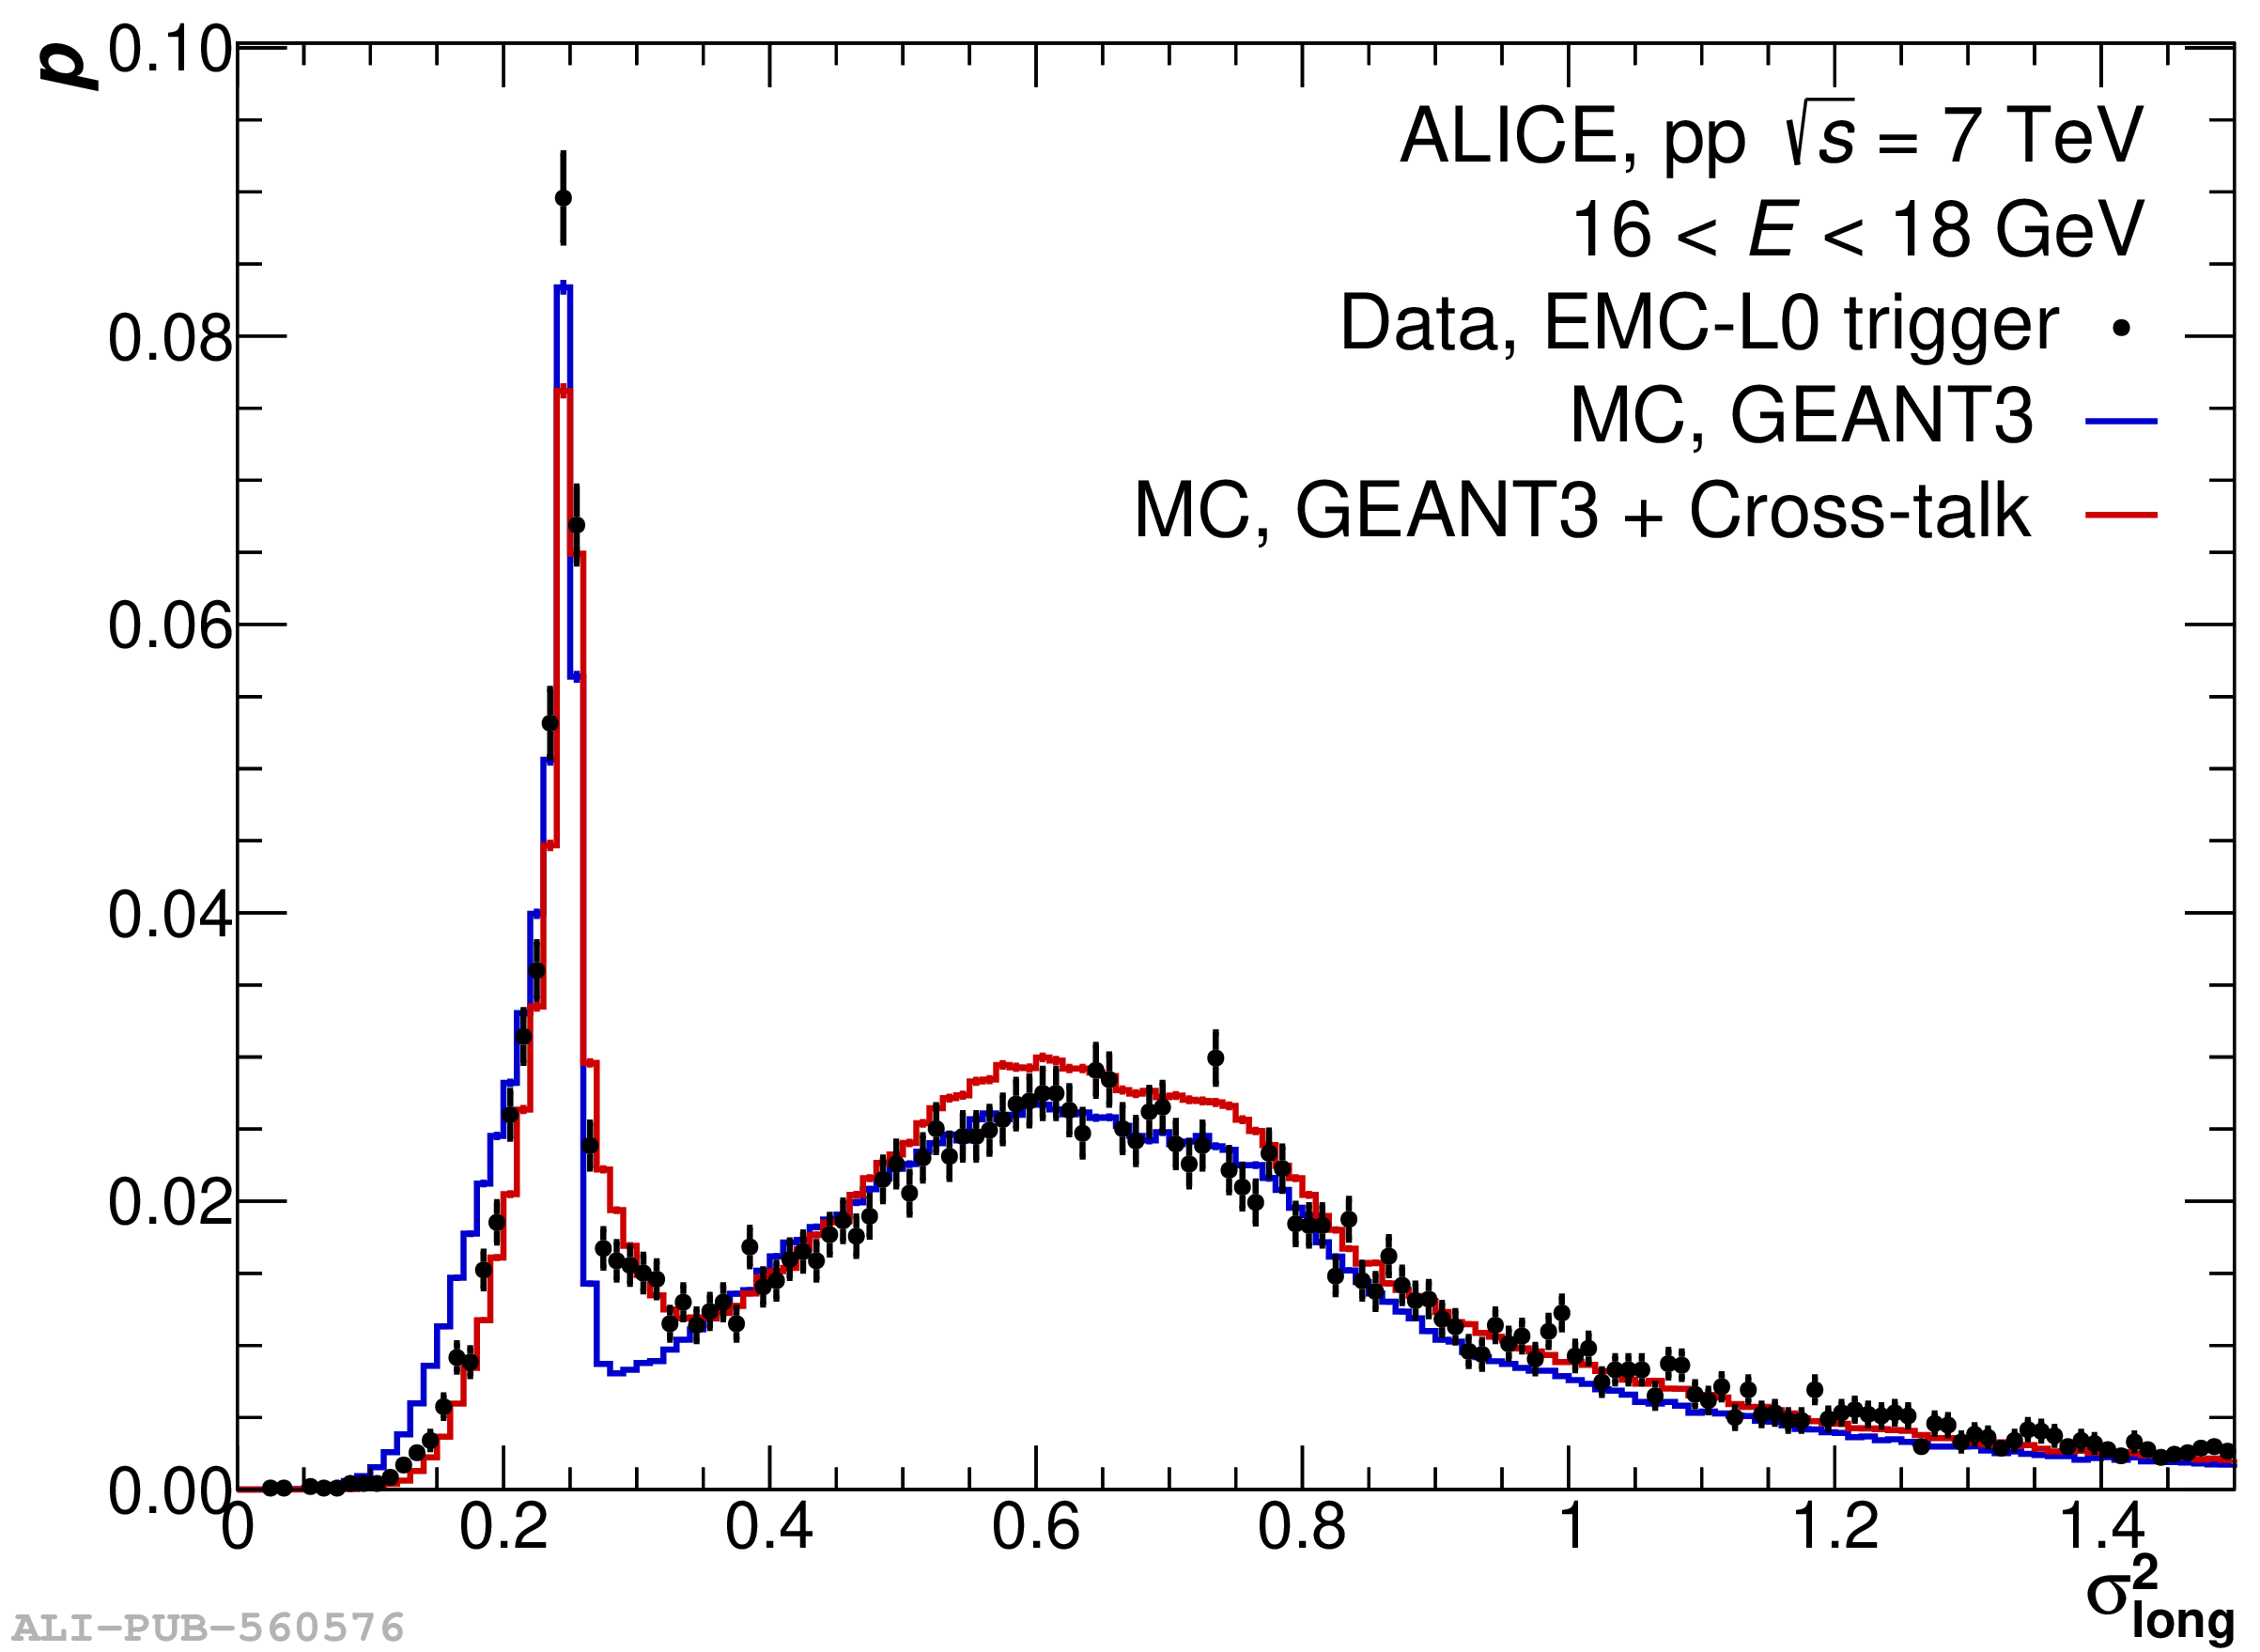  |