Left: Mass positions for \gls{PCM-EMC}(blue) and \gls{EMC} (green) after applying the nonlinearity correction obtained from \Sec{sec:TBNonLin} \Figure{fig:5-TB-EnergyNonLinearity}. The mass positions are normalized to the neutral pion rest mass. In the case of \gls{PCM-EMC} the data points represent the squared mass position. Right: Ratio of mass positions in data and \gls{MC} for both techniques with their corresponding fits according to \Eq{eq:convcalo}. | 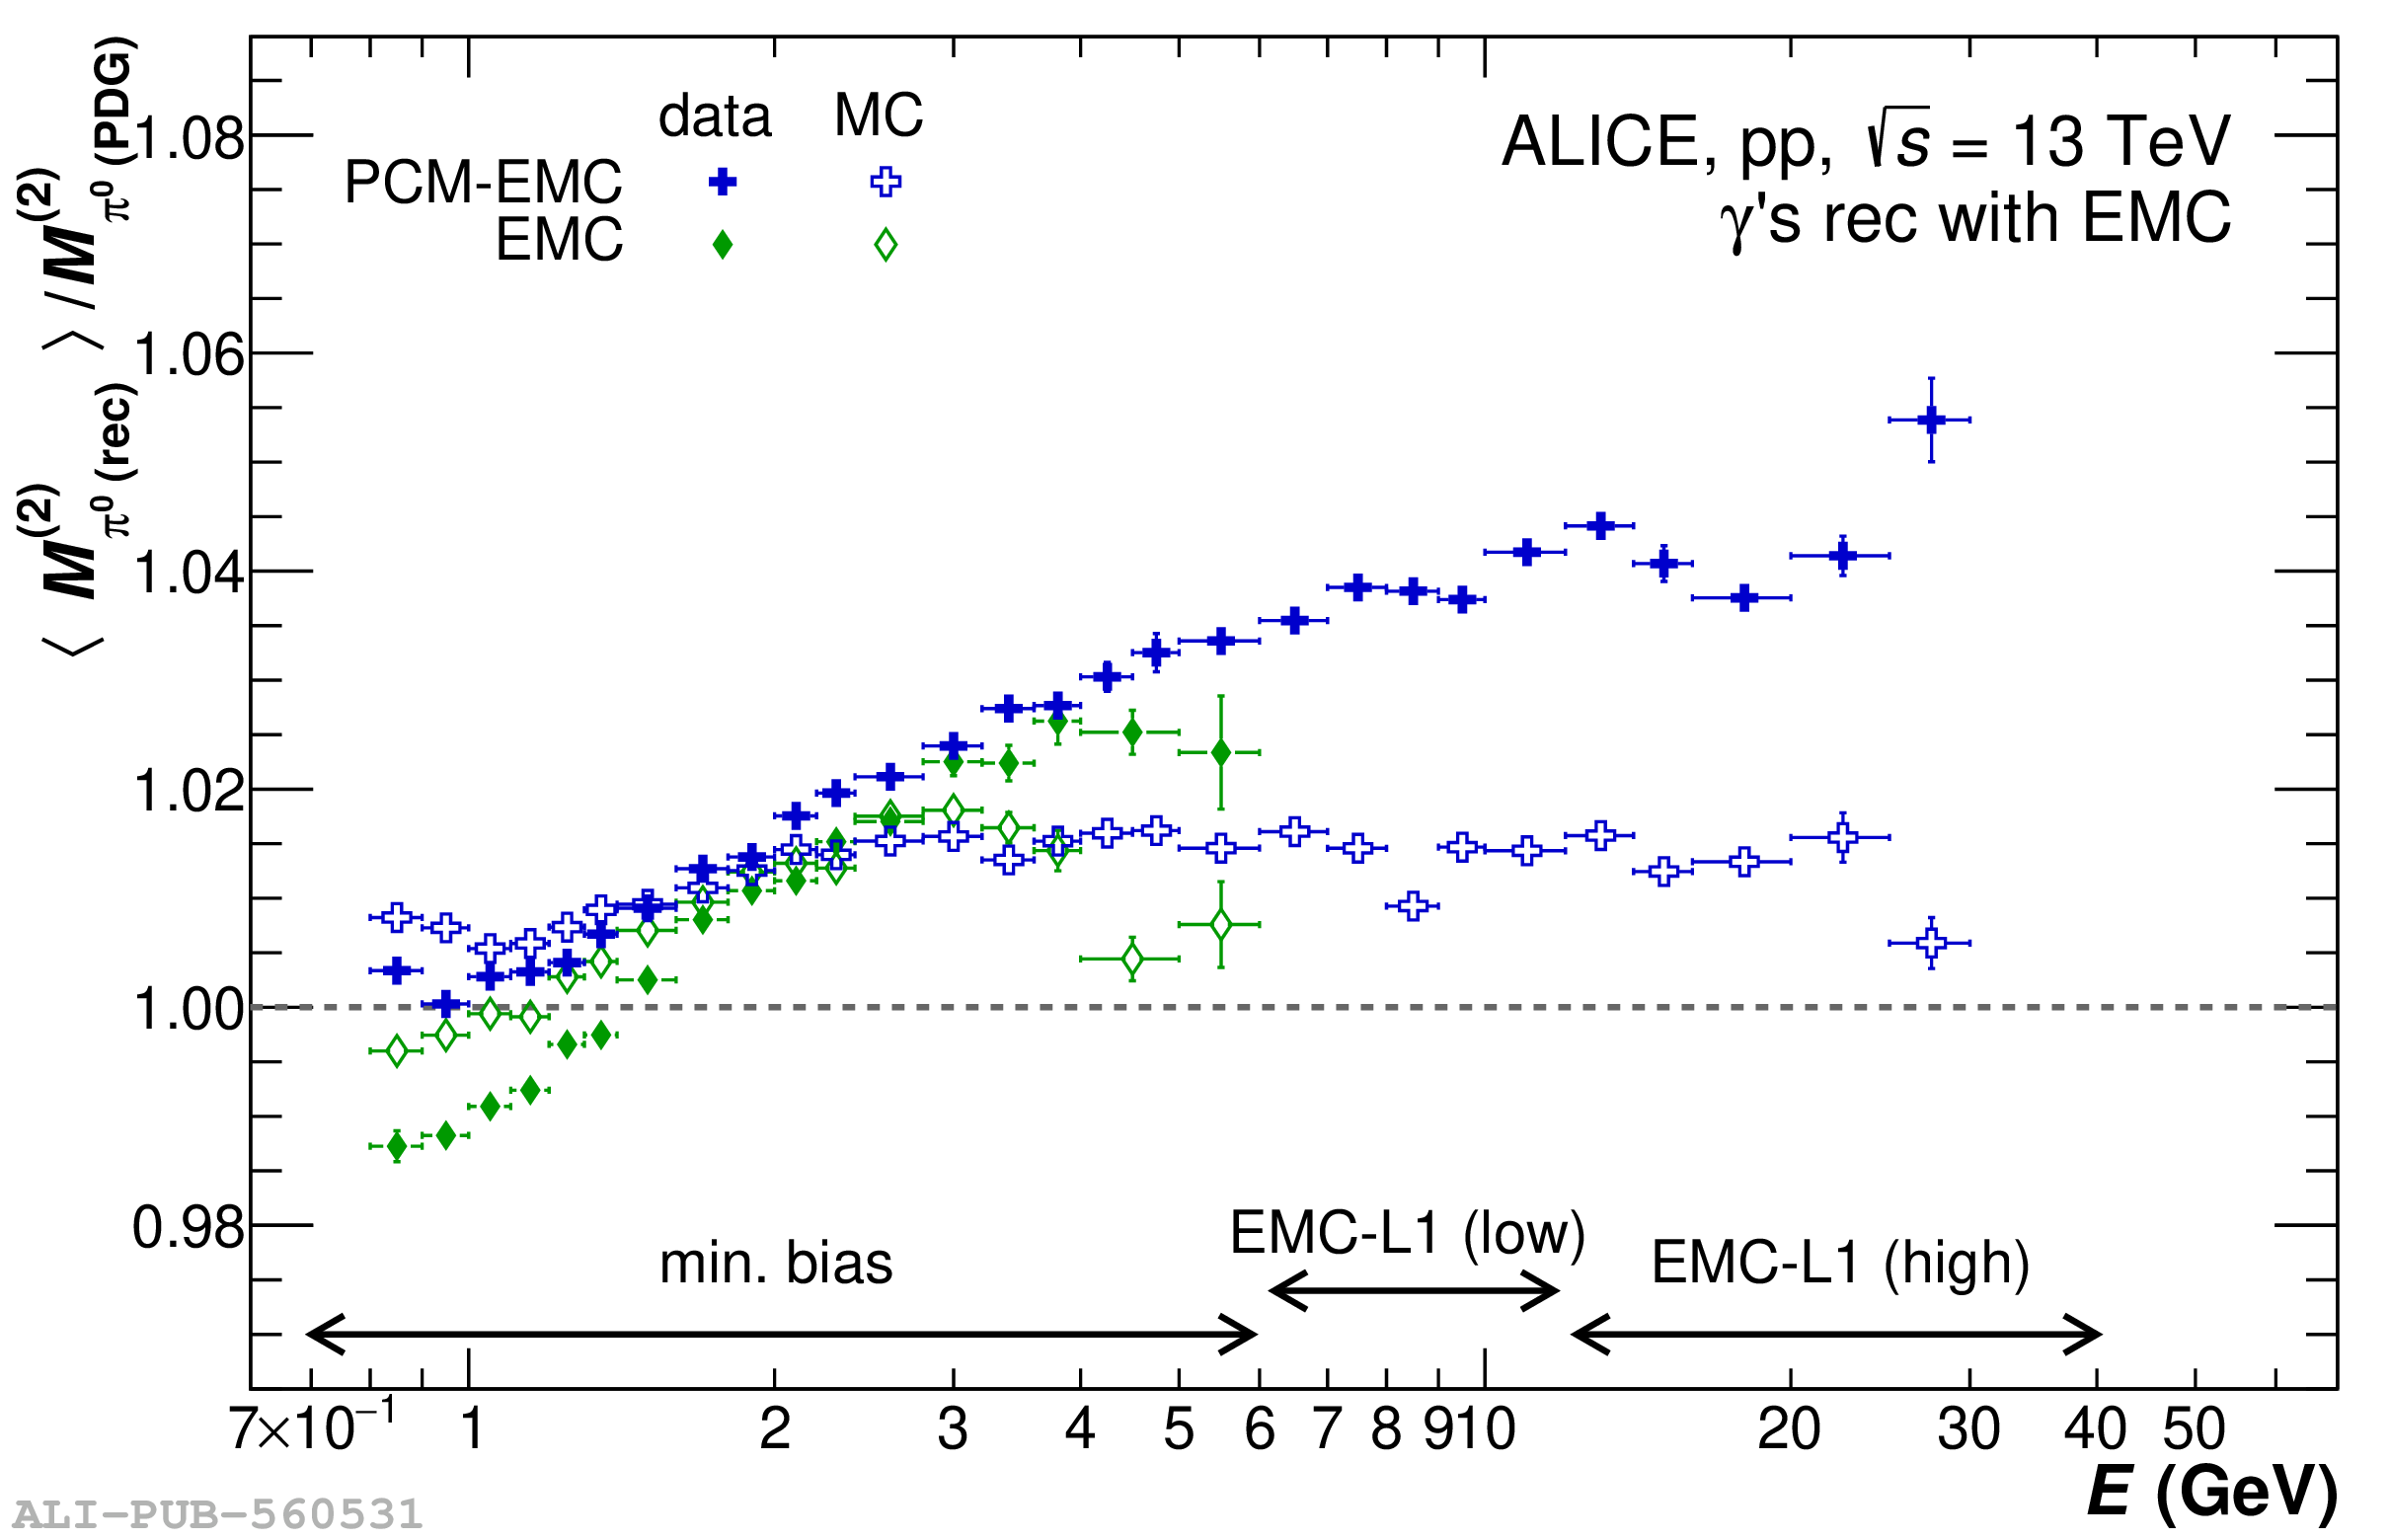  |