Comparison of the obtained temperature calibration parameters in the \gls{EMCal} (left) and \gls{DCal} (right). The same cells were chosen as for \Fig{fig:emcalTempExtr} The calibration parameters were obtained separately for all years during which the corresponding \gls{SM} was installed and the cell considered good. The accessible temperature ranges for each year are indicated by the shaded areas in the same colors as the corresponding fits for the respective years. | 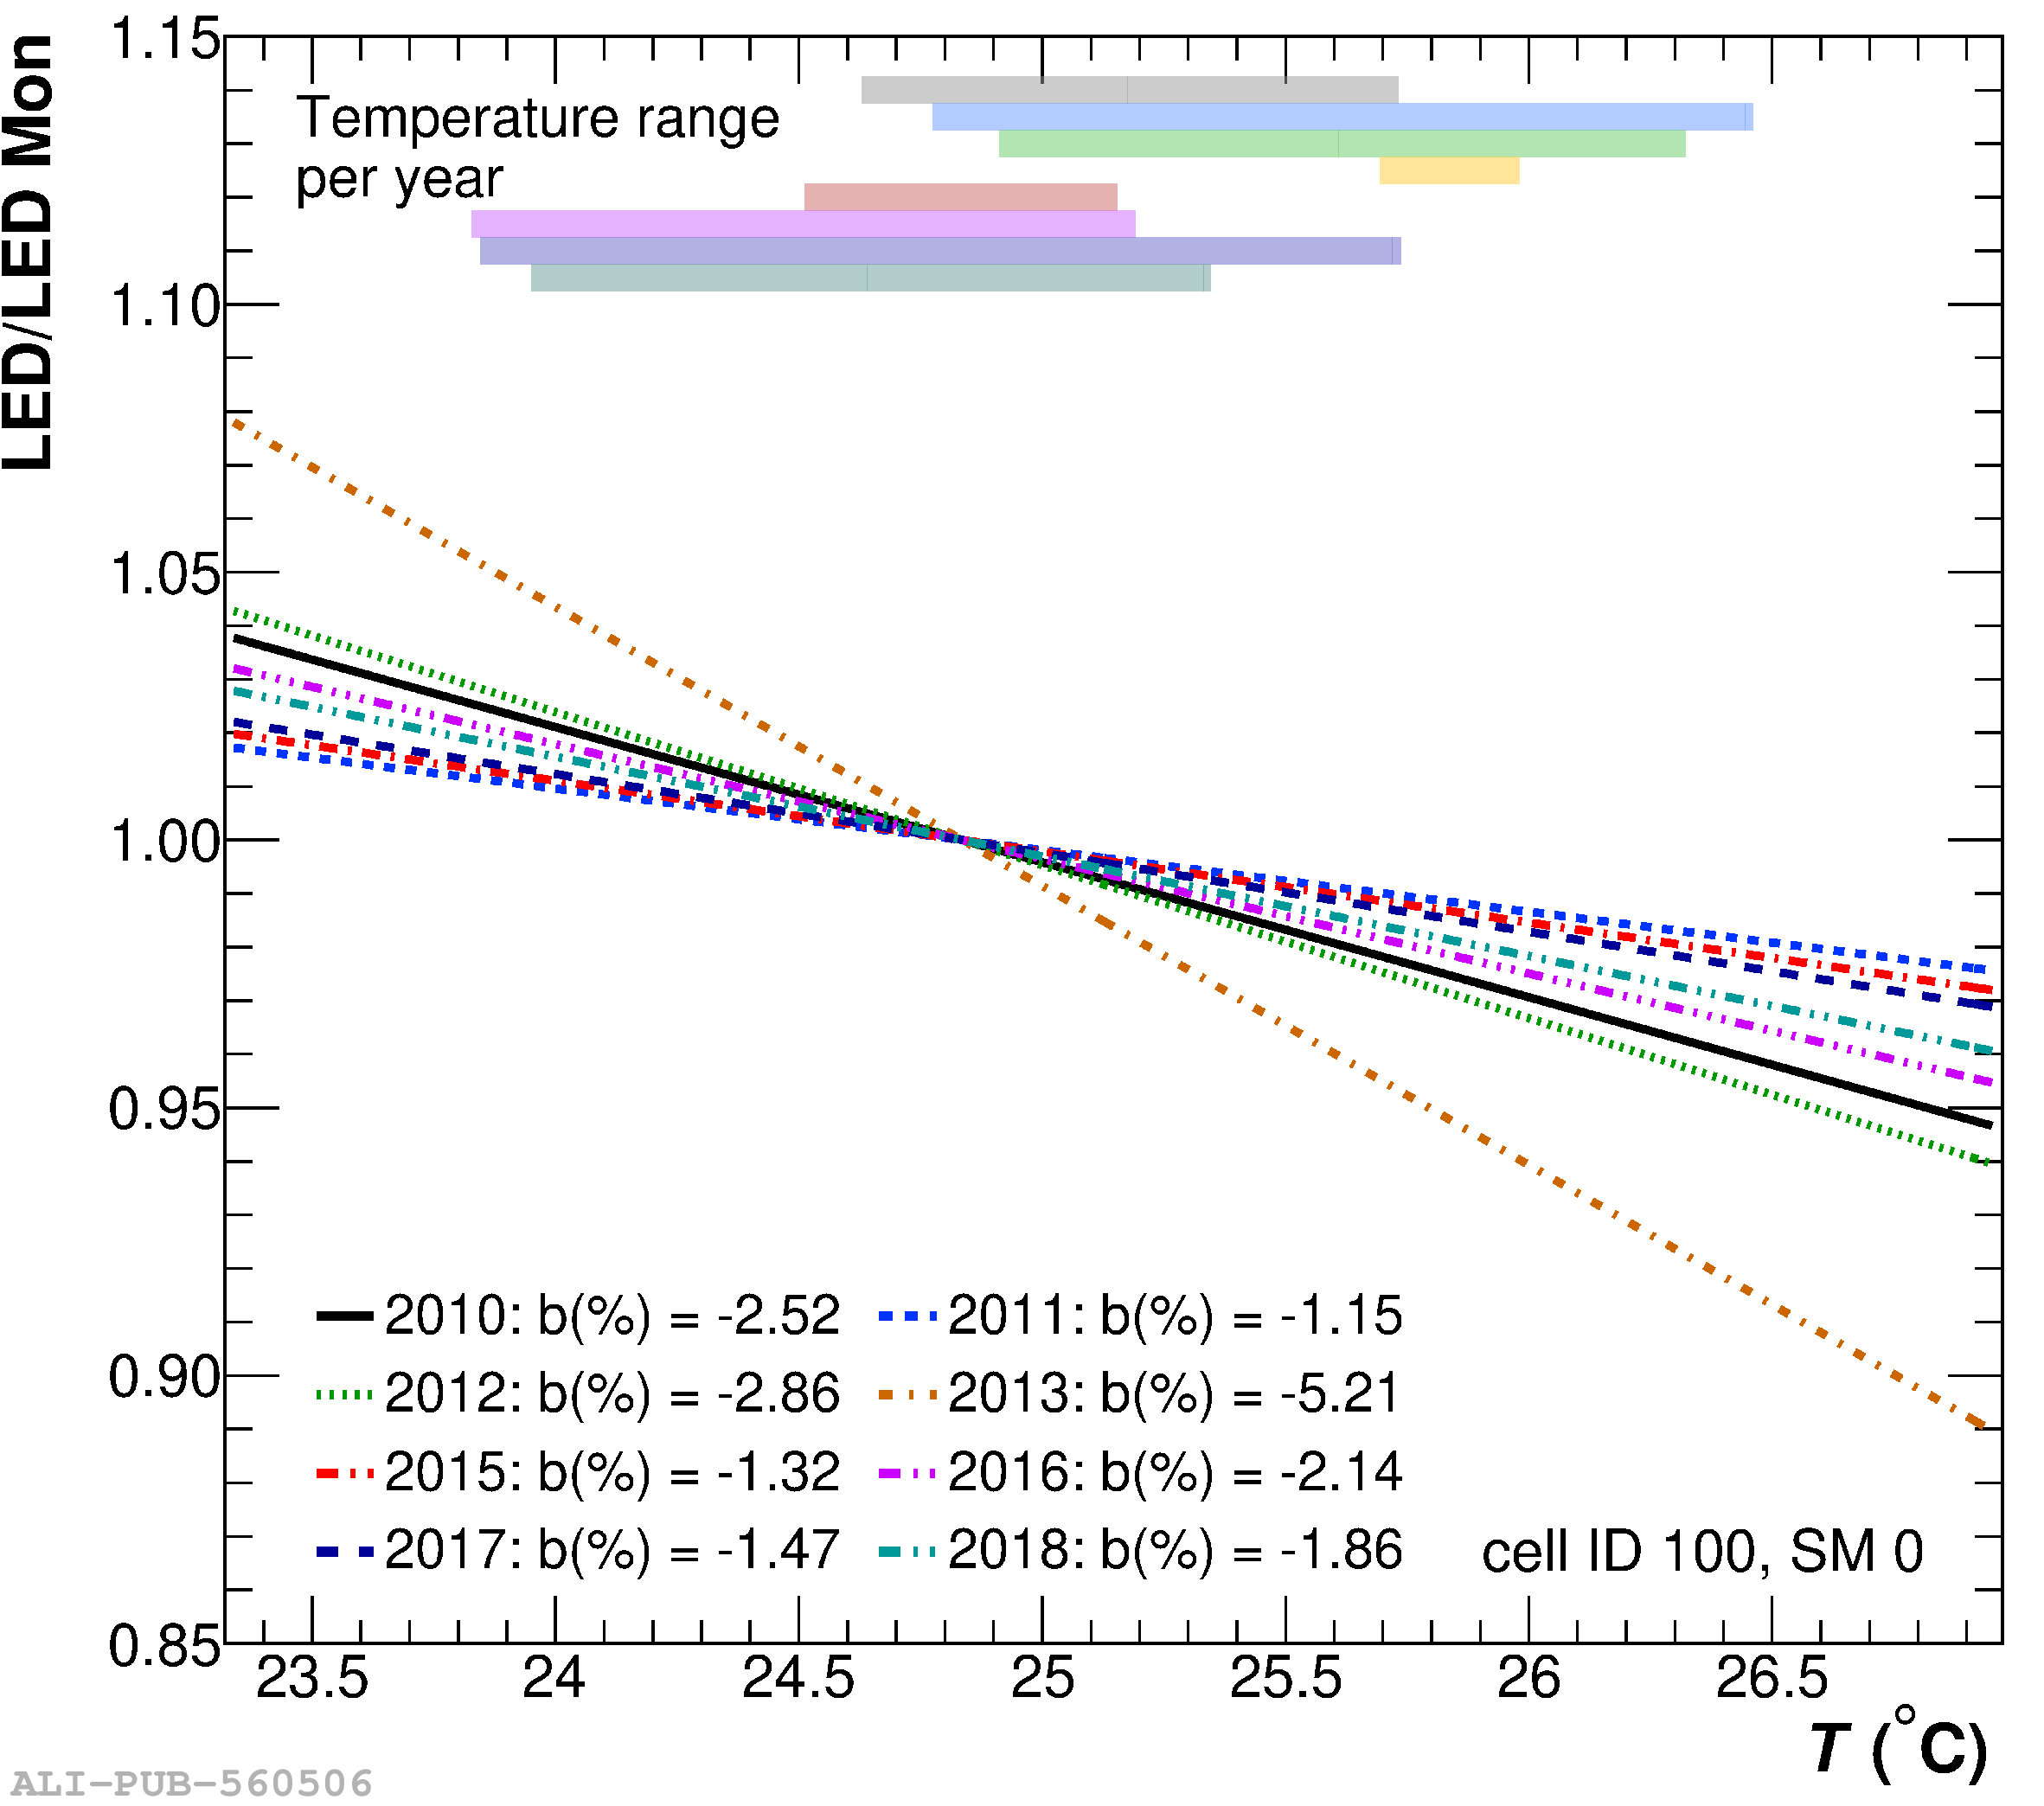 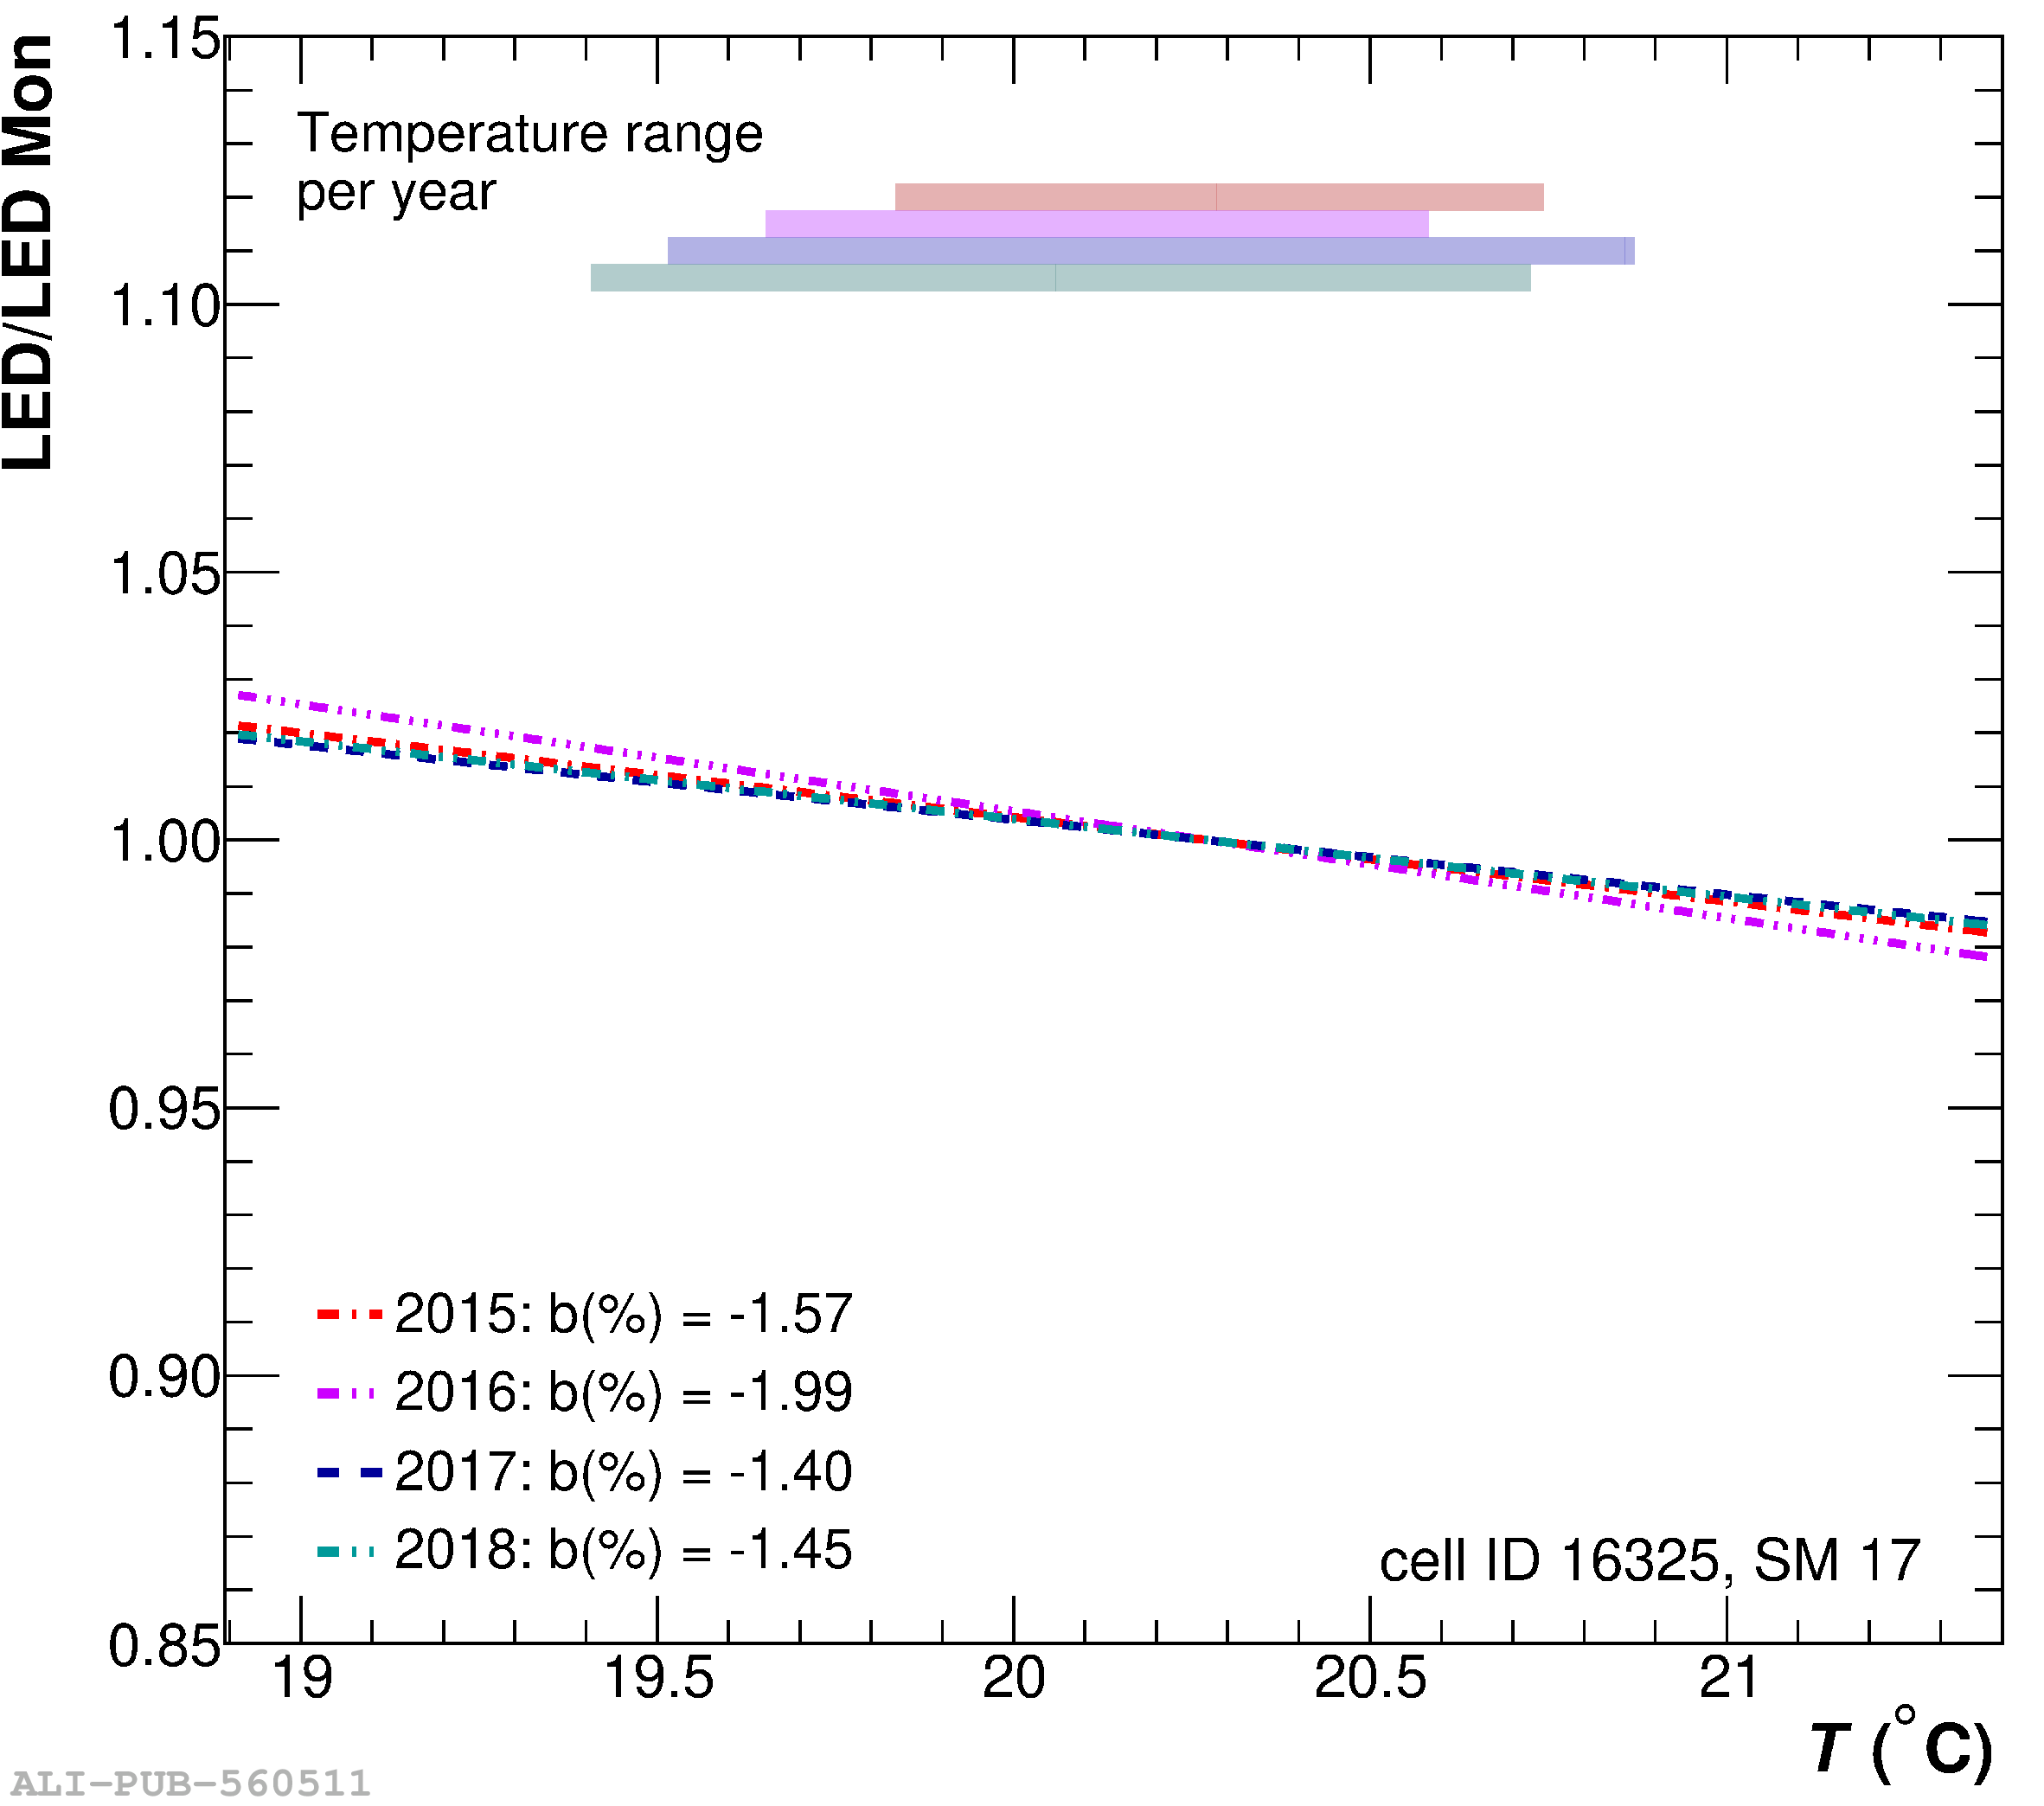 |