Left: number of cells as a function of the cluster energy found with the V2 clusterizer in \pp\ collisions at \sthirteen\ using the \gls{EMCal} high threshold \gls{L1} $\gamma$ trigger The region below the lines is populated by exotic clusters The distribution for each energy bin is normalized to its integral. Right: comparison of $n_{\text{cells}}$ probability distributions for measured data (black), projection of the left plot, to simulated (blue) collisions for two different cluster energy bins. Each distribution is normalized by the integral of the distribution for $n_{\rm cells}$ > 10. | 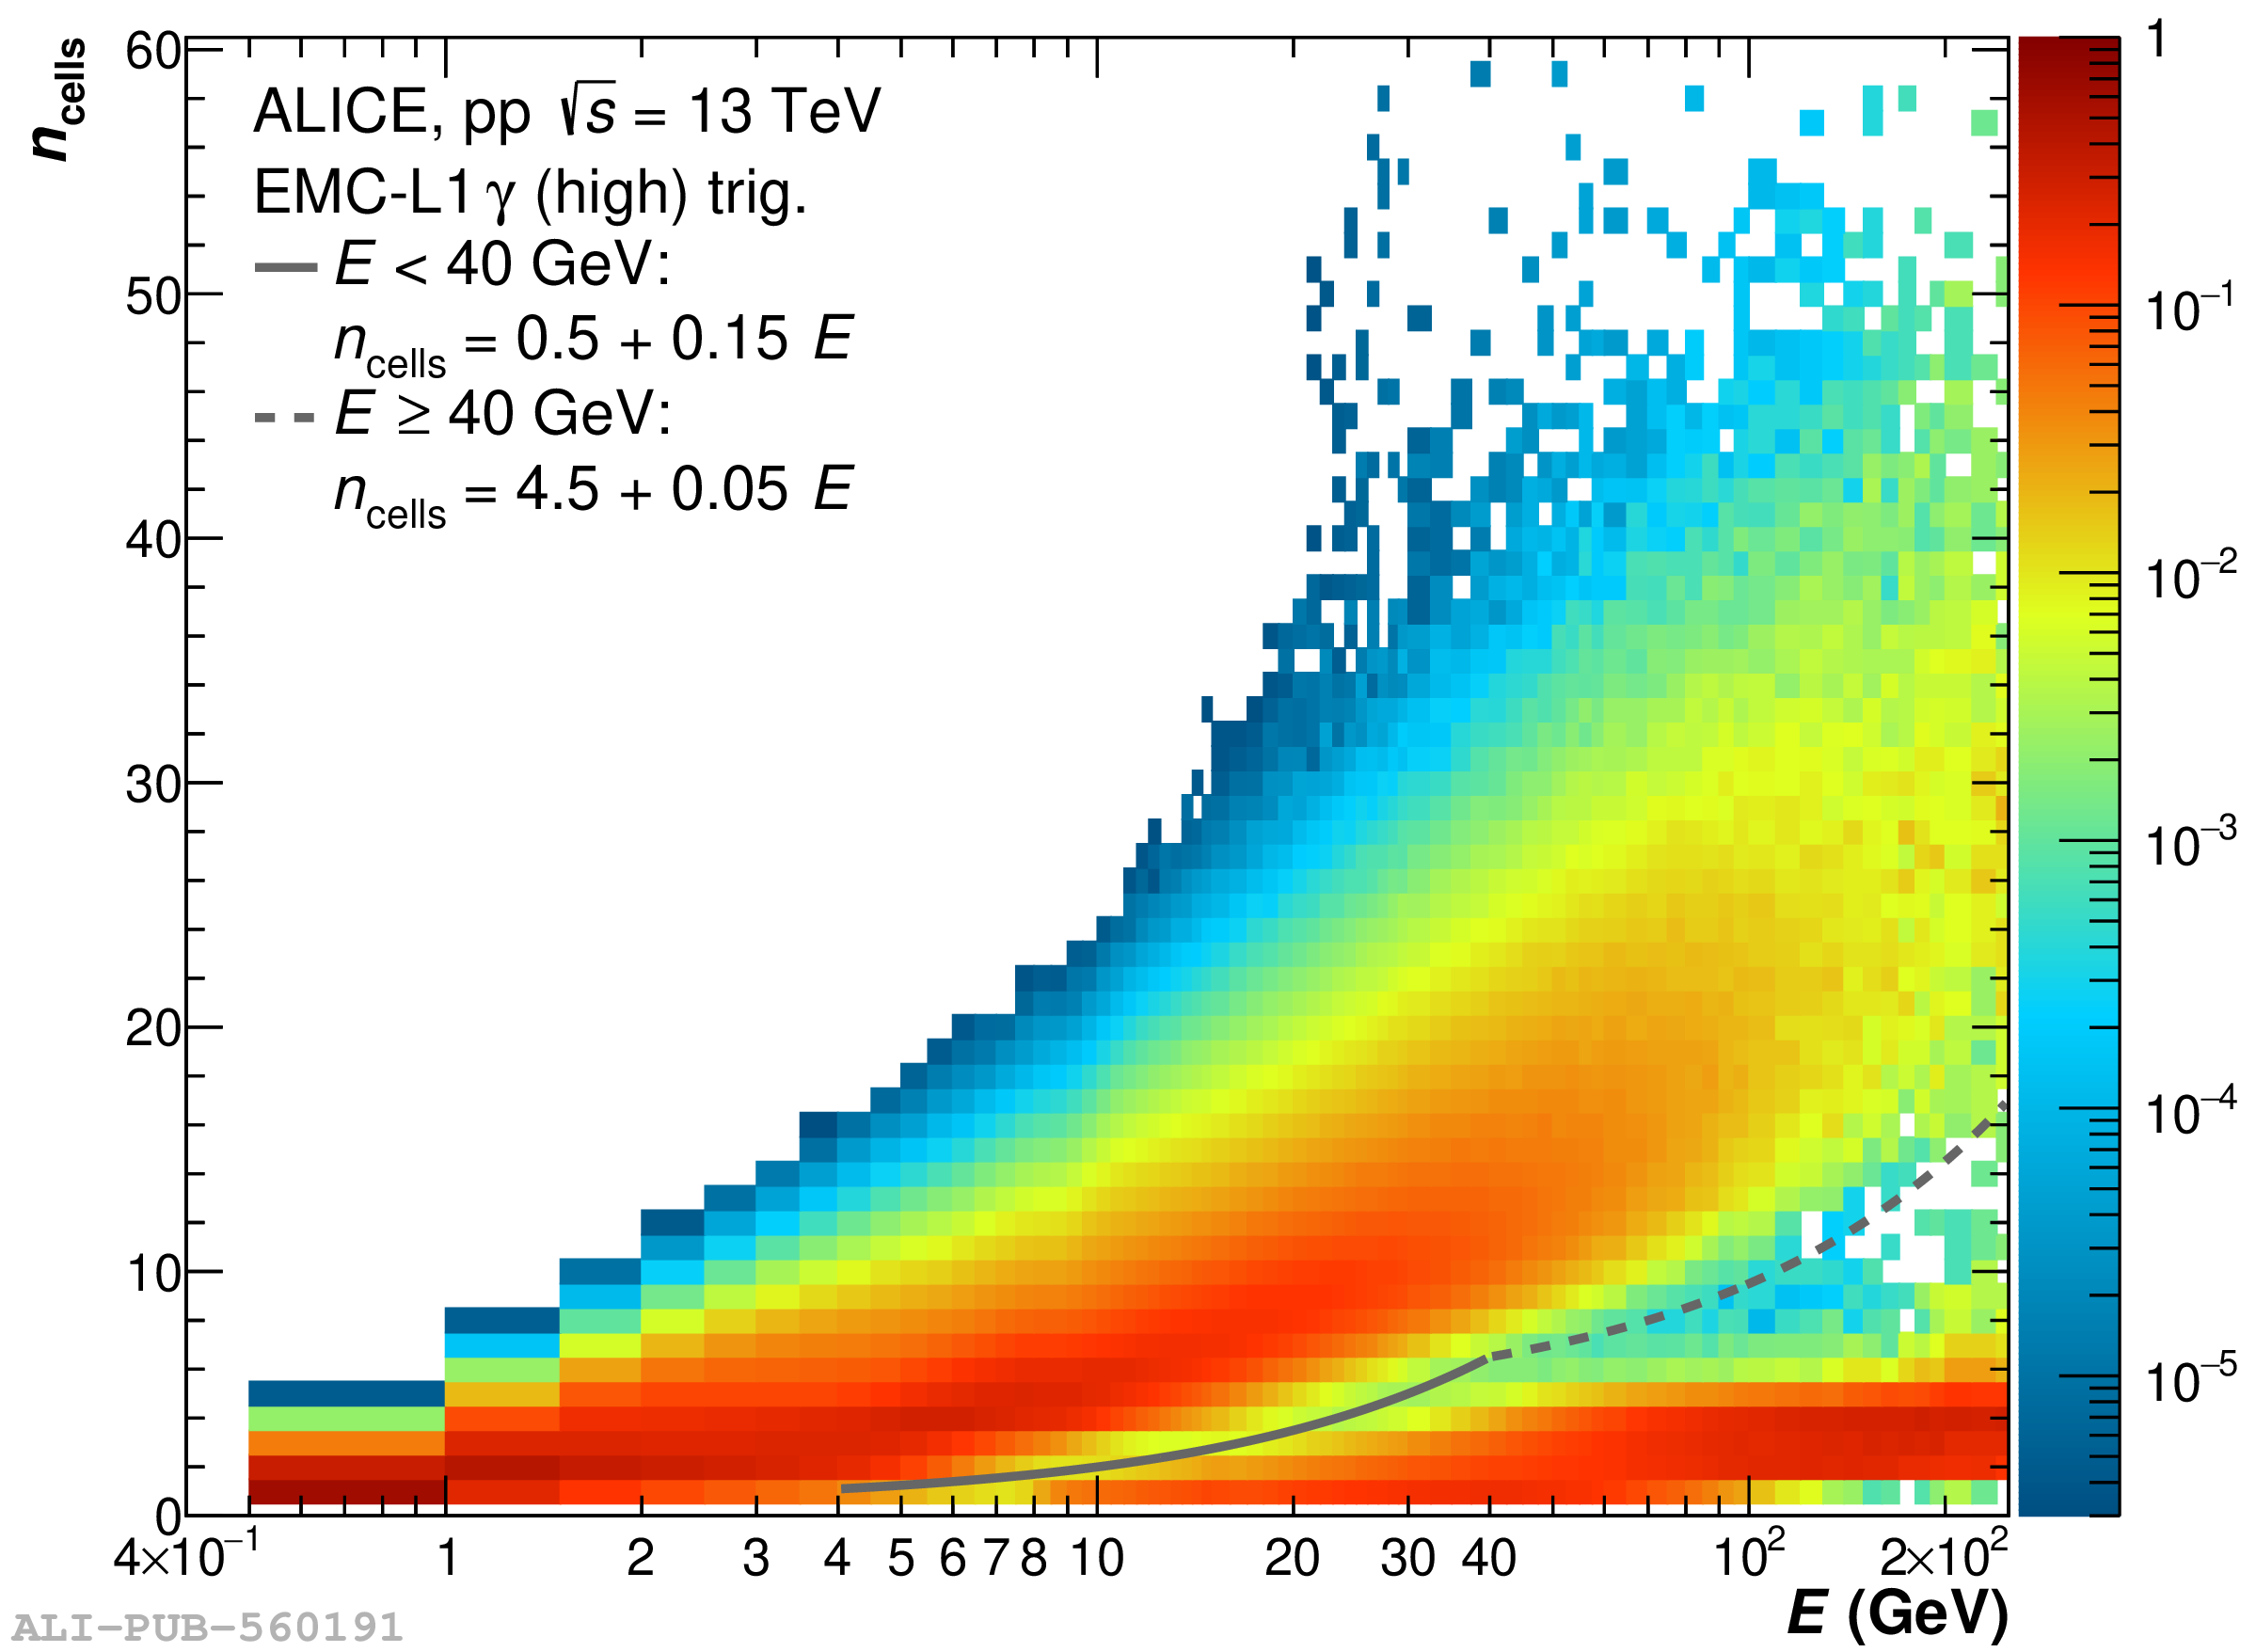 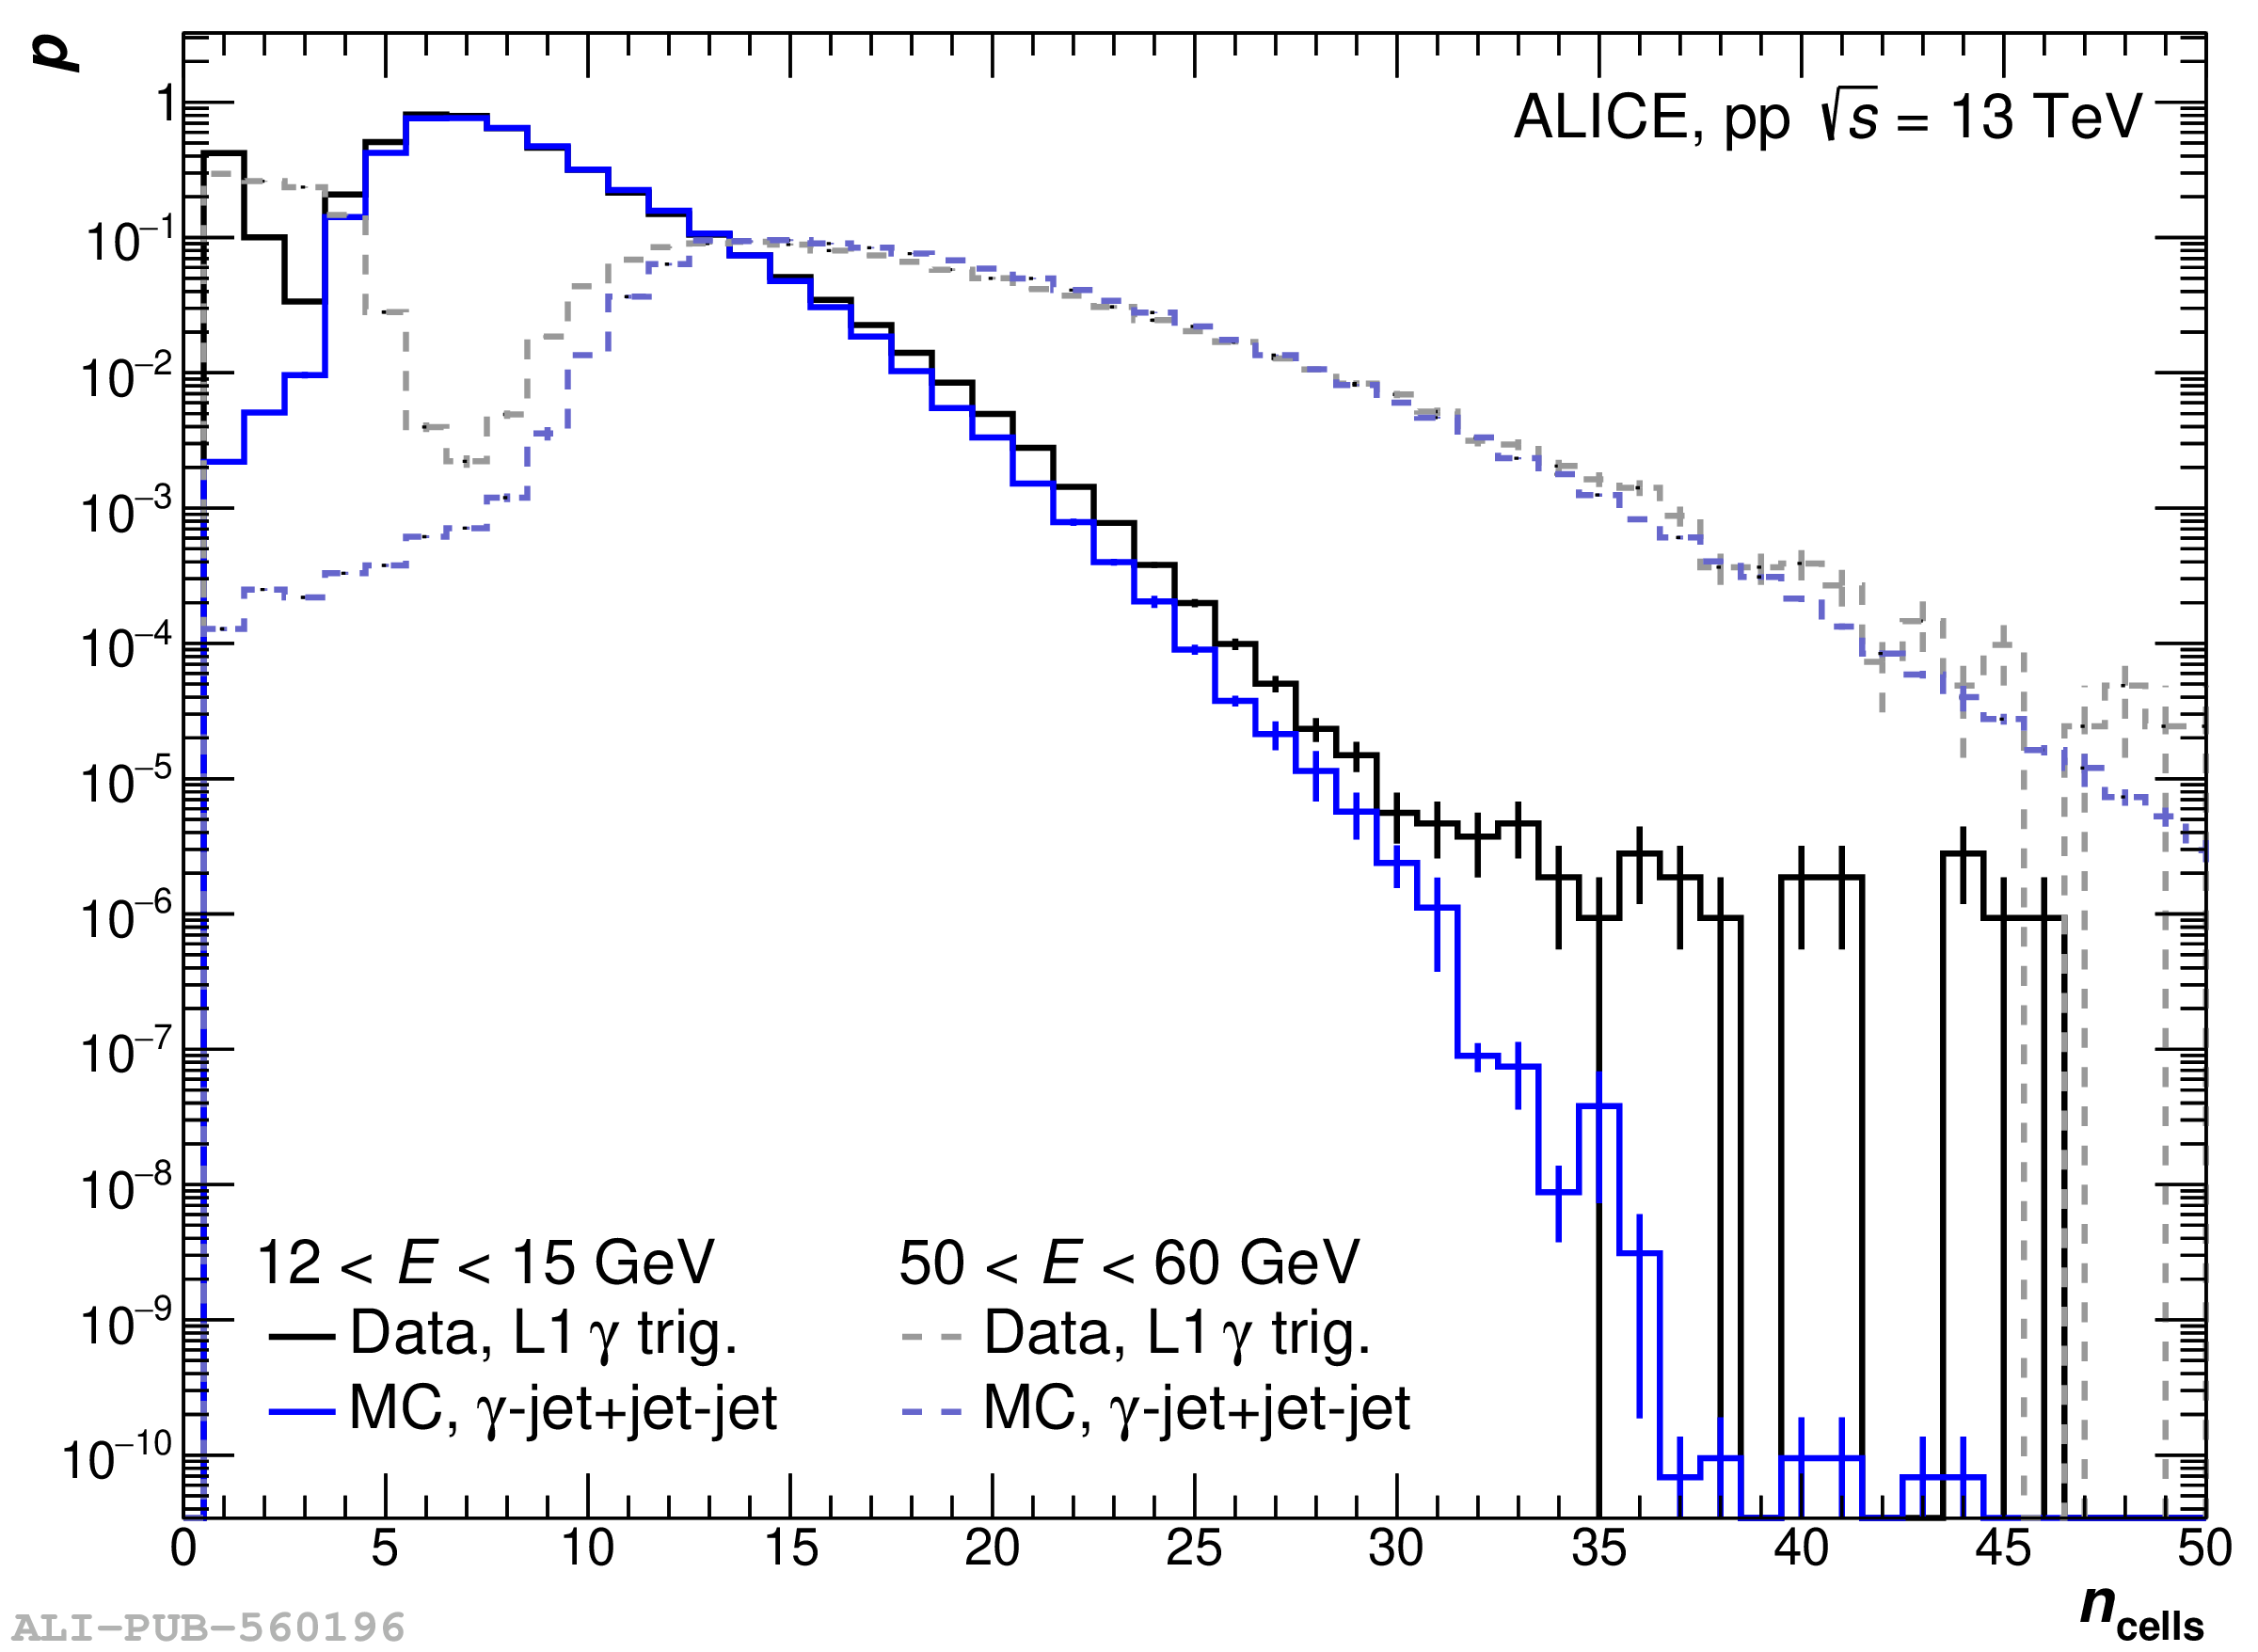 |